| Param | Original file | Final file |
|---|---|---|
| Filename | modeM0/AS1G04_003T02_9000000236cztM0_level2.fits | modeM0/AS1G04_003T02_9000000236cztM0_level2_quad_clean.evt |
| Size (bytes) | 301,662,720 | 448,231,680 |
| Size | 287.7 MB | 427.5 MB |
| Events in quadrant A | 1,675,352 | 2,805,140 |
| Events in quadrant B | 1,719,222 | 2,894,975 |
| Events in quadrant C | 1,720,680 | 2,778,408 |
| Events in quadrant D | 1,481,230 | 2,559,092 |
| Mode SS | |||
|---|---|---|---|
| Quadrant | BADHDUFLAG | Total packets | Discarded packets |
| A | 0 | 752 | 0 |
| B | 0 | 752 | 0 |
| C | 0 | 752 | 0 |
| D | 0 | 752 | 0 |
| Mode M0 | |||
|---|---|---|---|
| Quadrant | BADHDUFLAG | Total packets | Discarded packets |
| A | 0 | 188797 | 0 |
| B | 0 | 164359 | 0 |
| C | 0 | 154483 | 0 |
| D | 0 | 146844 | 0 |
| Mode M9 | |||
|---|---|---|---|
| Quadrant | BADHDUFLAG | Total packets | Discarded packets |
| A | 0 | 75 | 0 |
| B | 0 | 75 | 0 |
| C | 0 | 75 | 0 |
| D | 0 | 75 | 0 |
| Quadrant | Total seconds | Saturated seconds | Saturation percentage |
|---|---|---|---|
| A | 36963 | 1271 | 3.438574% |
| B | 36963 | 233 | 0.630360% |
| C | 36963 | 134 | 0.362525% |
| D | 36963 | 536 | 1.450099% |
Noise dominated data is calculated using 1-second bins in cleaned event files. If a bin has >2000 counts, and if more than 50% of those come from <1% of pixels, then it is considered to be noise-dominated and hence unusable.
| Quadrant | # 1 sec bins | Bins with >0 counts | Bins with >2000 counts | High rate bins dominated by noise | Noise dominated (total time) | Noise dominated (detector-on time) | Marked lightcurve |
|---|---|---|---|---|---|---|---|
| A | 44398 | 36956 | 0 | 0 | 0.00% | 0.00% |  |
| B | 44398 | 36952 | 0 | 0 | 0.00% | 0.00% |  |
| C | 44398 | 36960 | 0 | 0 | 0.00% | 0.00% |  |
| D | 44398 | 36952 | 0 | 0 | 0.00% | 0.00% |  |
Top three noisy pixels from each quadrant. If the there are fewer than three noisy pixels in the level2.evt file, extra rows are filled as -1
| Pixel properties | Quadrant properties | ||||||
|---|---|---|---|---|---|---|---|
| Quadrant | DetID | PixID | Counts | Sigma | Mean | Median | Sigma |
| A | 0 | 29 | 1613 | 11.84 | 434 | 406 | 101.9 |
| A | 7 | 110 | 1495 | 10.69 | 434 | 406 | 101.9 |
| A | 14 | 188 | 1362 | 9.38 | 434 | 406 | 101.9 |
| B | 2 | 9 | 1368 | 11.25 | 454 | 433 | 83.1 |
| B | 5 | 128 | 1196 | 9.18 | 454 | 433 | 83.1 |
| B | 14 | 254 | 1107 | 8.11 | 454 | 433 | 83.1 |
| C | 12 | 241 | 1163 | 6.62 | 454 | 420 | 112.2 |
| C | 1 | 81 | 1148 | 6.49 | 454 | 420 | 112.2 |
| C | 9 | 242 | 1135 | 6.37 | 454 | 420 | 112.2 |
| D | 10 | 189 | 1076 | 6.88 | 422 | 388 | 99.9 |
| D | 11 | 82 | 1063 | 6.75 | 422 | 388 | 99.9 |
| D | 6 | 231 | 1040 | 6.52 | 422 | 388 | 99.9 |
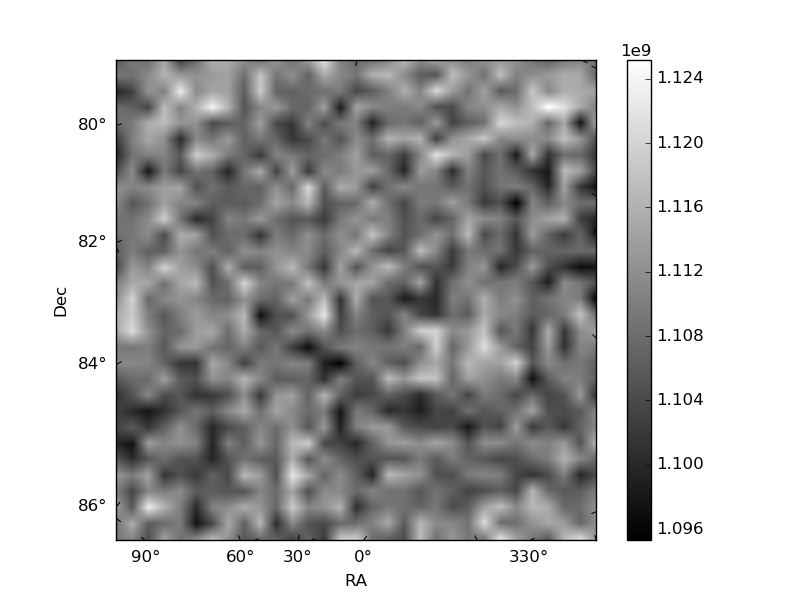
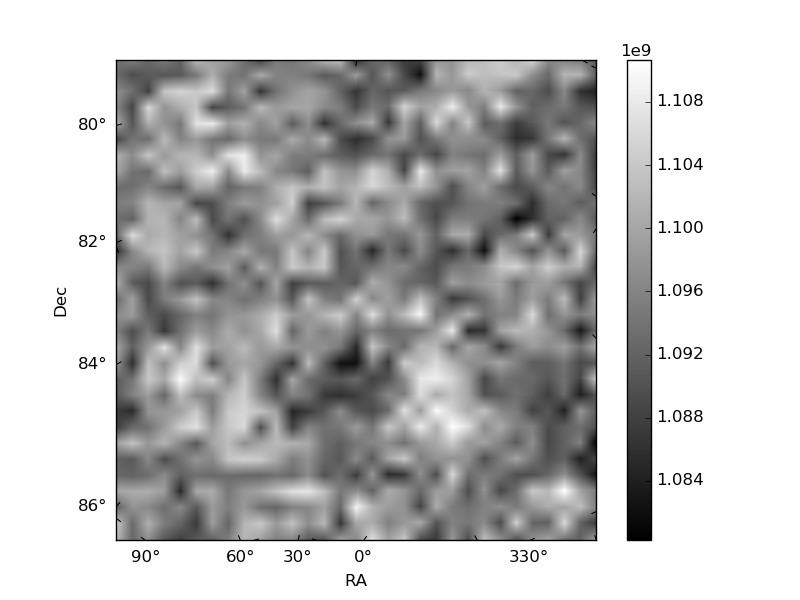
Histogram calculated using DETX and DETY for each event in the final _common_clean file
| Quadrant A |  |
 |
Quadrant B |
|---|---|---|---|
| Quadrant D |  |
 |
Quadrant C |
| Plot type | Count rate plots | Images |
|---|---|---|
| Comparison with Poisson distribution Blue bars denote a histogram of data divided into 1 sec bins. Red curve is a Poisson curve with rate = median count rate of data. |
 |
 |
| Quadrant-wise count rates Data is divided into 100 sec bins |
 |
|
| Module-wise count rates for Quadrant A Data is divided into 100 sec bins |
 |
 |
| Module-wise count rates for Quadrant B Data is divided into 100 sec bins |
 |
 |
| Module-wise count rates for Quadrant C Data is divided into 100 sec bins |
 |
 |
| Module-wise count rates for Quadrant D Data is divided into 100 sec bins |
 |
 |
| Parameter | Plot |
|---|---|
| CZT HV Monitor |  |
| D_VDD | 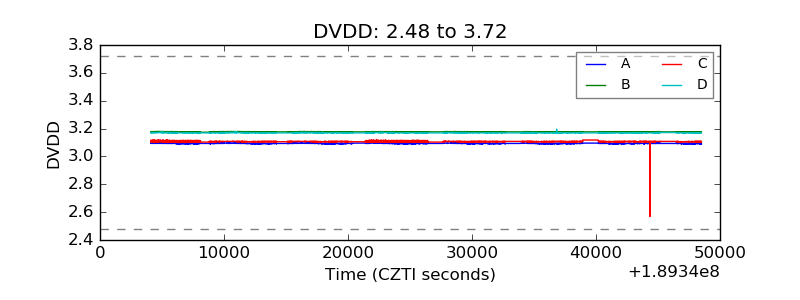 |
| Temperature 1 |  |
| Veto HV Monitor |  |
| Veto LLD |  |
| Alpha Counter |  |
| _CPM_Rate |  |
| CZT Counter |  |
| +2.5 Volts monitor |  |
| +5 Volts monitor |  |
| _ROLL_ROT |  |
| _Roll_DEC |  |
| _Roll_RA |  |
| Veto Counter |  |