| Param | Original file | Final file |
|---|---|---|
| Filename | modeM0/AS1P01_999T99_9000000238cztM0_level2.fits | modeM0/AS1P01_999T99_9000000238cztM0_level2_quad_clean.evt |
| Size (bytes) | 663,307,200 | 1,075,731,840 |
| Size | 632.6 MB | 1.0 GB |
| Events in quadrant A | 3,635,346 | 6,656,257 |
| Events in quadrant B | 3,790,132 | 7,170,243 |
| Events in quadrant C | 3,768,330 | 6,856,030 |
| Events in quadrant D | 3,232,998 | 6,244,098 |
| Mode SS | |||
|---|---|---|---|
| Quadrant | BADHDUFLAG | Total packets | Discarded packets |
| A | 0 | 1680 | 0 |
| B | 0 | 1680 | 0 |
| C | 0 | 1680 | 0 |
| D | 0 | 1680 | 0 |
| Mode M9 | |||
|---|---|---|---|
| Quadrant | BADHDUFLAG | Total packets | Discarded packets |
| A | 0 | 119 | 0 |
| B | 0 | 119 | 0 |
| C | 0 | 119 | 0 |
| D | 0 | 119 | 0 |
| Mode M0 | |||
|---|---|---|---|
| Quadrant | BADHDUFLAG | Total packets | Discarded packets |
| A | 0 | 445861 | 0 |
| B | 0 | 378228 | 0 |
| C | 0 | 345331 | 0 |
| D | 0 | 339901 | 0 |
| Quadrant | Total seconds | Saturated seconds | Saturation percentage |
|---|---|---|---|
| A | 82511 | 6654 | 8.064379% |
| B | 82511 | 1004 | 1.216807% |
| C | 82511 | 285 | 0.345408% |
| D | 82510 | 1721 | 2.085808% |
Noise dominated data is calculated using 1-second bins in cleaned event files. If a bin has >2000 counts, and if more than 50% of those come from <1% of pixels, then it is considered to be noise-dominated and hence unusable.
| Quadrant | # 1 sec bins | Bins with >0 counts | Bins with >2000 counts | High rate bins dominated by noise | Noise dominated (total time) | Noise dominated (detector-on time) | Marked lightcurve |
|---|---|---|---|---|---|---|---|
| A | 94426 | 82459 | 0 | 0 | 0.00% | 0.00% | 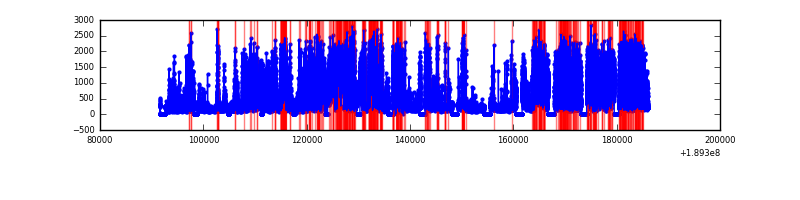 |
| B | 94426 | 82506 | 0 | 0 | 0.00% | 0.00% | 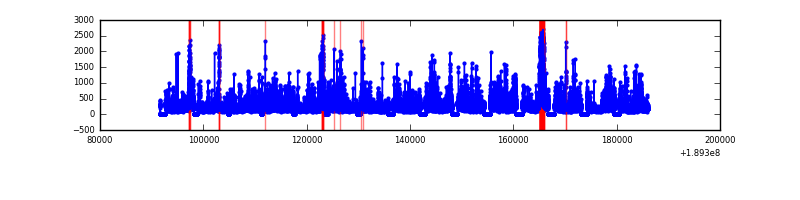 |
| C | 94426 | 82490 | 0 | 0 | 0.00% | 0.00% |  |
| D | 94426 | 82356 | 0 | 0 | 0.00% | 0.00% | 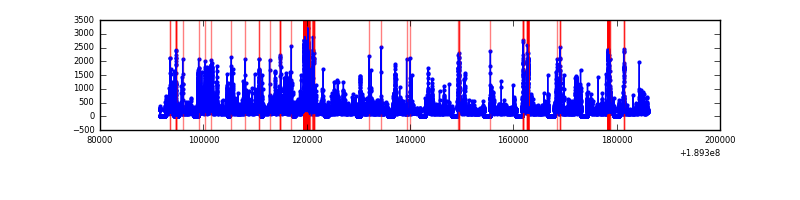 |
Top three noisy pixels from each quadrant. If the there are fewer than three noisy pixels in the level2.evt file, extra rows are filled as -1
| Pixel properties | Quadrant properties | ||||||
|---|---|---|---|---|---|---|---|
| Quadrant | DetID | PixID | Counts | Sigma | Mean | Median | Sigma |
| A | 0 | 29 | 3377 | 11.43 | 941 | 879 | 218.6 |
| A | 7 | 110 | 3241 | 10.81 | 941 | 879 | 218.6 |
| A | 14 | 188 | 2711 | 8.38 | 941 | 879 | 218.6 |
| B | 2 | 9 | 3103 | 11.88 | 1000 | 951 | 181.2 |
| B | 5 | 128 | 2516 | 8.64 | 1000 | 951 | 181.2 |
| B | 14 | 254 | 2479 | 8.43 | 1000 | 951 | 181.2 |
| C | 12 | 241 | 2721 | 7.45 | 996 | 924 | 241.2 |
| C | 2 | 191 | 2582 | 6.87 | 996 | 924 | 241.2 |
| C | 9 | 242 | 2433 | 6.26 | 996 | 924 | 241.2 |
| D | 6 | 44 | 2395 | 7.13 | 922 | 847 | 217.1 |
| D | 11 | 82 | 2355 | 6.95 | 922 | 847 | 217.1 |
| D | 6 | 231 | 2305 | 6.71 | 922 | 847 | 217.1 |
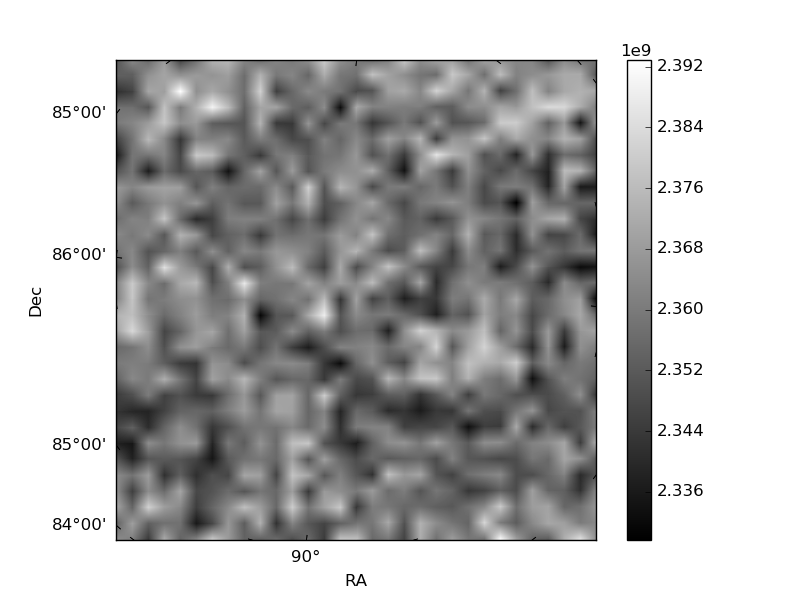
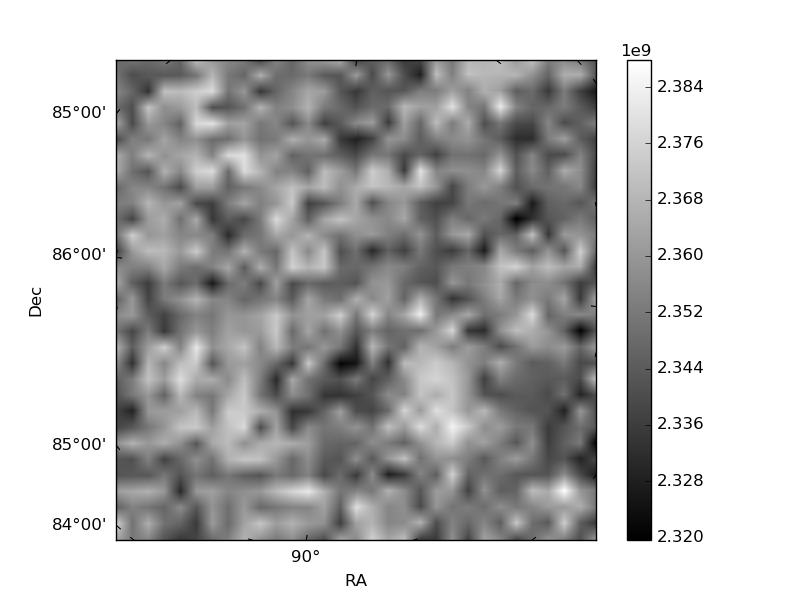
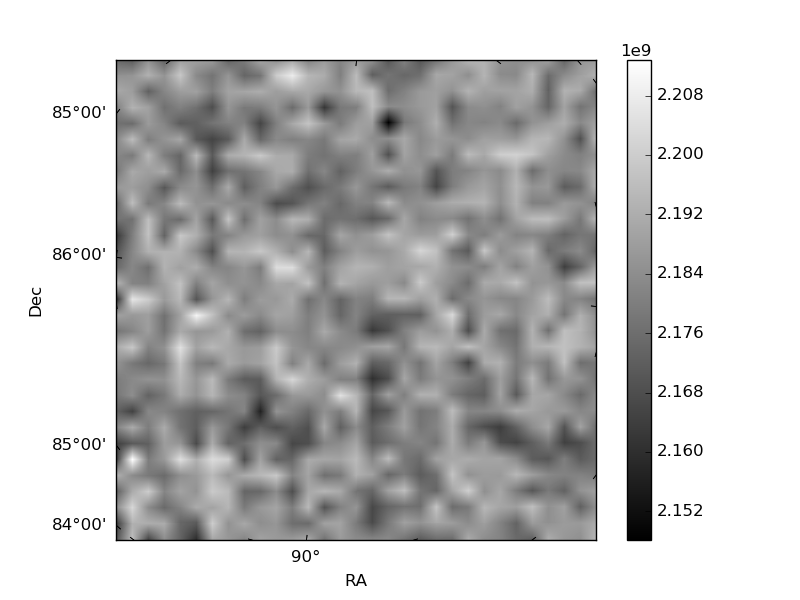
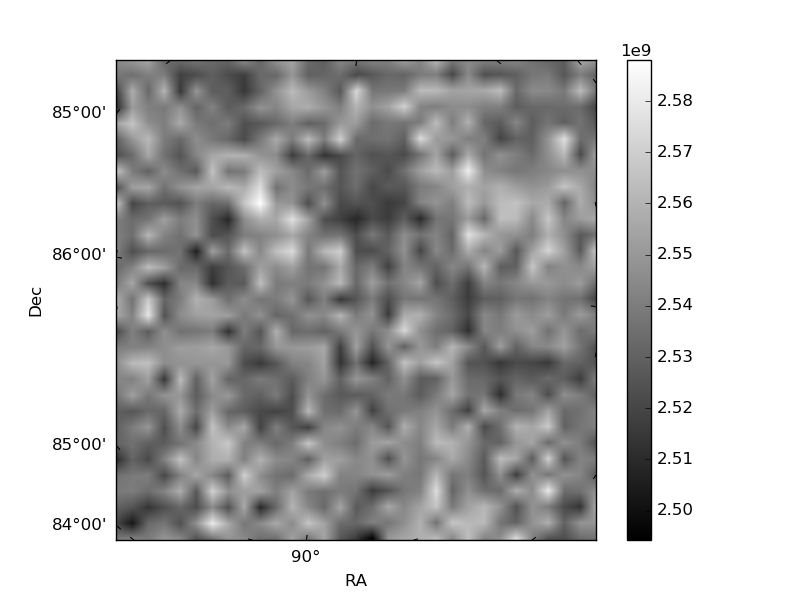
Histogram calculated using DETX and DETY for each event in the final _common_clean file
| Quadrant A | 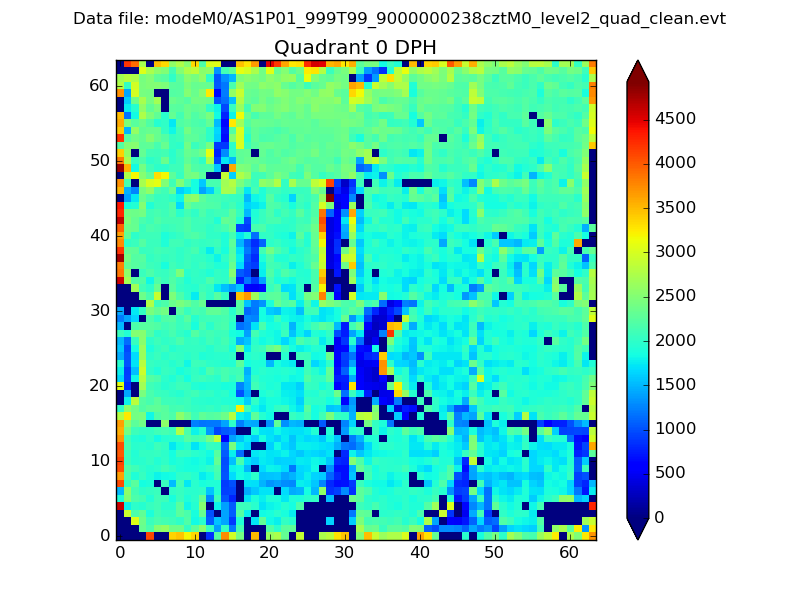 |
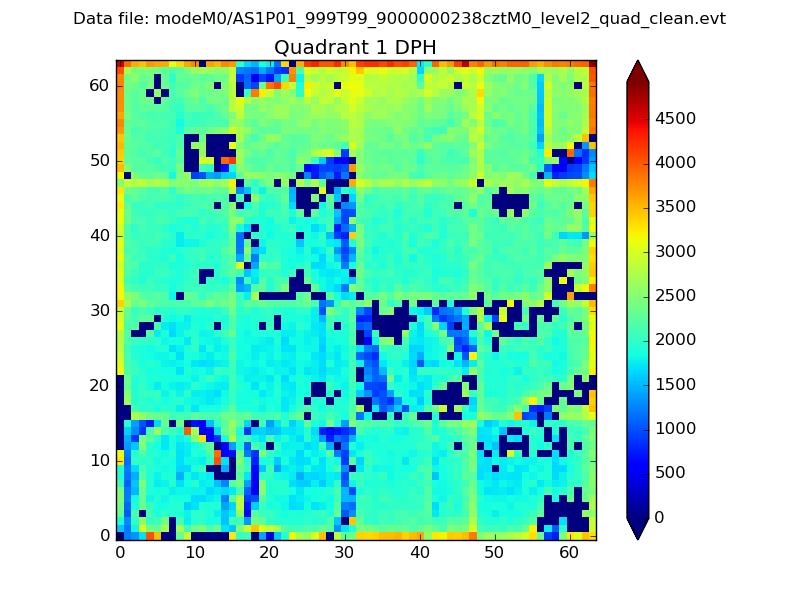 |
Quadrant B |
|---|---|---|---|
| Quadrant D | 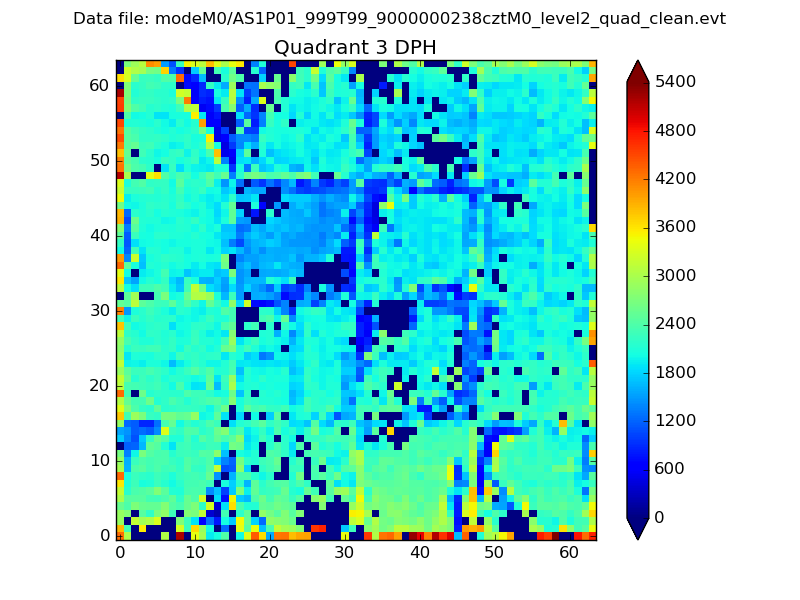 |
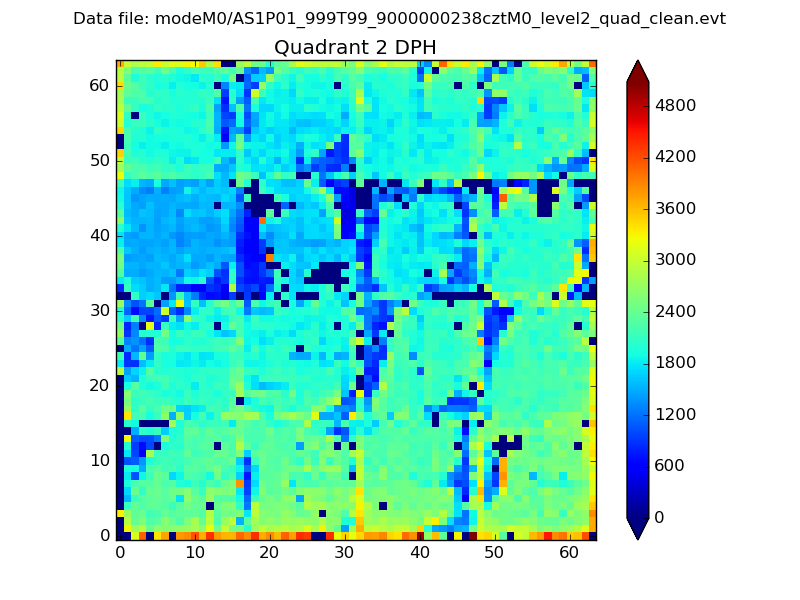 |
Quadrant C |
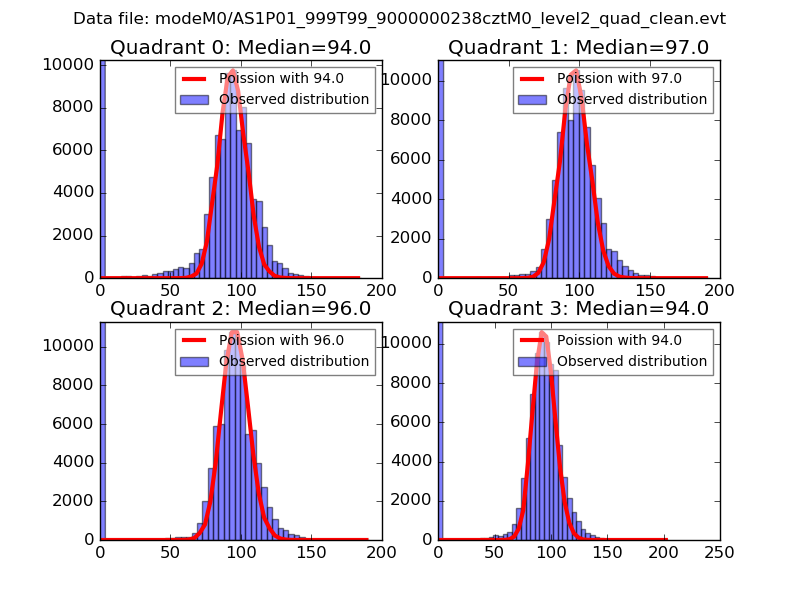
| Plot type | Count rate plots | Images |
|---|---|---|
| Comparison with Poisson distribution Blue bars denote a histogram of data divided into 1 sec bins. Red curve is a Poisson curve with rate = median count rate of data. |
 |
 |
| Quadrant-wise count rates Data is divided into 100 sec bins |
 |
|
| Module-wise count rates for Quadrant A Data is divided into 100 sec bins |
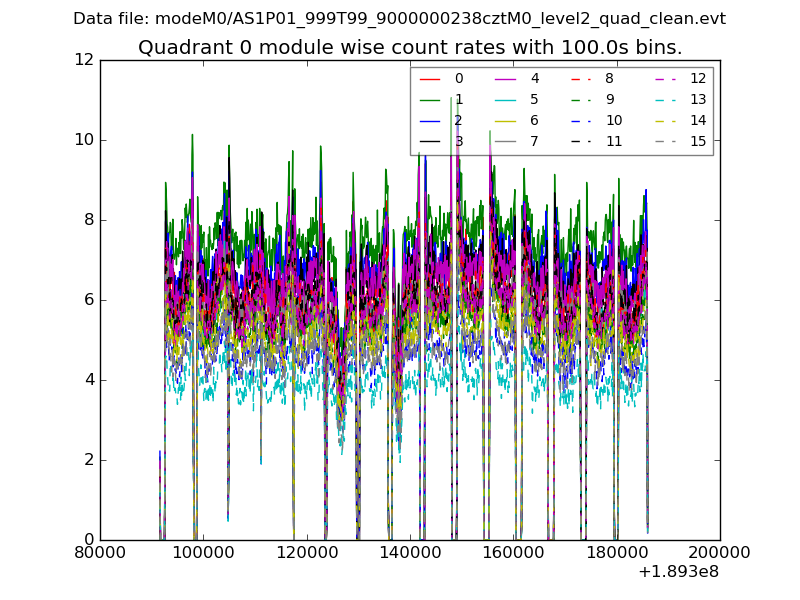 |
 |
| Module-wise count rates for Quadrant B Data is divided into 100 sec bins |
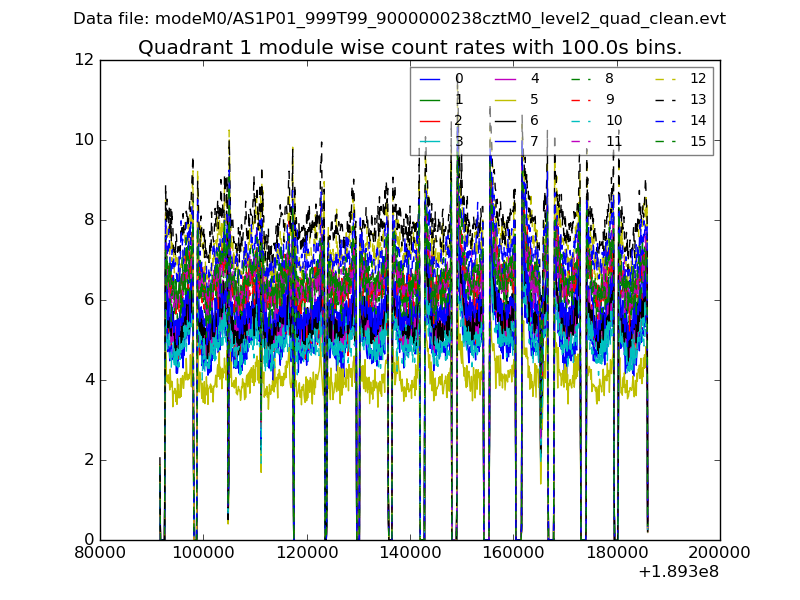 |
 |
| Module-wise count rates for Quadrant C Data is divided into 100 sec bins |
 |
 |
| Module-wise count rates for Quadrant D Data is divided into 100 sec bins |
 |
 |
| Parameter | Plot |
|---|---|
| CZT HV Monitor |  |
| D_VDD | 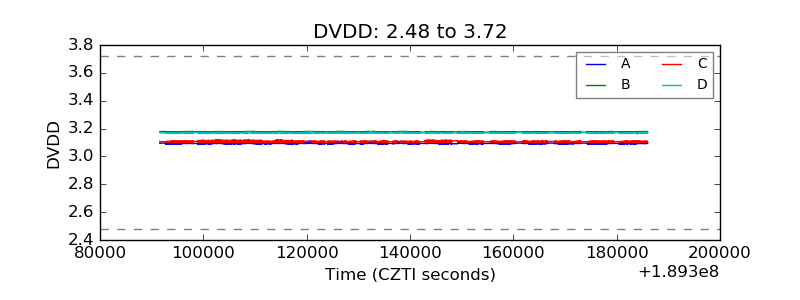 |
| Temperature 1 | 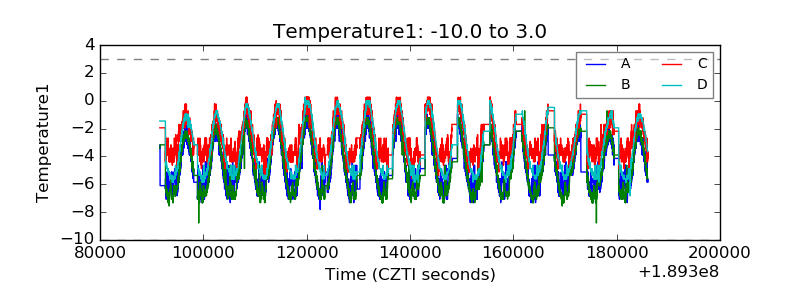 |
| Veto HV Monitor |  |
| Veto LLD | 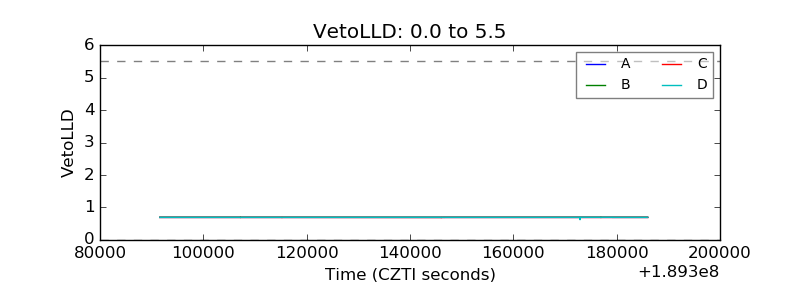 |
| Alpha Counter |  |
| _CPM_Rate | 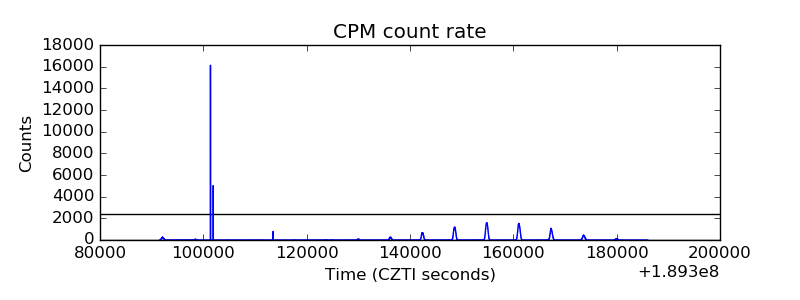 |
| CZT Counter | 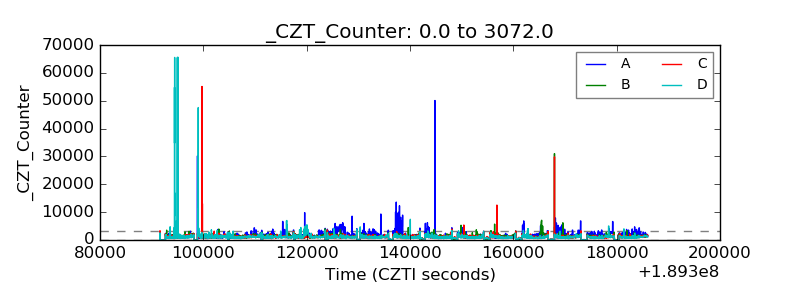 |
| +2.5 Volts monitor | 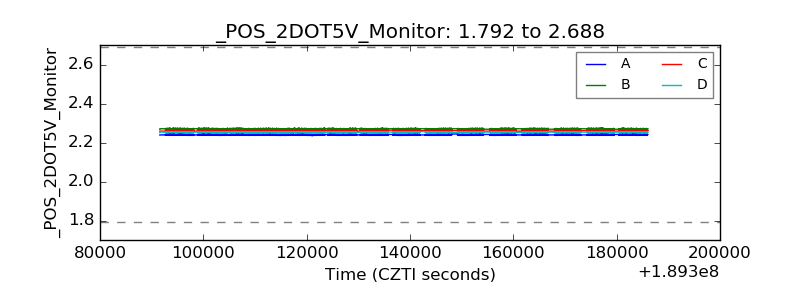 |
| +5 Volts monitor | 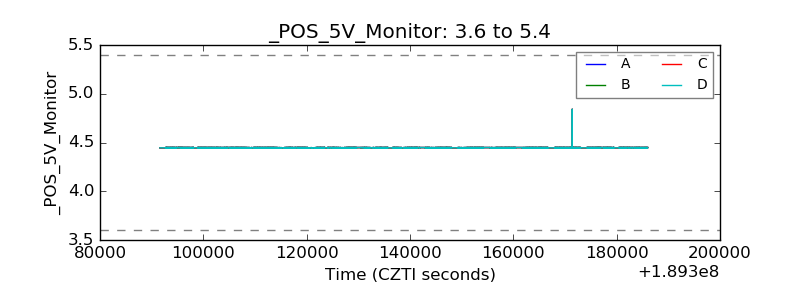 |
| _ROLL_ROT | 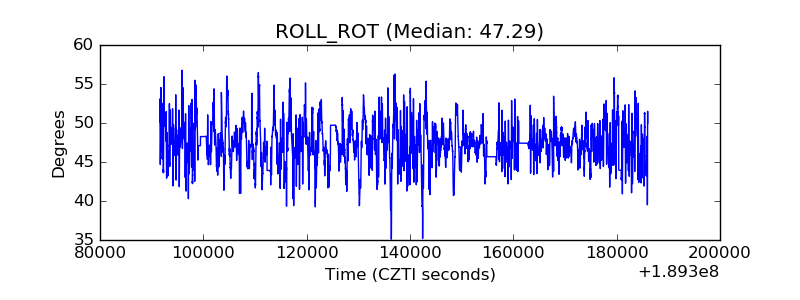 |
| _Roll_DEC |  |
| _Roll_RA | 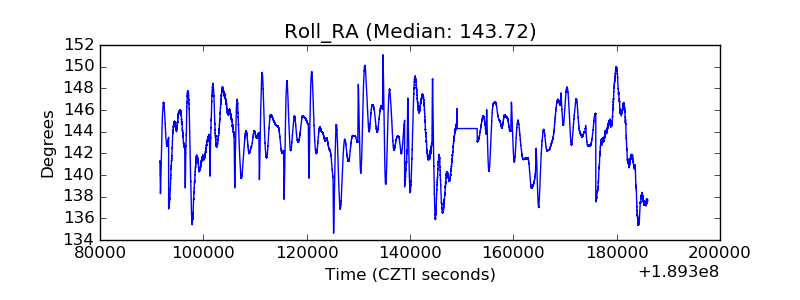 |
| Veto Counter | 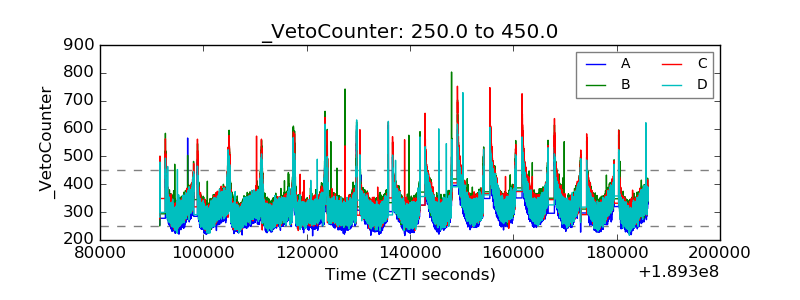 |