| Param | Original file | Final file |
|---|---|---|
| Filename | modeM0/AS1P01_999T99_9000000238_01436cztM0_level2.fits | modeM0/AS1P01_999T99_9000000238_01436cztM0_level2_quad_clean.evt |
| Size (bytes) | 2,284,672,320 | 245,010,240 |
| Size | 2.1 GB | 233.7 MB |
| Events in quadrant A | 28,405,595 | 1,547,626 |
| Events in quadrant B | 20,058,854 | 1,688,244 |
| Events in quadrant C | 17,949,289 | 1,610,582 |
| Events in quadrant D | 16,951,859 | 1,475,635 |
| Mode SS | |||
|---|---|---|---|
| Quadrant | BADHDUFLAG | Total packets | Discarded packets |
| A | 0 | 322 | 0 |
| B | 0 | 322 | 0 |
| C | 0 | 322 | 0 |
| D | 0 | 322 | 0 |
| Mode M9 | |||
|---|---|---|---|
| Quadrant | BADHDUFLAG | Total packets | Discarded packets |
| A | 0 | 20 | 0 |
| B | 0 | 20 | 0 |
| C | 0 | 20 | 0 |
| D | 0 | 20 | 0 |
| Mode M0 | |||
|---|---|---|---|
| Quadrant | BADHDUFLAG | Total packets | Discarded packets |
| A | 0 | 95731 | 3 |
| B | 0 | 70845 | 3 |
| C | 0 | 64692 | 3 |
| D | 0 | 61778 | 3 |
| Quadrant | Total seconds | Saturated seconds | Saturation percentage |
|---|---|---|---|
| A | 15898 | 1426 | 8.969682% |
| B | 15898 | 70 | 0.440307% |
| C | 15898 | 16 | 0.100642% |
| D | 15898 | 73 | 0.459177% |
Noise dominated data is calculated using 1-second bins in cleaned event files. If a bin has >2000 counts, and if more than 50% of those come from <1% of pixels, then it is considered to be noise-dominated and hence unusable.
| Quadrant | # 1 sec bins | Bins with >0 counts | Bins with >2000 counts | High rate bins dominated by noise | Noise dominated (total time) | Noise dominated (detector-on time) | Marked lightcurve |
|---|---|---|---|---|---|---|---|
| A | 17918 | 15899 | 5154 | 5154 | 28.76% | 32.42% | 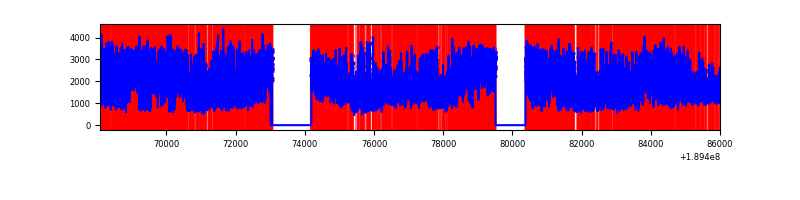 |
| B | 17918 | 15901 | 760 | 760 | 4.24% | 4.78% | 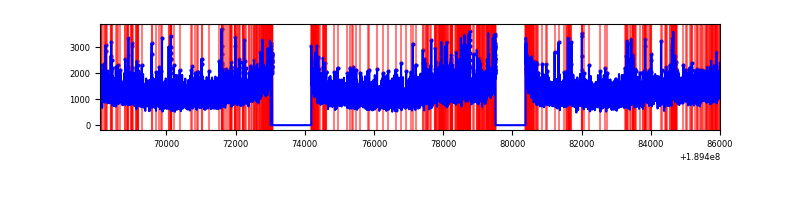 |
| C | 17918 | 15901 | 308 | 308 | 1.72% | 1.94% | 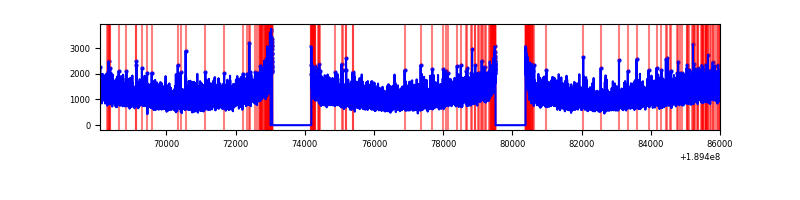 |
| D | 17918 | 15901 | 491 | 491 | 2.74% | 3.09% | 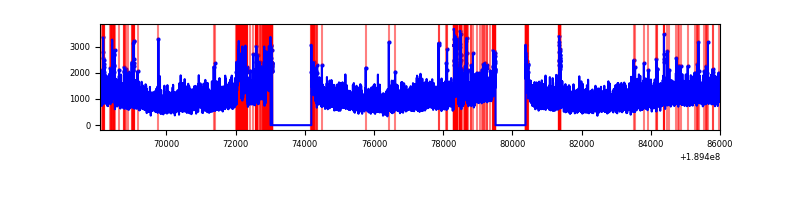 |
Top three noisy pixels from each quadrant. If the there are fewer than three noisy pixels in the level2.evt file, extra rows are filled as -1
| Pixel properties | Quadrant properties | ||||||
|---|---|---|---|---|---|---|---|
| Quadrant | DetID | PixID | Counts | Sigma | Mean | Median | Sigma |
| A | 15 | 127 | 10671332 | 9804.33 | 4565 | 4598 | 1088.0 |
| A | 13 | 17 | 163338 | 145.91 | 4565 | 4598 | 1088.0 |
| A | 13 | 9 | 20241 | 14.38 | 4565 | 4598 | 1088.0 |
| B | 8 | 4 | 653085 | 568.13 | 4891 | 4907 | 1140.9 |
| B | 12 | 52 | 418845 | 362.82 | 4891 | 4907 | 1140.9 |
| B | 15 | 22 | 133494 | 112.71 | 4891 | 4907 | 1140.9 |
| C | 15 | 241 | 618477 | 500.88 | 4412 | 4559 | 1225.7 |
| C | 3 | 111 | 51640 | 38.41 | 4412 | 4559 | 1225.7 |
| C | 3 | 79 | 47757 | 35.24 | 4412 | 4559 | 1225.7 |
| D | 7 | 34 | 353583 | 267.69 | 4233 | 4384 | 1304.5 |
| D | 9 | 53 | 301931 | 228.09 | 4233 | 4384 | 1304.5 |
| D | 13 | 252 | 121443 | 89.73 | 4233 | 4384 | 1304.5 |
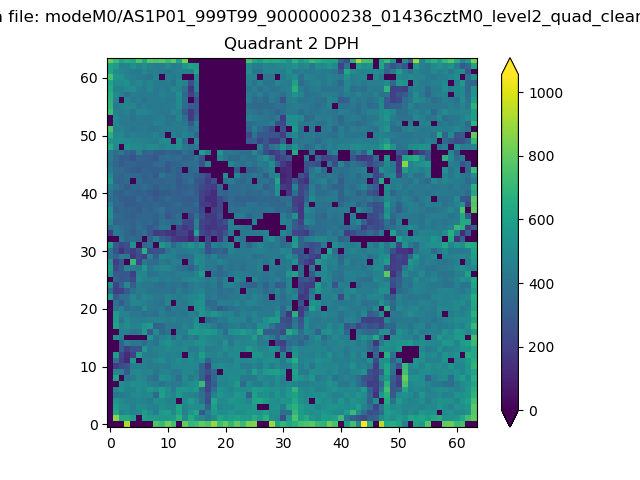
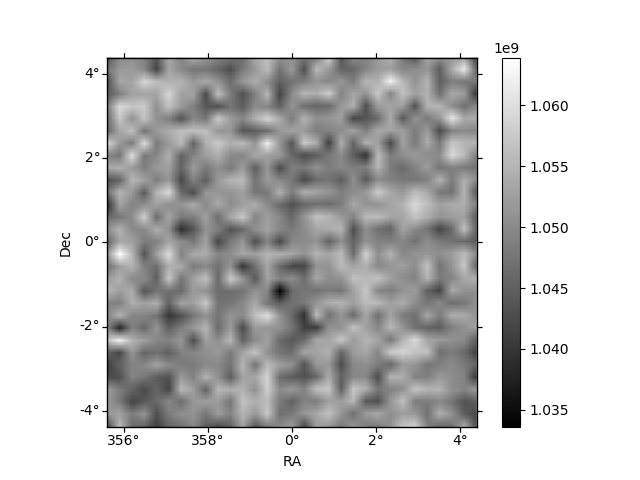
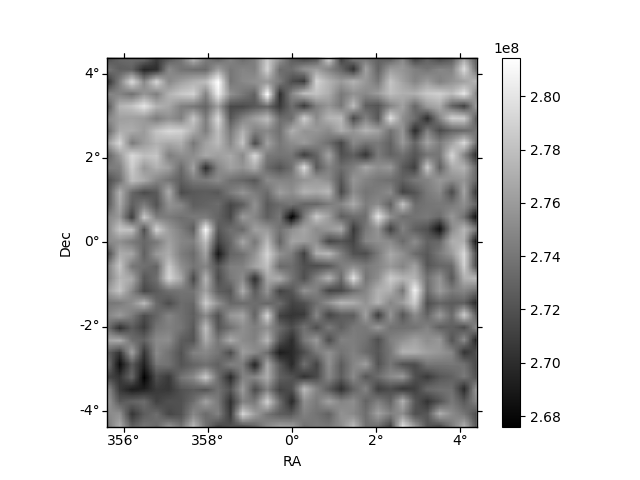
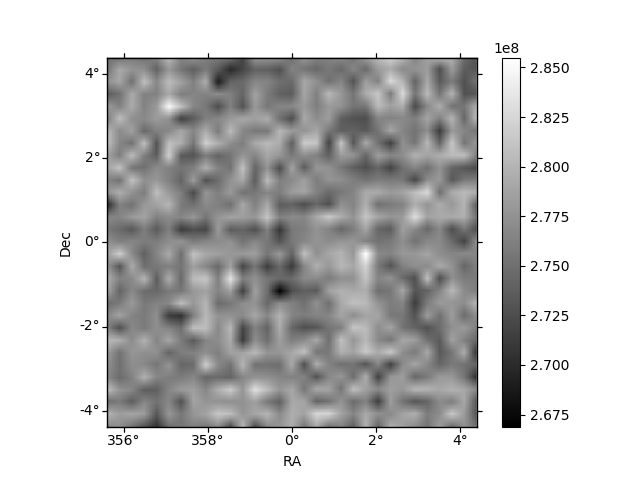
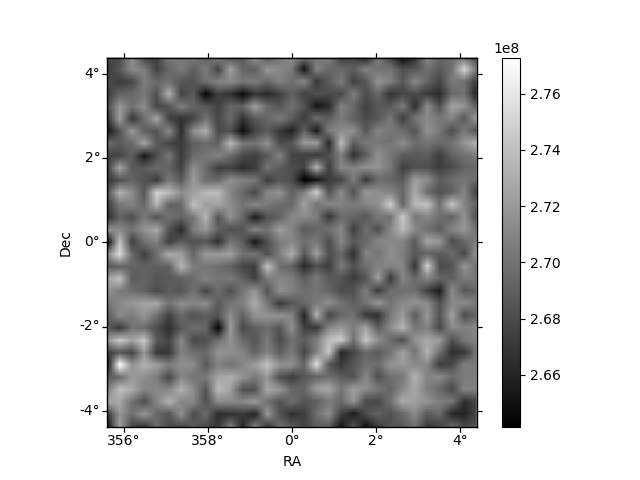
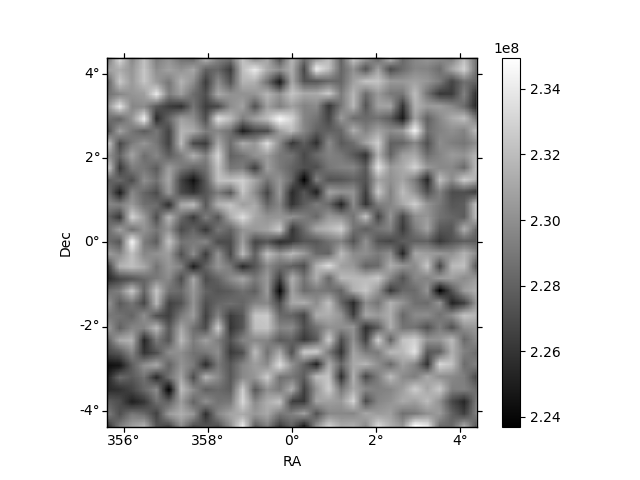
Histogram calculated using DETX and DETY for each event in the final _common_clean file
| Quadrant A | 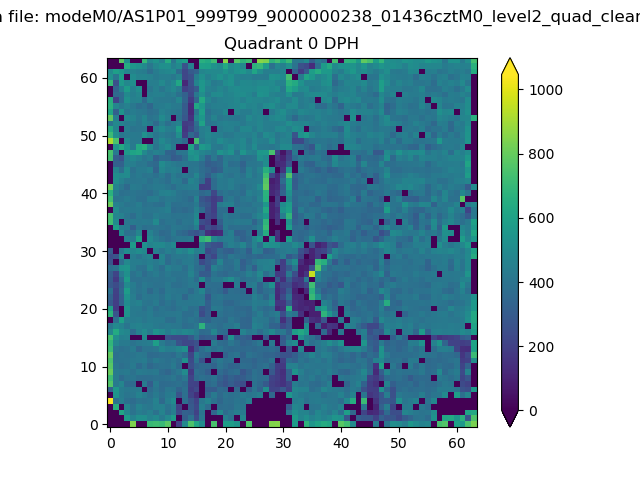 |
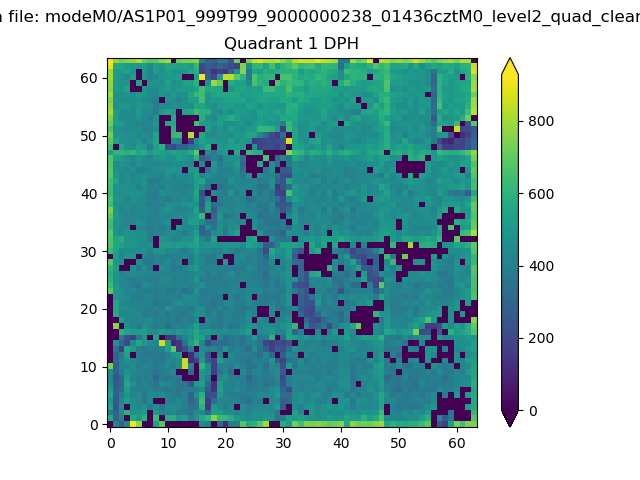 |
Quadrant B |
|---|---|---|---|
| Quadrant D | 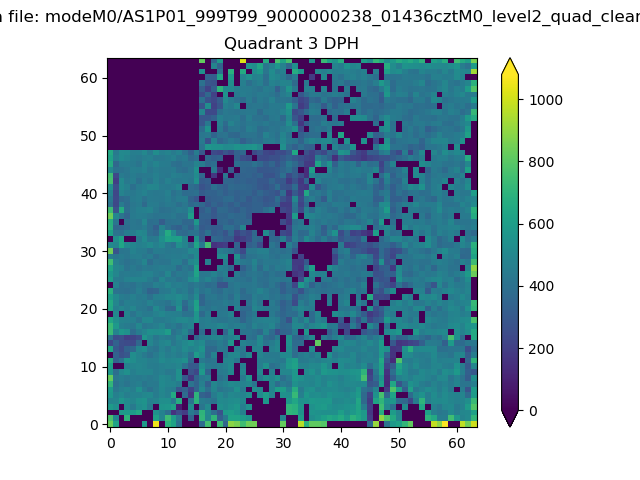 |
 |
Quadrant C |
| Plot type | Count rate plots | Images |
|---|---|---|
| Comparison with Poisson distribution Blue bars denote a histogram of data divided into 1 sec bins. Red curve is a Poisson curve with rate = median count rate of data. |
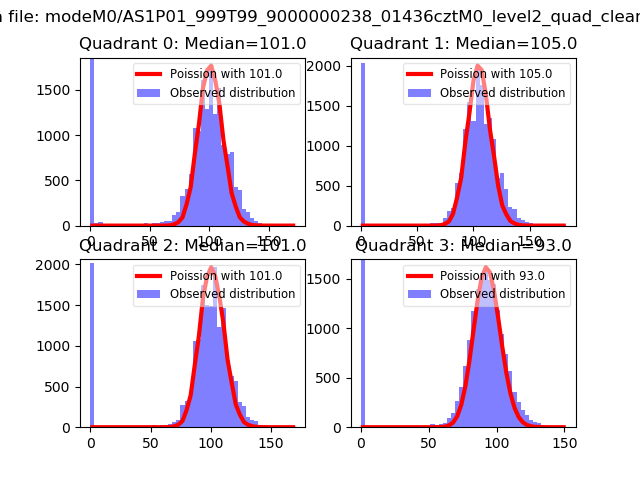 |
 |
| Quadrant-wise count rates Data is divided into 100 sec bins |
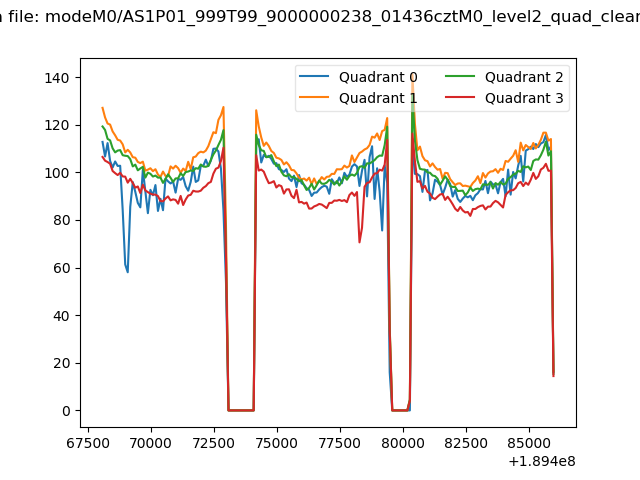 |
|
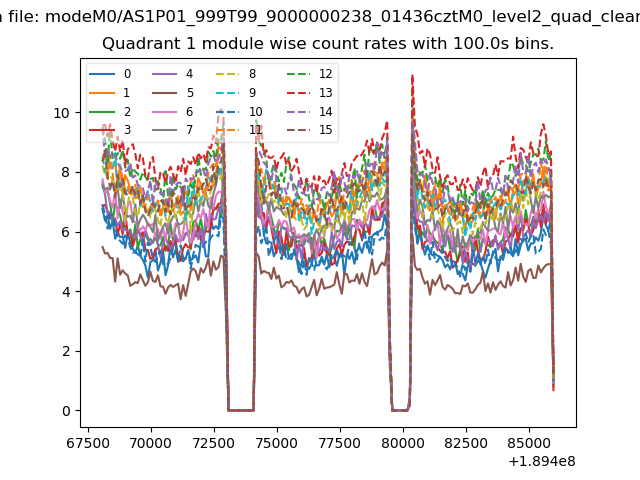
| Module-wise count rates for Quadrant A Data is divided into 100 sec bins |
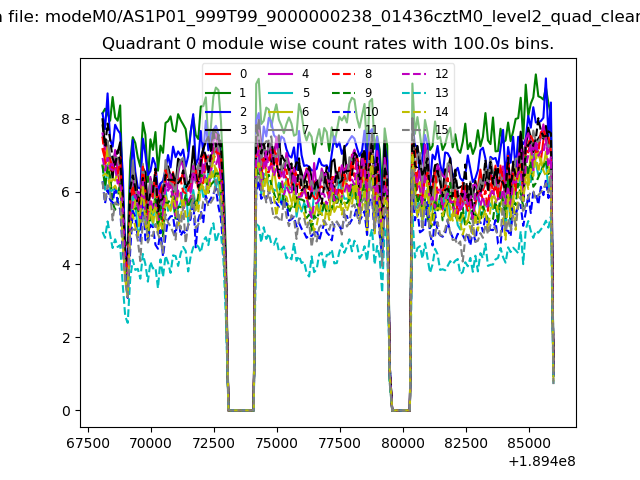 |
 |
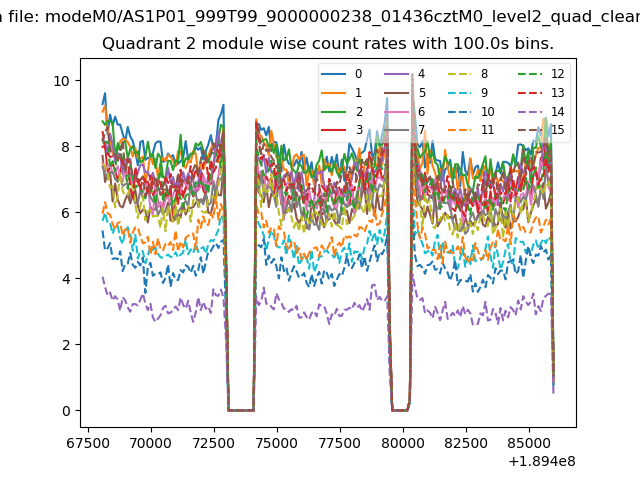
| Module-wise count rates for Quadrant B Data is divided into 100 sec bins |
 |
 |
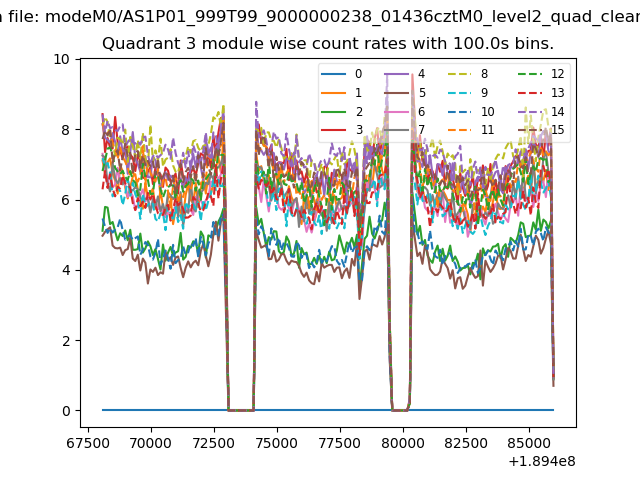
| Module-wise count rates for Quadrant C Data is divided into 100 sec bins |
 |
 |
| Module-wise count rates for Quadrant D Data is divided into 100 sec bins |
 |
 |
| Parameter | Plot |
|---|---|
| CZT HV Monitor | 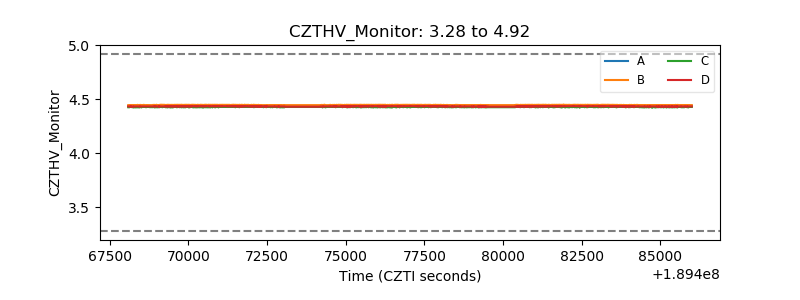 |
| D_VDD | 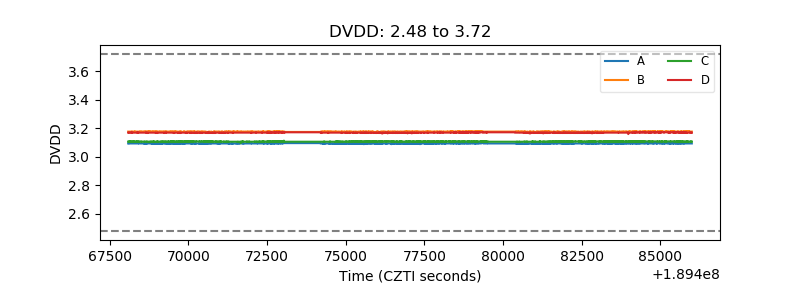 |
| Temperature 1 | 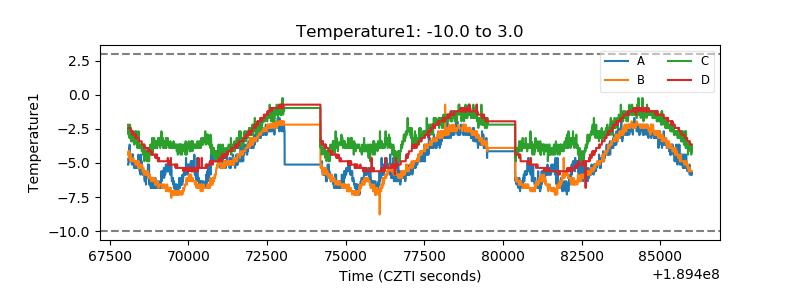 |
| Veto HV Monitor | 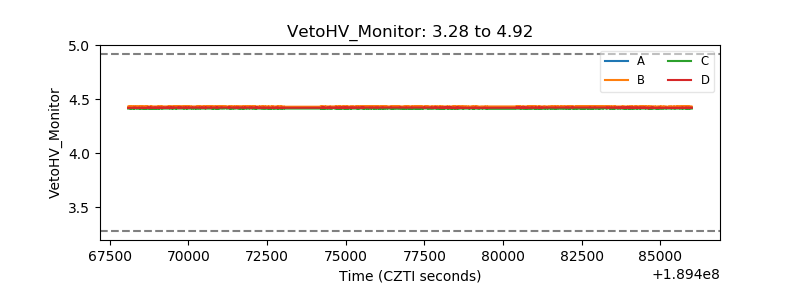 |
| Veto LLD | 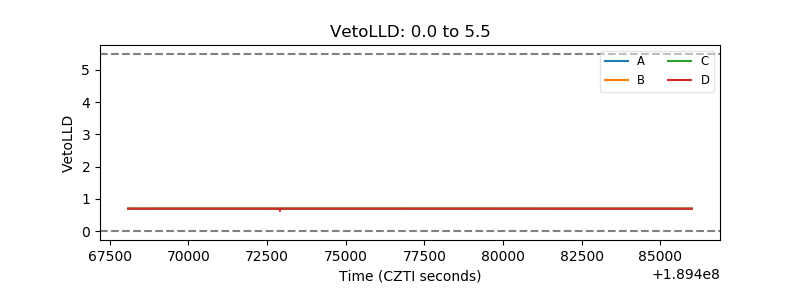 |
| Alpha Counter | 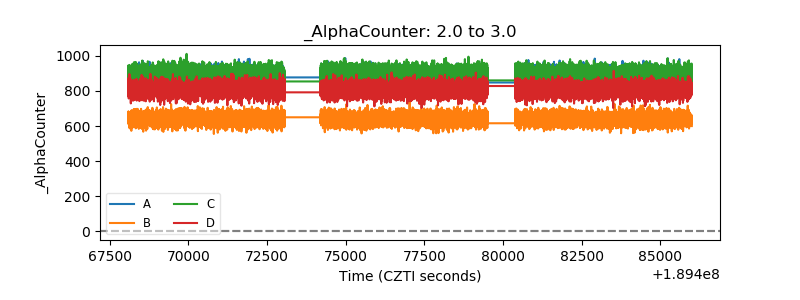 |
| _CPM_Rate | 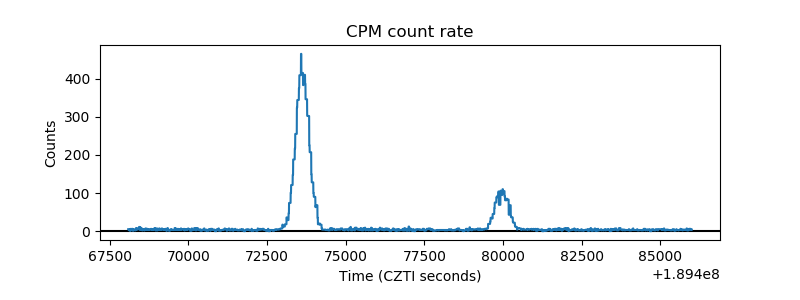 |
| CZT Counter | 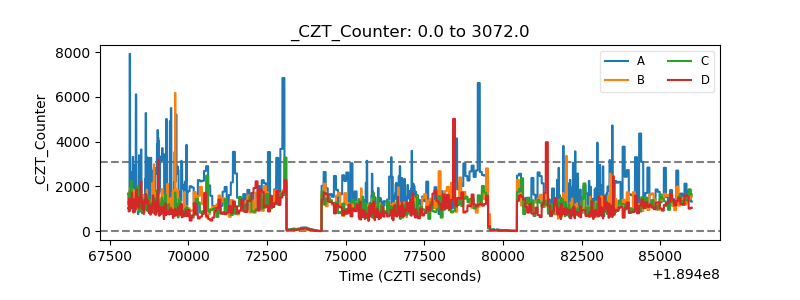 |
| +2.5 Volts monitor |  |
| +5 Volts monitor |  |
| _ROLL_ROT | 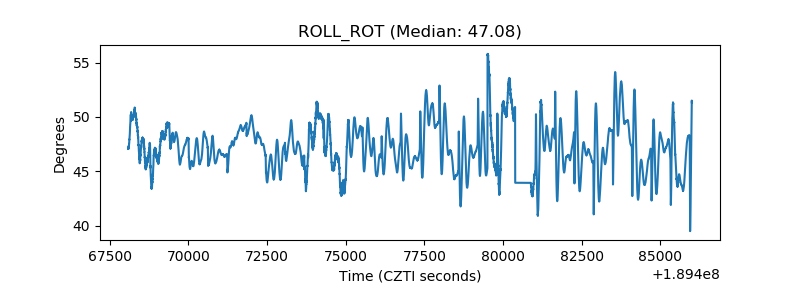 |
| _Roll_DEC | 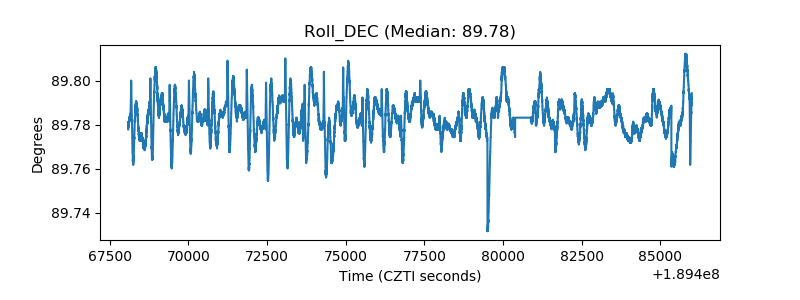 |
| _Roll_RA | 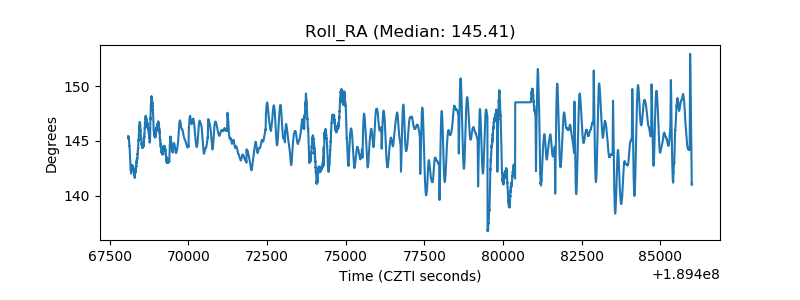 |
| Veto Counter | 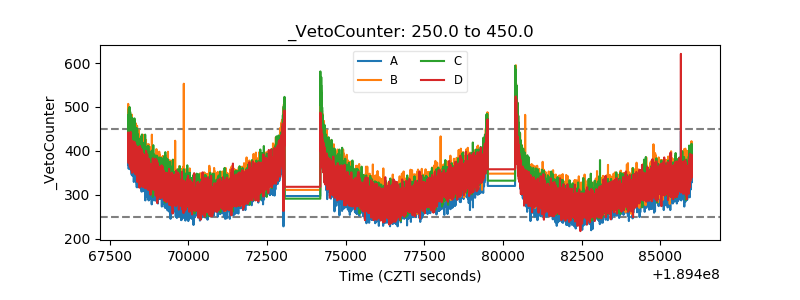 |