| Param | Original file | Final file |
|---|---|---|
| Filename | modeM0/AS1G02_034T01_9000000240cztM0_level2.fits | modeM0/AS1G02_034T01_9000000240cztM0_level2_quad_clean.evt |
| Size (bytes) | 848,756,160 | 991,319,040 |
| Size | 809.4 MB | 945.4 MB |
| Events in quadrant A | 4,866,028 | 5,994,407 |
| Events in quadrant B | 4,837,322 | 6,026,218 |
| Events in quadrant C | 4,806,646 | 5,745,033 |
| Events in quadrant D | 4,155,786 | 5,220,815 |
| Mode M9 | |||
|---|---|---|---|
| Quadrant | BADHDUFLAG | Total packets | Discarded packets |
| A | 0 | 126 | 0 |
| B | 0 | 126 | 0 |
| C | 0 | 126 | 0 |
| D | 0 | 126 | 0 |
| Mode M0 | |||
|---|---|---|---|
| Quadrant | BADHDUFLAG | Total packets | Discarded packets |
| A | 0 | 442456 | 0 |
| B | 0 | 477091 | 0 |
| C | 0 | 439036 | 0 |
| D | 0 | 419654 | 0 |
| Mode SS | |||
|---|---|---|---|
| Quadrant | BADHDUFLAG | Total packets | Discarded packets |
| A | 0 | 2088 | 0 |
| B | 0 | 2088 | 0 |
| C | 0 | 2088 | 0 |
| D | 0 | 2088 | 0 |
| Quadrant | Total seconds | Saturated seconds | Saturation percentage |
|---|---|---|---|
| A | 102677 | 561 | 0.546374% |
| B | 102674 | 765 | 0.745077% |
| C | 102679 | 559 | 0.544415% |
| D | 102674 | 1205 | 1.173617% |
Noise dominated data is calculated using 1-second bins in cleaned event files. If a bin has >2000 counts, and if more than 50% of those come from <1% of pixels, then it is considered to be noise-dominated and hence unusable.
| Quadrant | # 1 sec bins | Bins with >0 counts | Bins with >2000 counts | High rate bins dominated by noise | Noise dominated (total time) | Noise dominated (detector-on time) | Marked lightcurve |
|---|---|---|---|---|---|---|---|
| A | 120731 | 102668 | 0 | 0 | 0.00% | 0.00% |  |
| B | 120731 | 102668 | 0 | 0 | 0.00% | 0.00% |  |
| C | 120731 | 102655 | 0 | 0 | 0.00% | 0.00% |  |
| D | 120730 | 102648 | 0 | 0 | 0.00% | 0.00% | 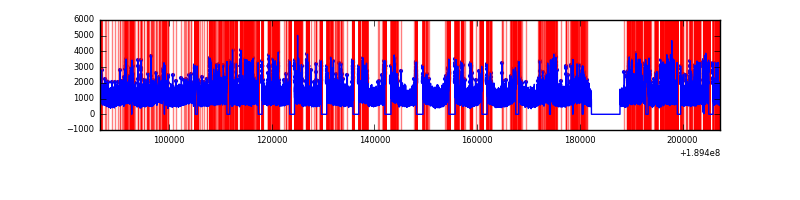 |
Top three noisy pixels from each quadrant. If the there are fewer than three noisy pixels in the level2.evt file, extra rows are filled as -1
| Pixel properties | Quadrant properties | ||||||
|---|---|---|---|---|---|---|---|
| Quadrant | DetID | PixID | Counts | Sigma | Mean | Median | Sigma |
| A | 0 | 29 | 4560 | 11.52 | 1258 | 1171 | 294.2 |
| A | 7 | 110 | 4275 | 10.55 | 1258 | 1171 | 294.2 |
| A | 14 | 188 | 3696 | 8.58 | 1258 | 1171 | 294.2 |
| B | 2 | 9 | 3888 | 11.51 | 1273 | 1204 | 233.2 |
| B | 5 | 128 | 3167 | 8.42 | 1273 | 1204 | 233.2 |
| B | 14 | 254 | 3143 | 8.31 | 1273 | 1204 | 233.2 |
| C | 12 | 241 | 3306 | 6.94 | 1270 | 1174 | 307.2 |
| C | 2 | 191 | 3147 | 6.42 | 1270 | 1174 | 307.2 |
| C | 9 | 242 | 3049 | 6.1 | 1270 | 1174 | 307.2 |
| D | 11 | 82 | 2984 | 6.73 | 1186 | 1084 | 282.3 |
| D | 10 | 189 | 2962 | 6.65 | 1186 | 1084 | 282.3 |
| D | 6 | 44 | 2936 | 6.56 | 1186 | 1084 | 282.3 |
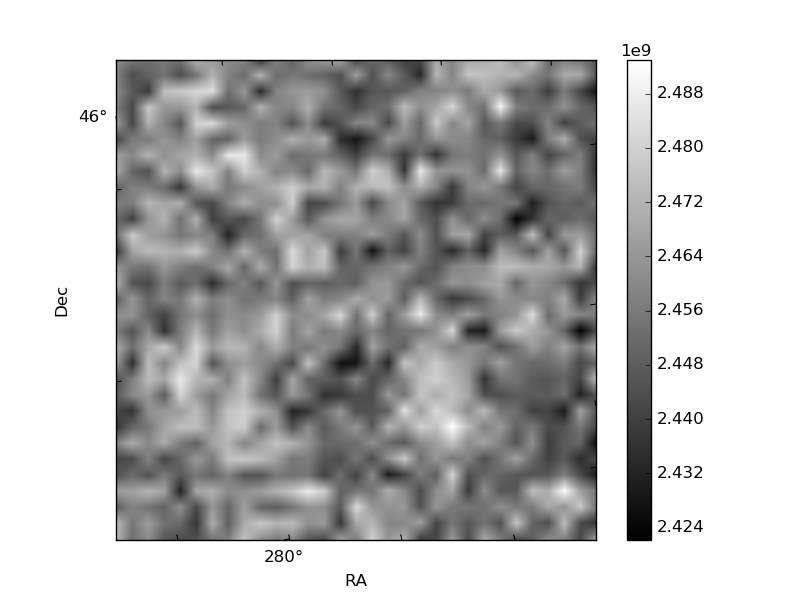
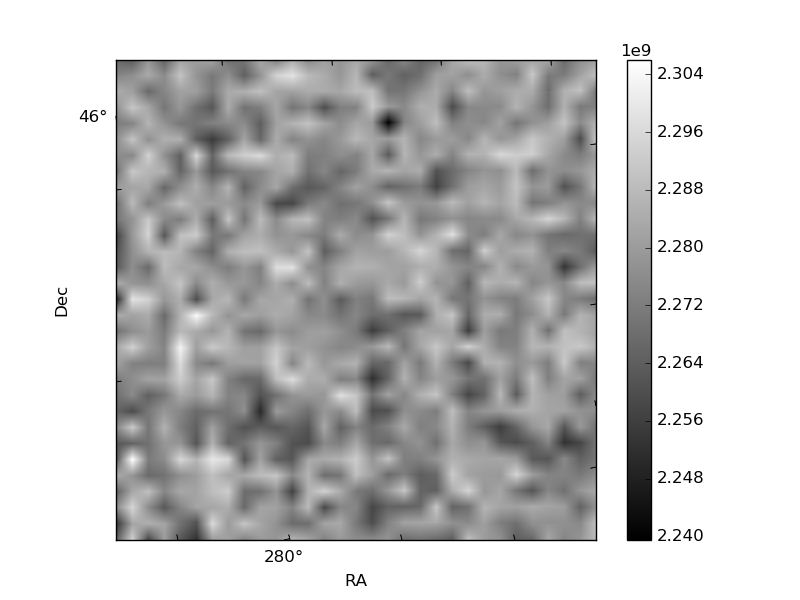
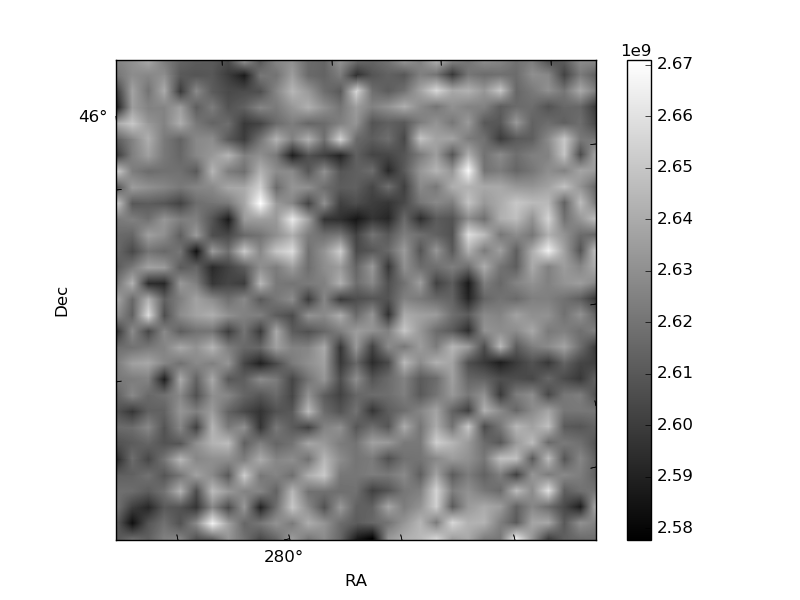
Histogram calculated using DETX and DETY for each event in the final _common_clean file
| Quadrant A | 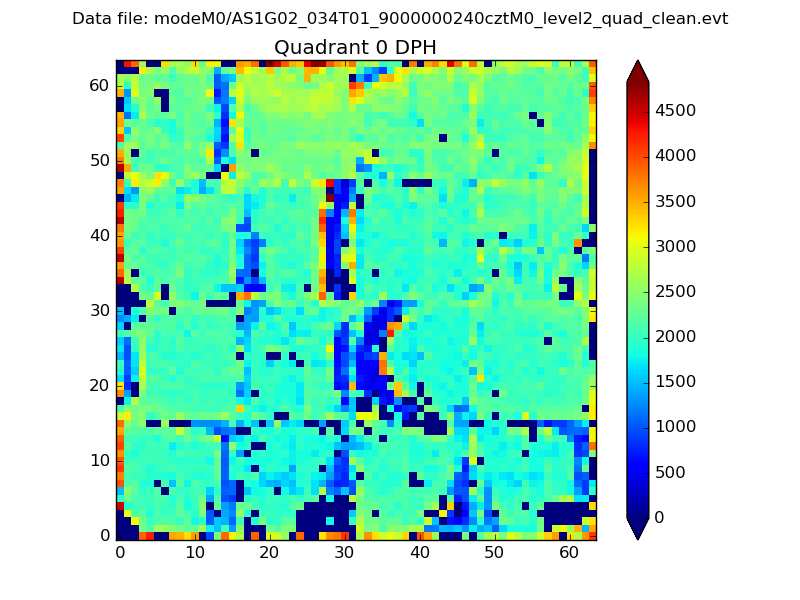 |
 |
Quadrant B |
|---|---|---|---|
| Quadrant D | 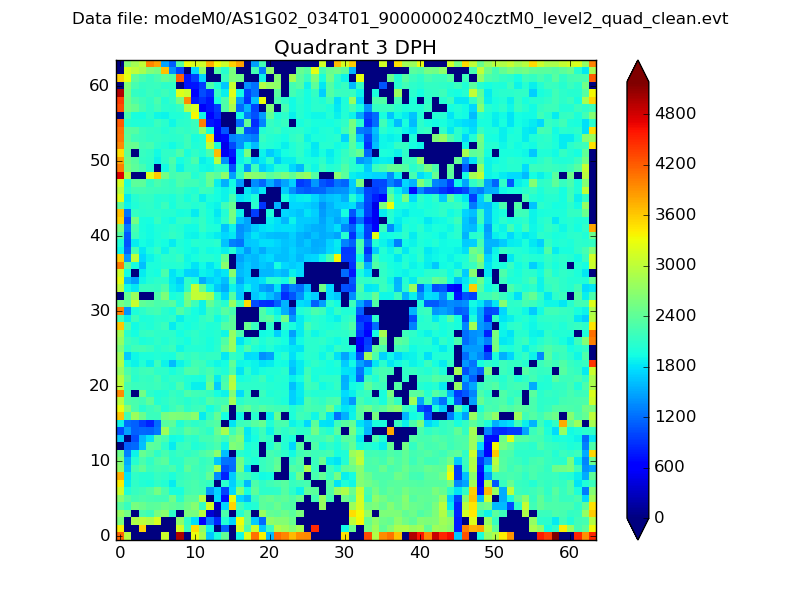 |
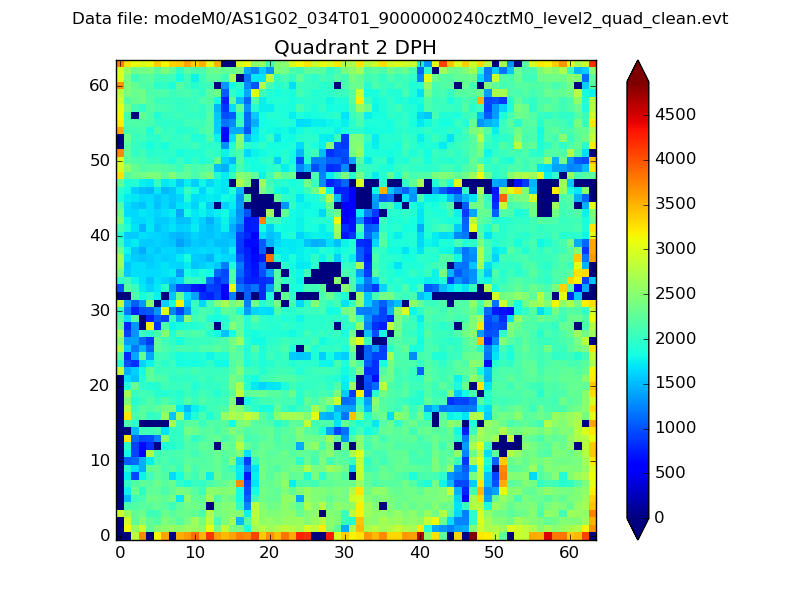 |
Quadrant C |
| Plot type | Count rate plots | Images |
|---|---|---|
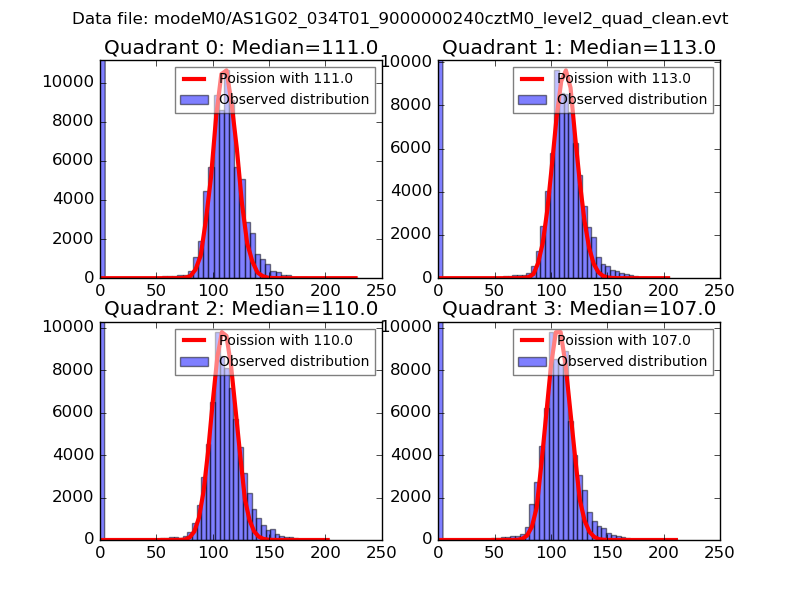
| Comparison with Poisson distribution Blue bars denote a histogram of data divided into 1 sec bins. Red curve is a Poisson curve with rate = median count rate of data. |
 |
 |
| Quadrant-wise count rates Data is divided into 100 sec bins |
 |
|
| Module-wise count rates for Quadrant A Data is divided into 100 sec bins |
 |
 |
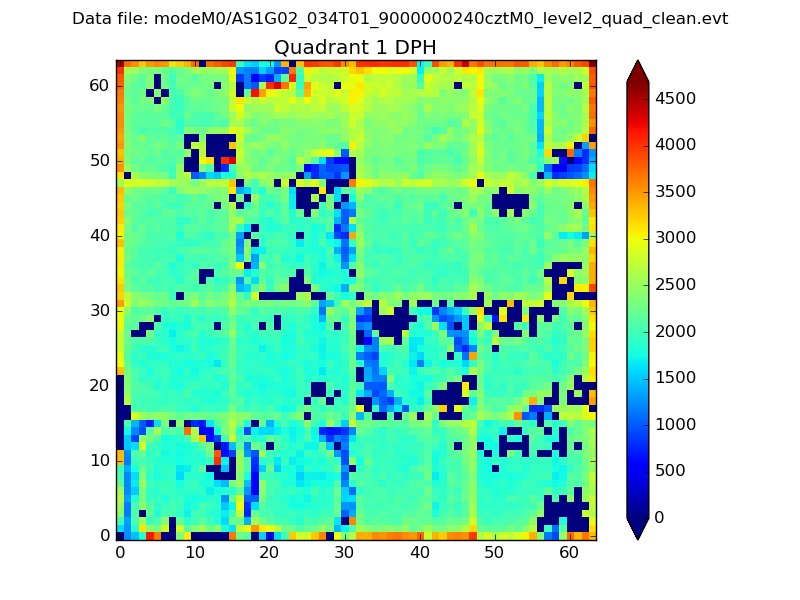
| Module-wise count rates for Quadrant B Data is divided into 100 sec bins |
 |
 |
| Module-wise count rates for Quadrant C Data is divided into 100 sec bins |
 |
 |
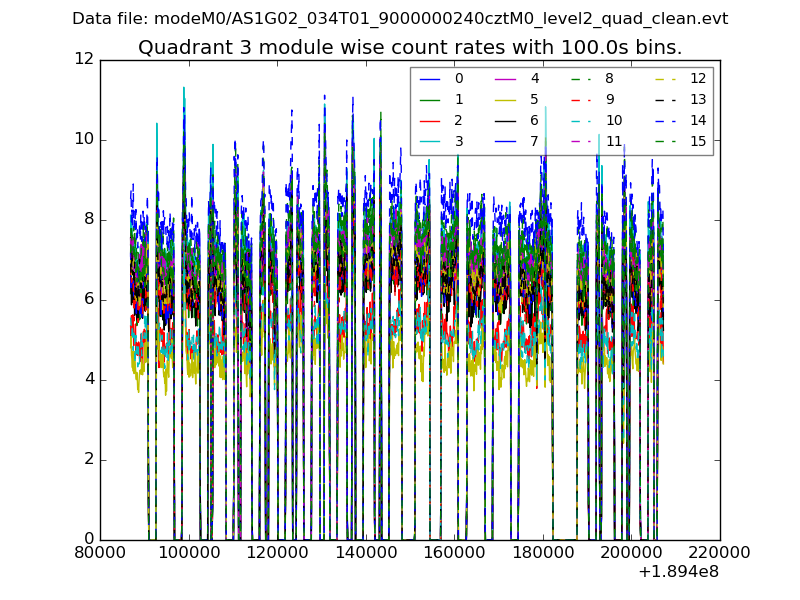
| Module-wise count rates for Quadrant D Data is divided into 100 sec bins |
 |
 |
| Parameter | Plot |
|---|---|
| CZT HV Monitor |  |
| D_VDD | 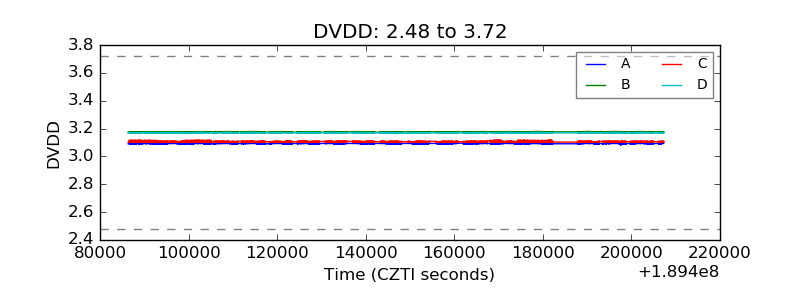 |
| Temperature 1 | 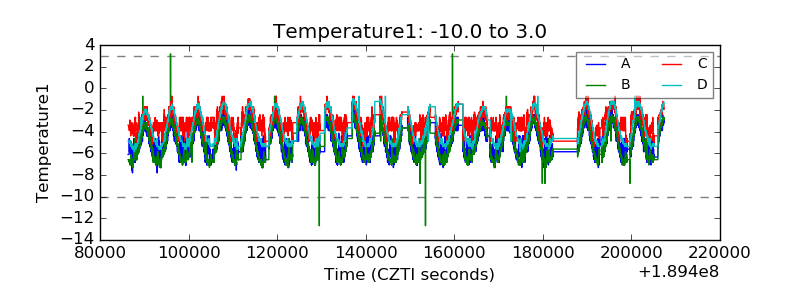 |
| Veto HV Monitor |  |
| Veto LLD | 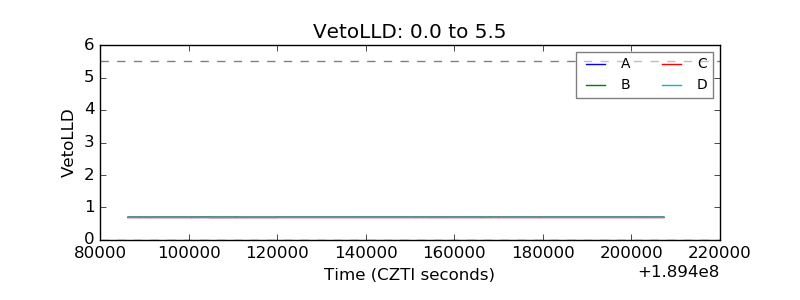 |
| Alpha Counter |  |
| _CPM_Rate | 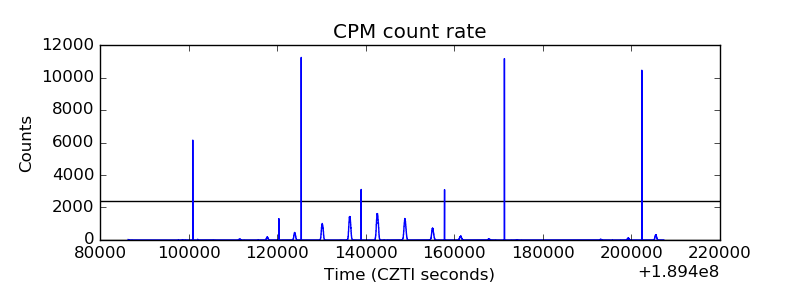 |
| CZT Counter |  |
| +2.5 Volts monitor |  |
| +5 Volts monitor |  |
| _ROLL_ROT | 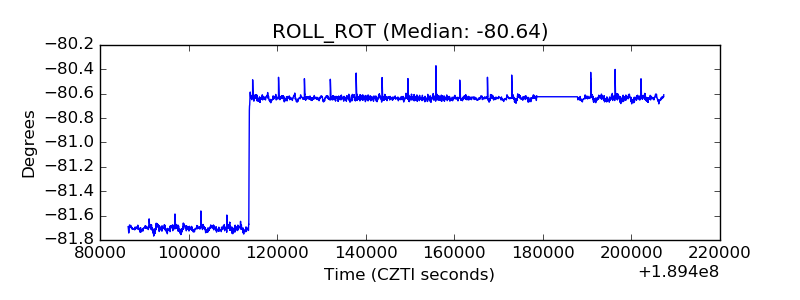 |
| _Roll_DEC |  |
| _Roll_RA | 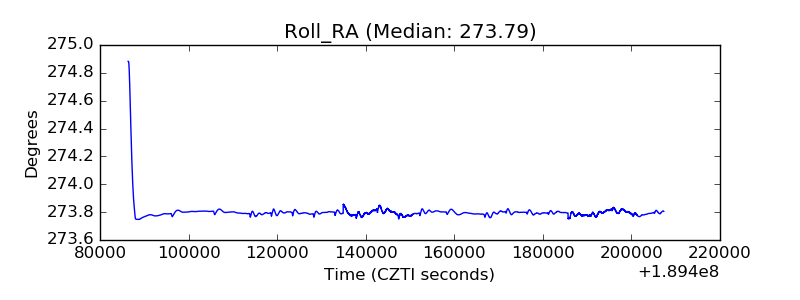 |
| Veto Counter |  |