| Param | Original file | Final file |
|---|---|---|
| Filename | modeM0/AS1G02_034T02_9000000244cztM0_level2.fits | modeM0/AS1G02_034T02_9000000244cztM0_level2_quad_clean.evt |
| Size (bytes) | 97,211,520 | 88,611,840 |
| Size | 92.7 MB | 84.5 MB |
| Events in quadrant A | 557,406 | 475,031 |
| Events in quadrant B | 555,238 | 489,231 |
| Events in quadrant C | 550,062 | 475,887 |
| Events in quadrant D | 474,152 | 435,292 |
| Mode M0 | |||
|---|---|---|---|
| Quadrant | BADHDUFLAG | Total packets | Discarded packets |
| A | 0 | 49621 | 0 |
| B | 0 | 52495 | 0 |
| C | 0 | 50323 | 0 |
| D | 0 | 46989 | 0 |
| Mode SS | |||
|---|---|---|---|
| Quadrant | BADHDUFLAG | Total packets | Discarded packets |
| A | 0 | 236 | 0 |
| B | 0 | 236 | 0 |
| C | 0 | 236 | 0 |
| D | 0 | 236 | 0 |
| Mode M9 | |||
|---|---|---|---|
| Quadrant | BADHDUFLAG | Total packets | Discarded packets |
| A | 0 | 25 | 0 |
| B | 0 | 25 | 0 |
| C | 0 | 25 | 0 |
| D | 0 | 25 | 0 |
| Quadrant | Total seconds | Saturated seconds | Saturation percentage |
|---|---|---|---|
| A | 11673 | 62 | 0.531140% |
| B | 11673 | 65 | 0.556841% |
| C | 11673 | 31 | 0.265570% |
| D | 11673 | 378 | 3.238242% |
Noise dominated data is calculated using 1-second bins in cleaned event files. If a bin has >2000 counts, and if more than 50% of those come from <1% of pixels, then it is considered to be noise-dominated and hence unusable.
| Quadrant | # 1 sec bins | Bins with >0 counts | Bins with >2000 counts | High rate bins dominated by noise | Noise dominated (total time) | Noise dominated (detector-on time) | Marked lightcurve |
|---|---|---|---|---|---|---|---|
| A | 14093 | 11673 | 0 | 0 | 0.00% | 0.00% | 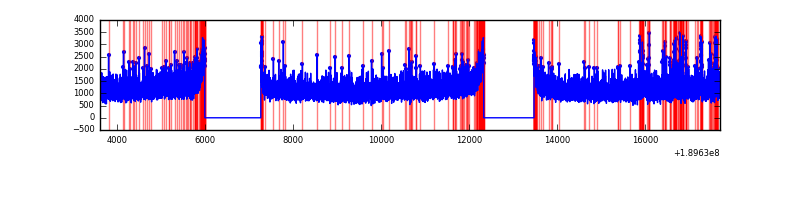 |
| B | 14093 | 11673 | 0 | 0 | 0.00% | 0.00% |  |
| C | 14093 | 11672 | 0 | 0 | 0.00% | 0.00% |  |
| D | 14093 | 11639 | 0 | 0 | 0.00% | 0.00% |  |
Top three noisy pixels from each quadrant. If the there are fewer than three noisy pixels in the level2.evt file, extra rows are filled as -1
| Pixel properties | Quadrant properties | ||||||
|---|---|---|---|---|---|---|---|
| Quadrant | DetID | PixID | Counts | Sigma | Mean | Median | Sigma |
| A | 0 | 29 | 510 | 10.8 | 144 | 135 | 34.7 |
| A | 7 | 110 | 497 | 10.43 | 144 | 135 | 34.7 |
| A | 14 | 188 | 439 | 8.76 | 144 | 135 | 34.7 |
| B | 2 | 9 | 482 | 11.58 | 146 | 139 | 29.6 |
| B | 2 | 8 | 372 | 7.86 | 146 | 139 | 29.6 |
| B | 10 | 225 | 361 | 7.49 | 146 | 139 | 29.6 |
| C | 1 | 81 | 356 | 5.98 | 145 | 135 | 37.0 |
| C | 9 | 242 | 355 | 5.95 | 145 | 135 | 37.0 |
| C | 12 | 241 | 354 | 5.93 | 145 | 135 | 37.0 |
| D | 11 | 82 | 367 | 7.17 | 135 | 123 | 34.0 |
| D | 15 | 46 | 339 | 6.35 | 135 | 123 | 34.0 |
| D | 15 | 30 | 334 | 6.2 | 135 | 123 | 34.0 |
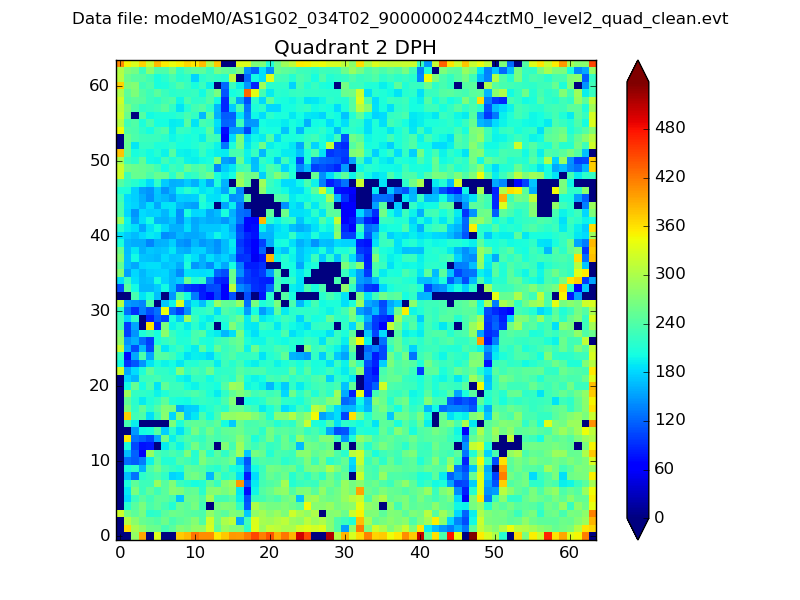
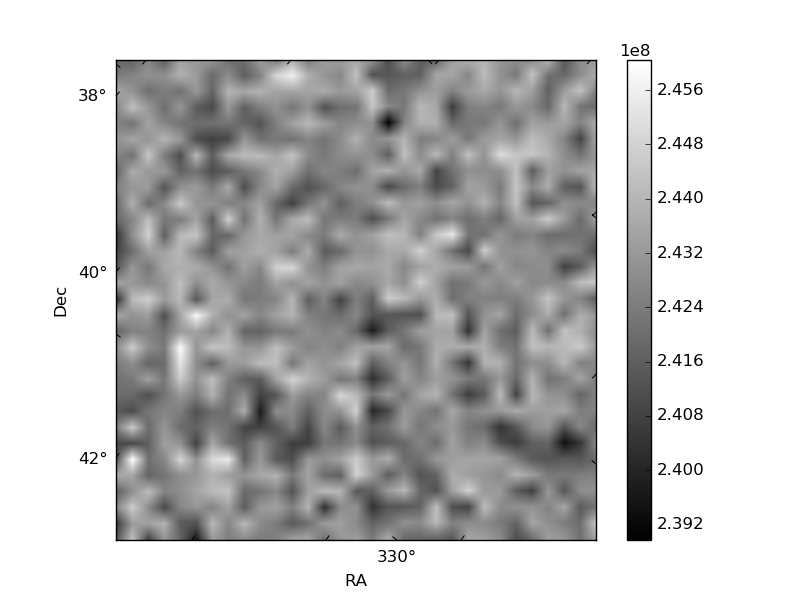
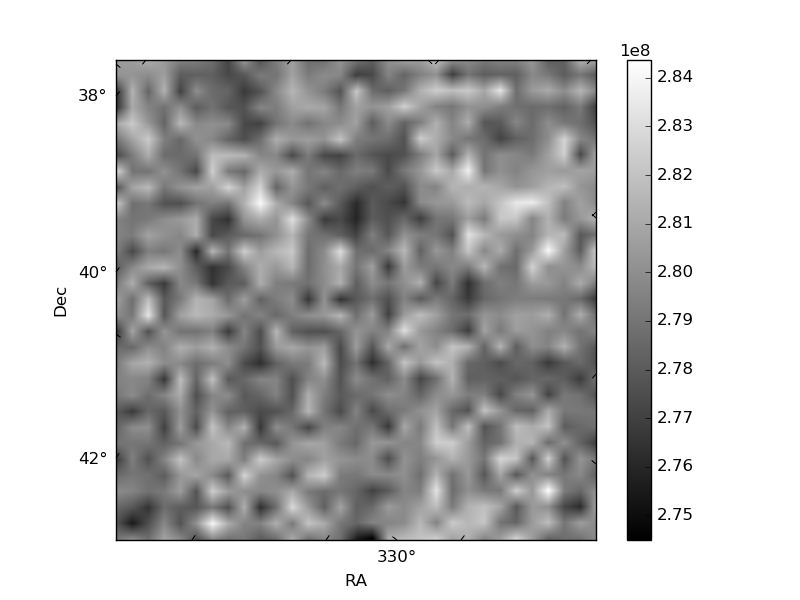
Histogram calculated using DETX and DETY for each event in the final _common_clean file
| Quadrant A | 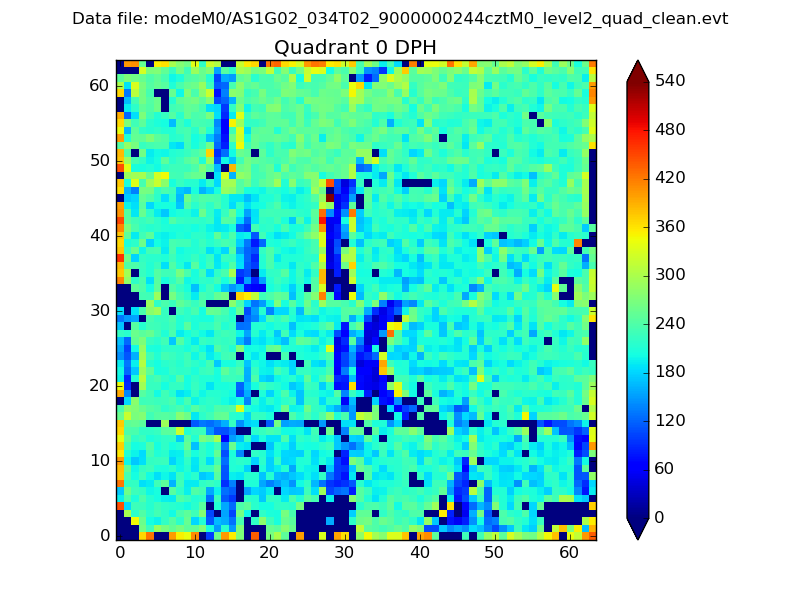 |
 |
Quadrant B |
|---|---|---|---|
| Quadrant D |  |
 |
Quadrant C |
| Plot type | Count rate plots | Images |
|---|---|---|
| Comparison with Poisson distribution Blue bars denote a histogram of data divided into 1 sec bins. Red curve is a Poisson curve with rate = median count rate of data. |
 |
 |
| Quadrant-wise count rates Data is divided into 100 sec bins |
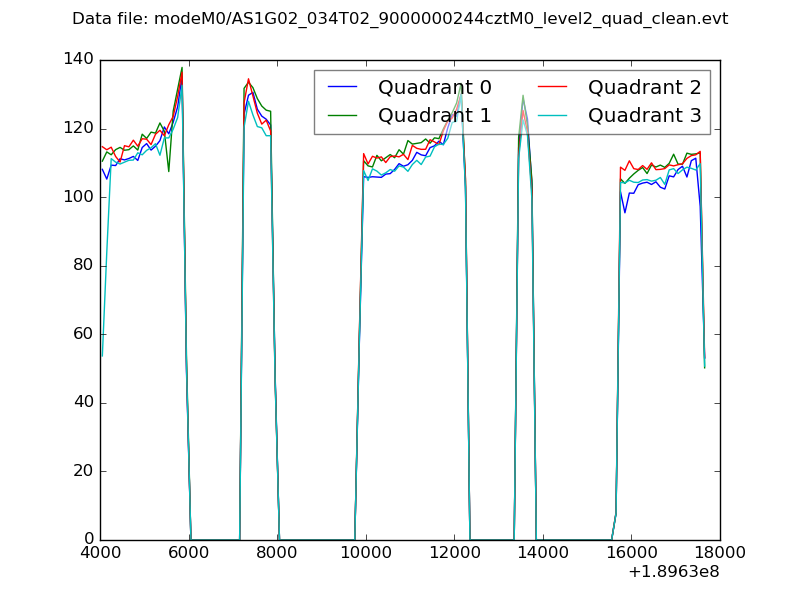 |
|
| Module-wise count rates for Quadrant A Data is divided into 100 sec bins |
 |
 |
| Module-wise count rates for Quadrant B Data is divided into 100 sec bins |
 |
 |
| Module-wise count rates for Quadrant C Data is divided into 100 sec bins |
 |
 |
| Module-wise count rates for Quadrant D Data is divided into 100 sec bins |
 |
 |
| Parameter | Plot |
|---|---|
| CZT HV Monitor |  |
| D_VDD |  |
| Temperature 1 |  |
| Veto HV Monitor |  |
| Veto LLD |  |
| Alpha Counter |  |
| _CPM_Rate | 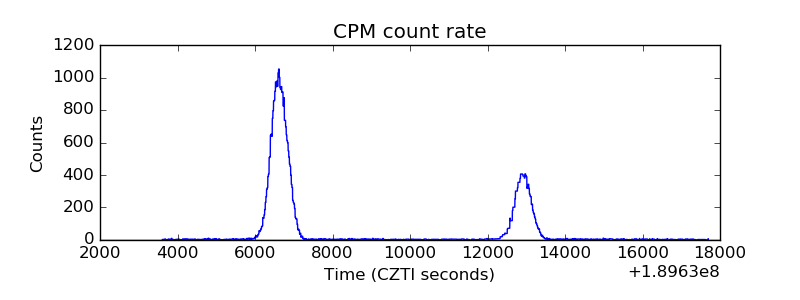 |
| CZT Counter |  |
| +2.5 Volts monitor |  |
| +5 Volts monitor |  |
| _ROLL_ROT |  |
| _Roll_DEC |  |
| _Roll_RA | 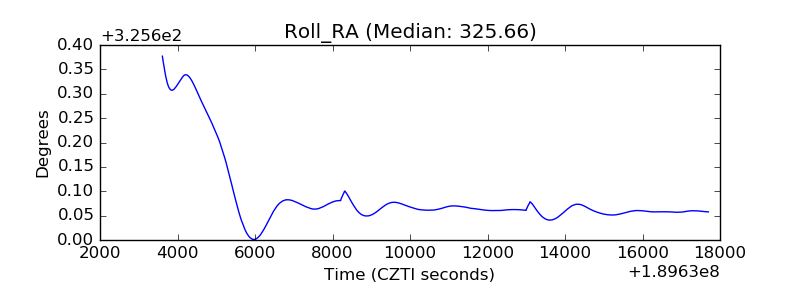 |
| Veto Counter |  |