| Param | Original file | Final file |
|---|---|---|
| Filename | modeM0/AS1G02_058T01_9000000242cztM0_level2.fits | modeM0/AS1G02_058T01_9000000242cztM0_level2_quad_clean.evt |
| Size (bytes) | 159,984,000 | 178,776,000 |
| Size | 152.6 MB | 170.5 MB |
| Events in quadrant A | 928,190 | 1,091,219 |
| Events in quadrant B | 923,238 | 1,096,150 |
| Events in quadrant C | 934,220 | 1,048,709 |
| Events in quadrant D | 729,928 | 849,182 |
| Mode M9 | |||
|---|---|---|---|
| Quadrant | BADHDUFLAG | Total packets | Discarded packets |
| A | 0 | 35 | 0 |
| B | 0 | 35 | 0 |
| C | 0 | 35 | 0 |
| D | 0 | 35 | 0 |
| Mode SS | |||
|---|---|---|---|
| Quadrant | BADHDUFLAG | Total packets | Discarded packets |
| A | 0 | 392 | 0 |
| B | 0 | 392 | 0 |
| C | 0 | 392 | 0 |
| D | 0 | 392 | 0 |
| Mode M0 | |||
|---|---|---|---|
| Quadrant | BADHDUFLAG | Total packets | Discarded packets |
| A | 0 | 78273 | 0 |
| B | 0 | 87682 | 0 |
| C | 0 | 82492 | 0 |
| D | 0 | 99272 | 0 |
| Quadrant | Total seconds | Saturated seconds | Saturation percentage |
|---|---|---|---|
| A | 19282 | 43 | 0.223006% |
| B | 19281 | 85 | 0.440849% |
| C | 19281 | 70 | 0.363052% |
| D | 19284 | 2712 | 14.063472% |
Noise dominated data is calculated using 1-second bins in cleaned event files. If a bin has >2000 counts, and if more than 50% of those come from <1% of pixels, then it is considered to be noise-dominated and hence unusable.
| Quadrant | # 1 sec bins | Bins with >0 counts | Bins with >2000 counts | High rate bins dominated by noise | Noise dominated (total time) | Noise dominated (detector-on time) | Marked lightcurve |
|---|---|---|---|---|---|---|---|
| A | 25233 | 19287 | 0 | 0 | 0.00% | 0.00% | 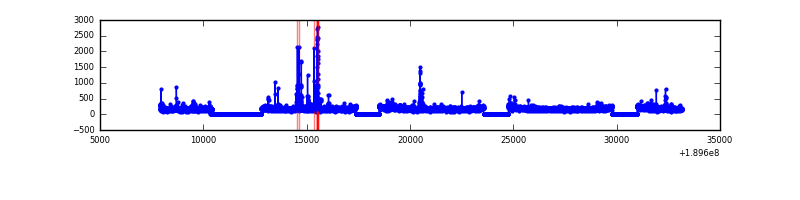 |
| B | 25233 | 19284 | 0 | 0 | 0.00% | 0.00% | 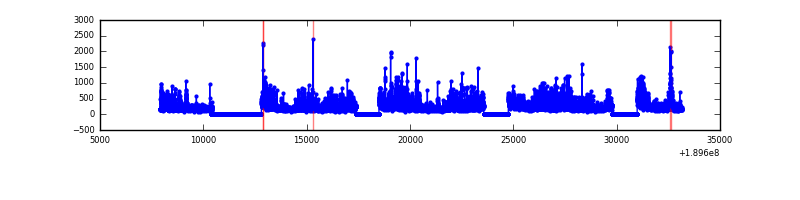 |
| C | 25233 | 19290 | 0 | 0 | 0.00% | 0.00% | 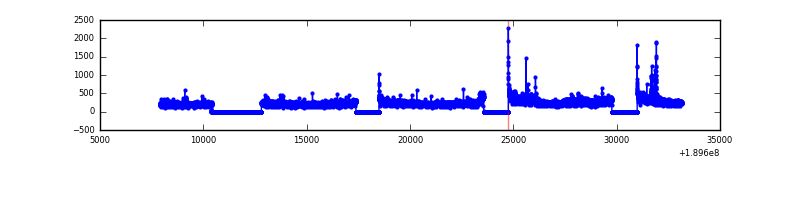 |
| D | 25233 | 19155 | 0 | 0 | 0.00% | 0.00% | 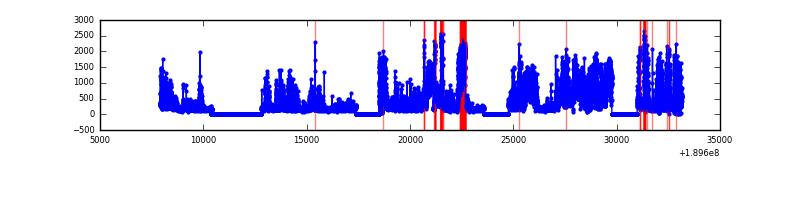 |
Top three noisy pixels from each quadrant. If the there are fewer than three noisy pixels in the level2.evt file, extra rows are filled as -1
| Pixel properties | Quadrant properties | ||||||
|---|---|---|---|---|---|---|---|
| Quadrant | DetID | PixID | Counts | Sigma | Mean | Median | Sigma |
| A | 7 | 110 | 842 | 10.78 | 240 | 226 | 57.1 |
| A | 0 | 29 | 835 | 10.66 | 240 | 226 | 57.1 |
| A | 14 | 188 | 690 | 8.12 | 240 | 226 | 57.1 |
| B | 2 | 9 | 708 | 10.34 | 244 | 233 | 45.9 |
| B | 14 | 254 | 610 | 8.21 | 244 | 233 | 45.9 |
| B | 13 | 245 | 576 | 7.47 | 244 | 233 | 45.9 |
| C | 12 | 241 | 667 | 7.18 | 246 | 230 | 60.9 |
| C | 2 | 191 | 651 | 6.92 | 246 | 230 | 60.9 |
| C | 1 | 81 | 625 | 6.49 | 246 | 230 | 60.9 |
| D | 6 | 231 | 547 | 7.15 | 207 | 191 | 49.8 |
| D | 6 | 44 | 541 | 7.02 | 207 | 191 | 49.8 |
| D | 11 | 82 | 540 | 7.0 | 207 | 191 | 49.8 |
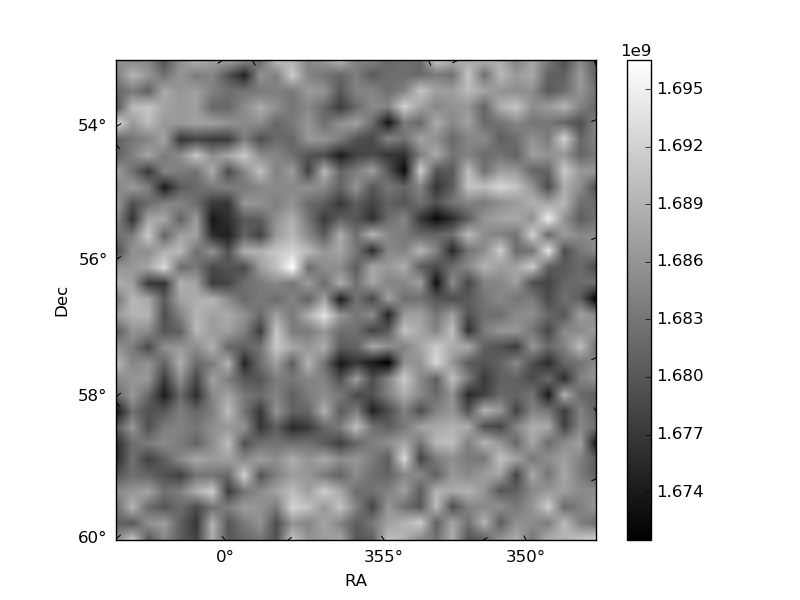
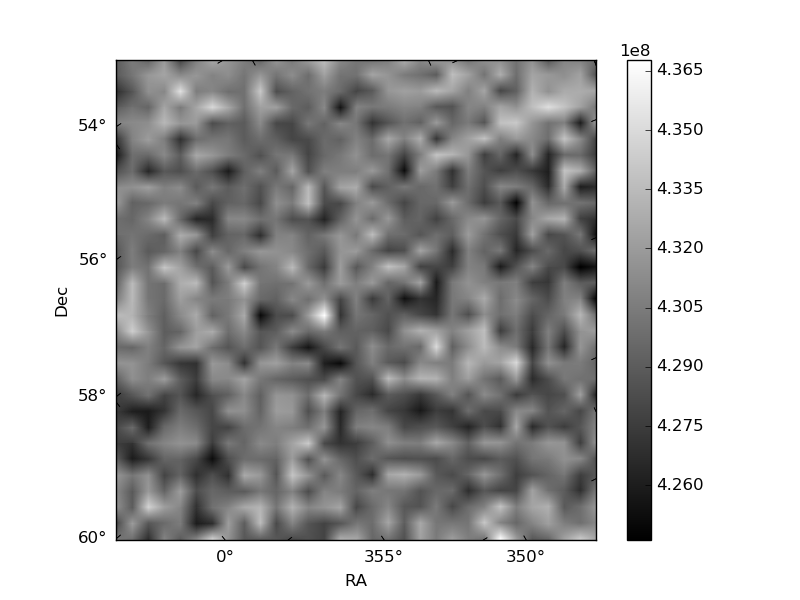
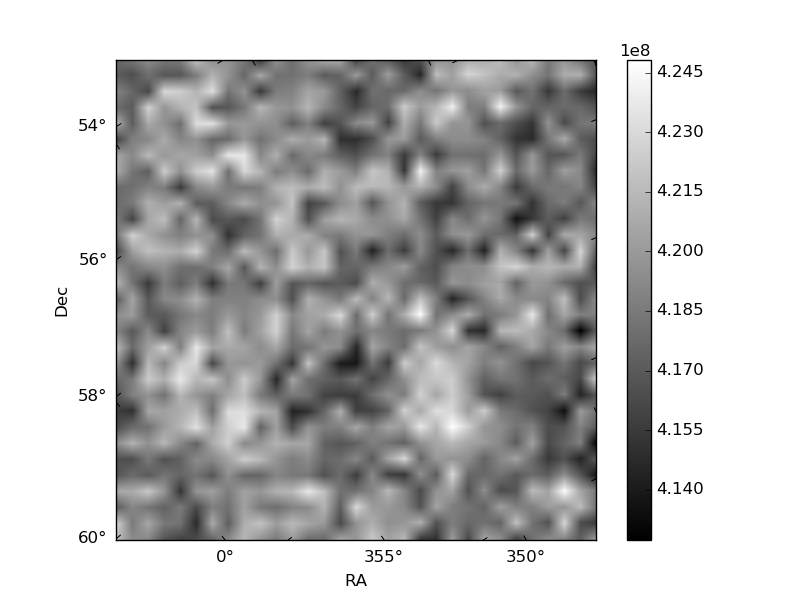
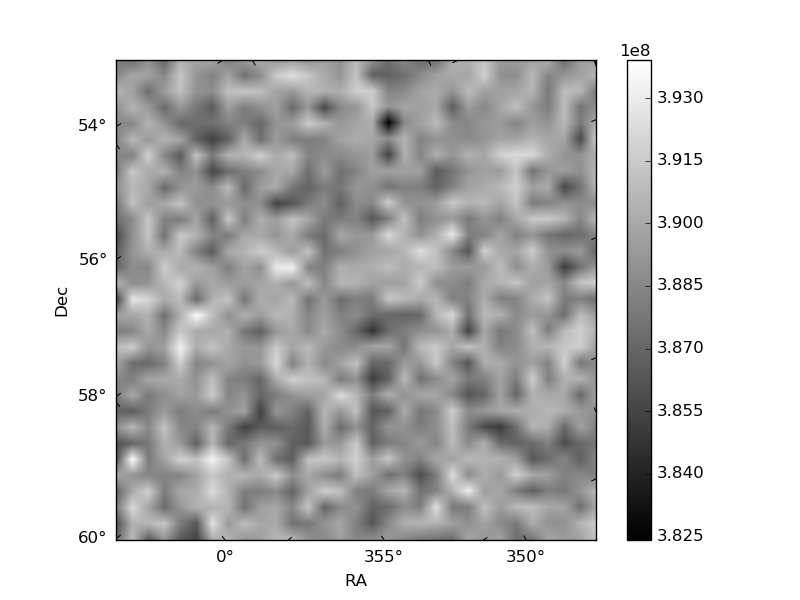
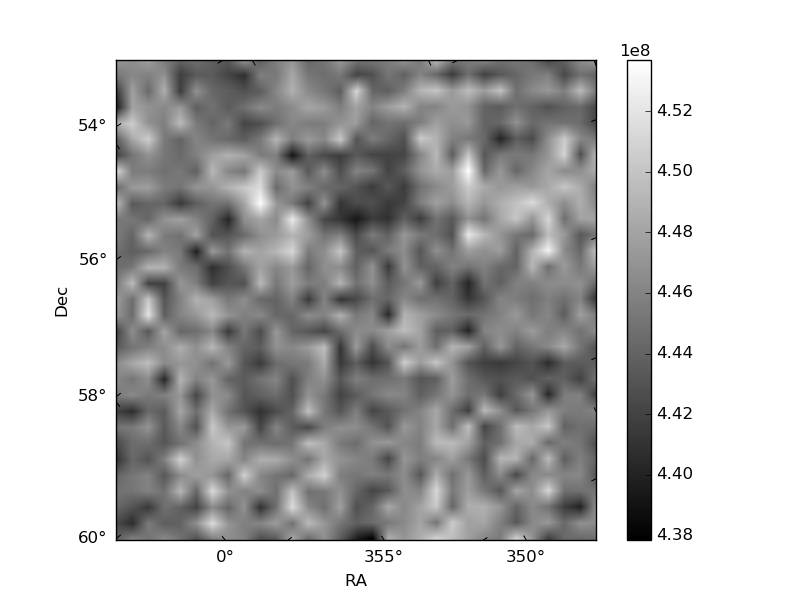
Histogram calculated using DETX and DETY for each event in the final _common_clean file
| Quadrant A | 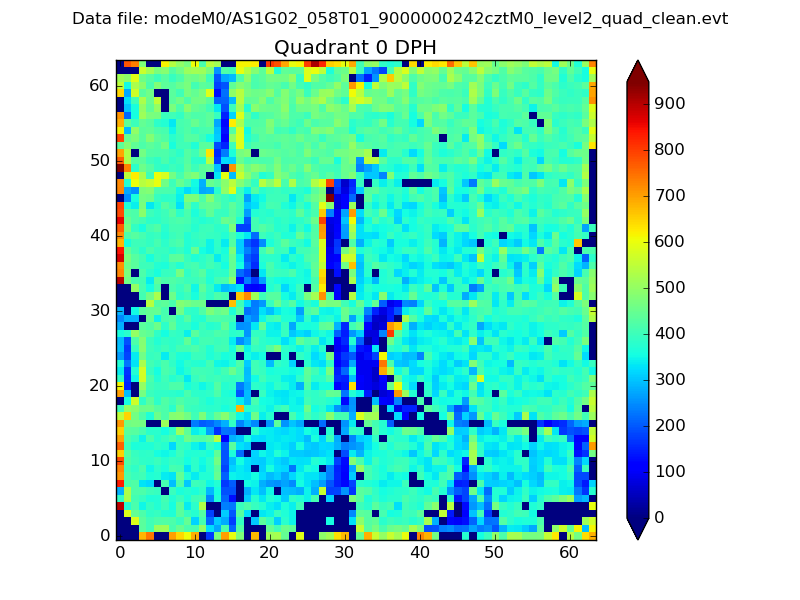 |
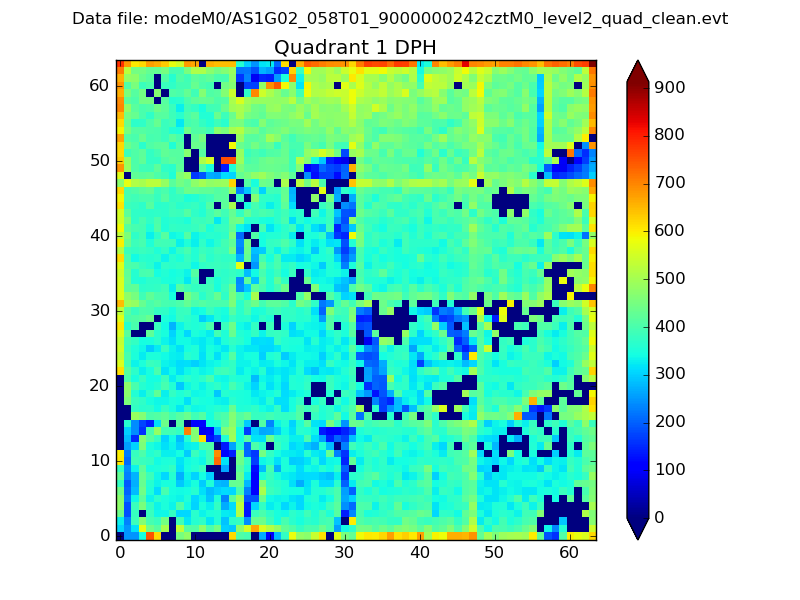 |
Quadrant B |
|---|---|---|---|
| Quadrant D | 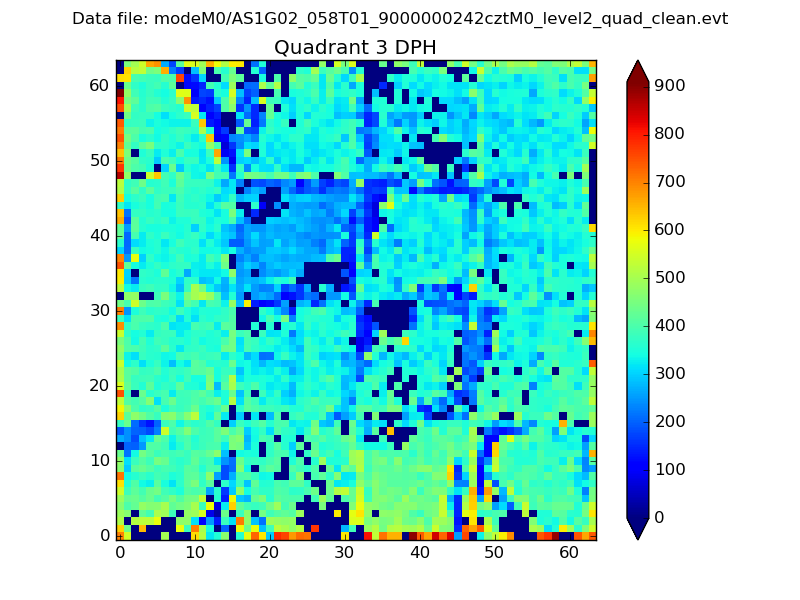 |
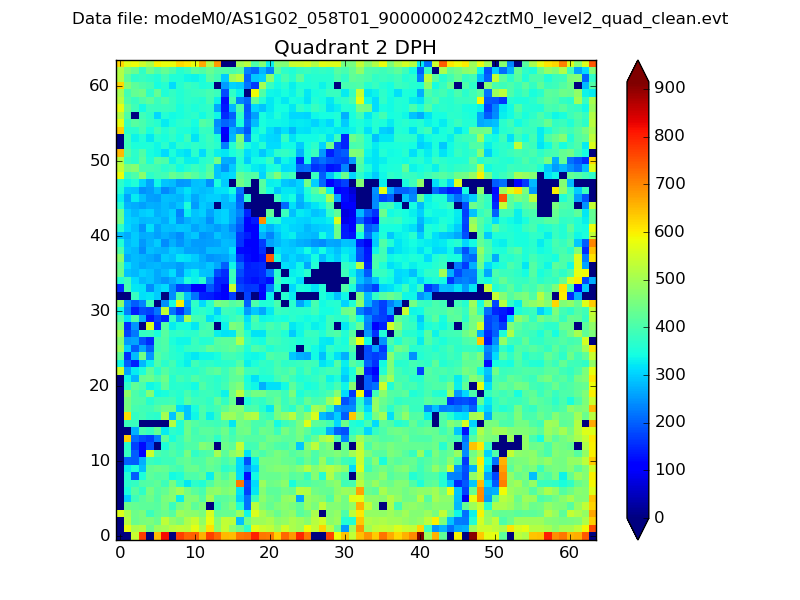 |
Quadrant C |
| Plot type | Count rate plots | Images |
|---|---|---|
| Comparison with Poisson distribution Blue bars denote a histogram of data divided into 1 sec bins. Red curve is a Poisson curve with rate = median count rate of data. |
 |
 |
| Quadrant-wise count rates Data is divided into 100 sec bins |
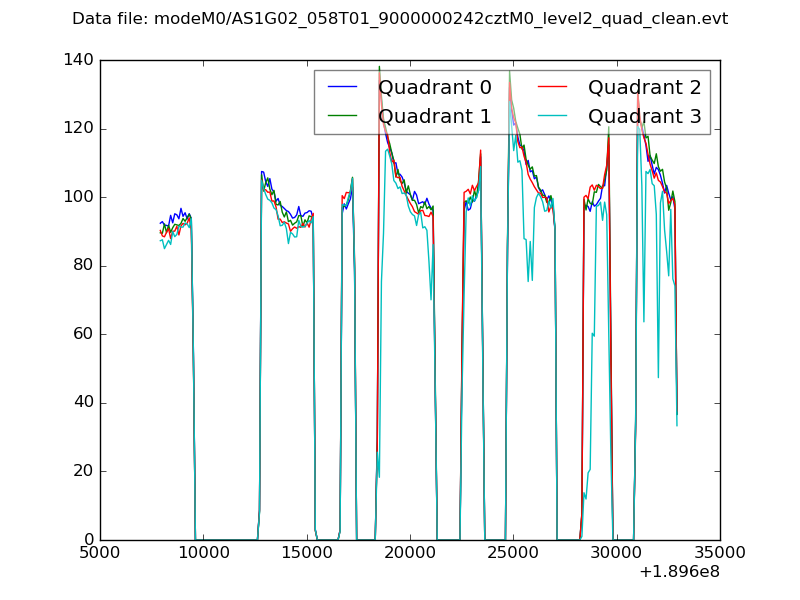 |
|
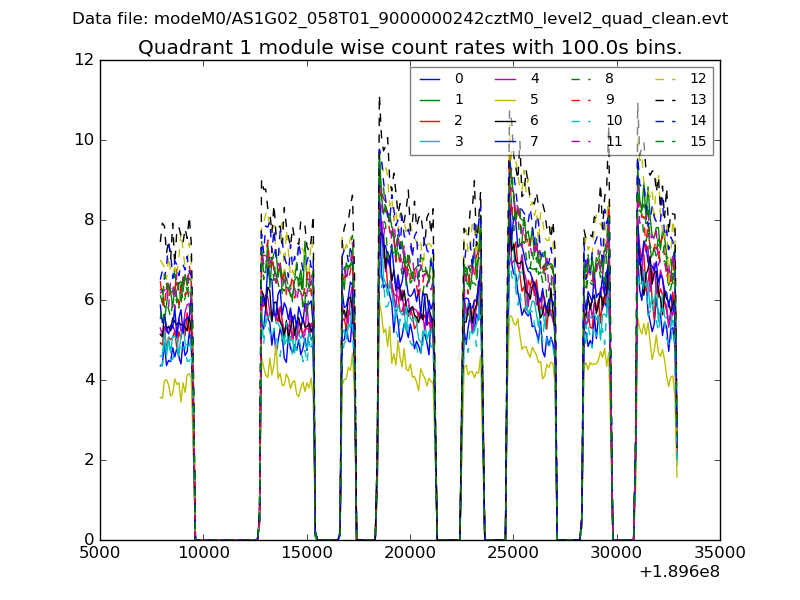
| Module-wise count rates for Quadrant A Data is divided into 100 sec bins |
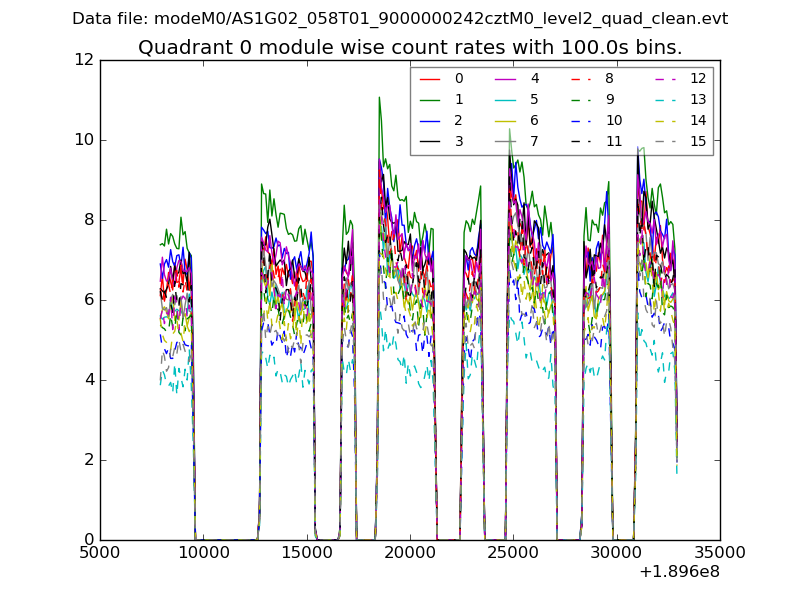 |
 |
| Module-wise count rates for Quadrant B Data is divided into 100 sec bins |
 |
 |
| Module-wise count rates for Quadrant C Data is divided into 100 sec bins |
 |
 |
| Module-wise count rates for Quadrant D Data is divided into 100 sec bins |
 |
 |
| Parameter | Plot |
|---|---|
| CZT HV Monitor | 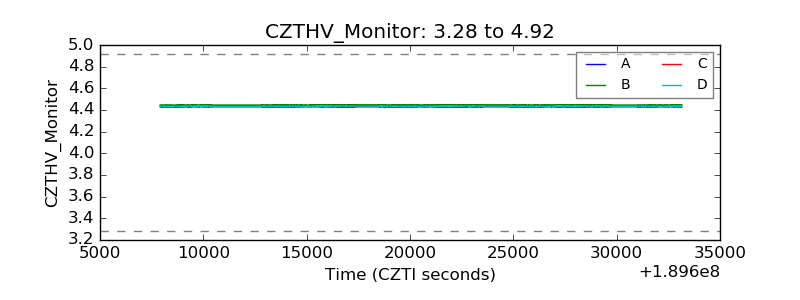 |
| D_VDD | 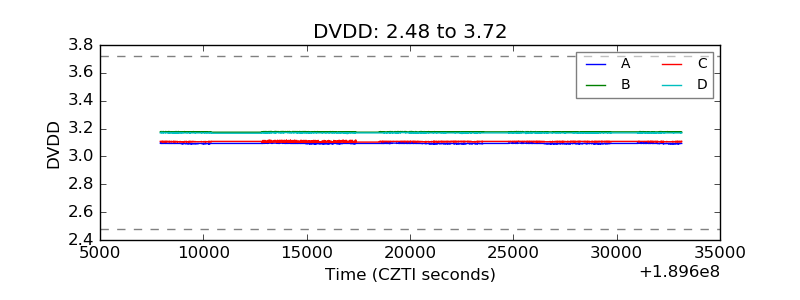 |
| Temperature 1 | 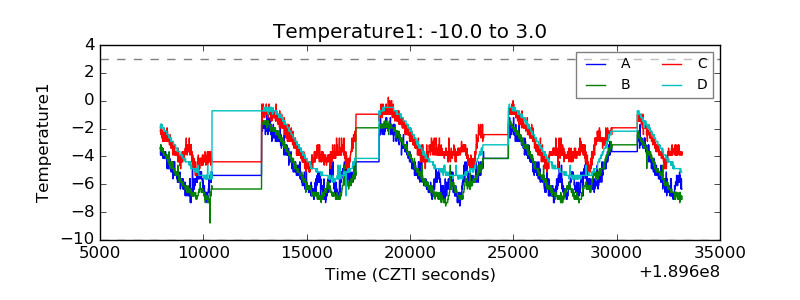 |
| Veto HV Monitor | 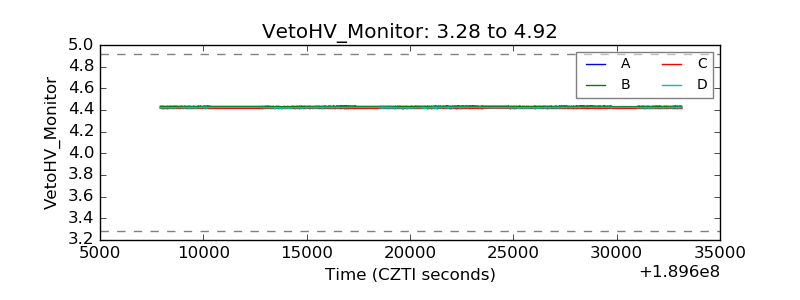 |
| Veto LLD | 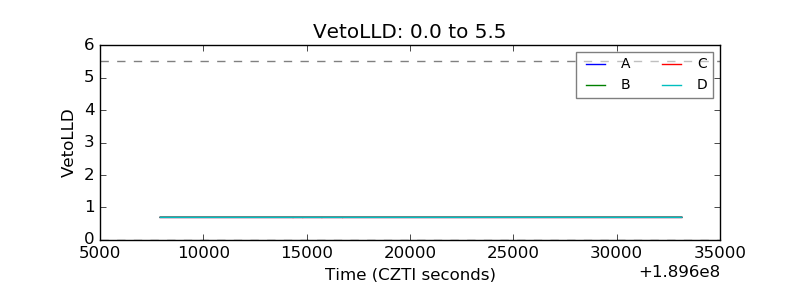 |
| Alpha Counter | 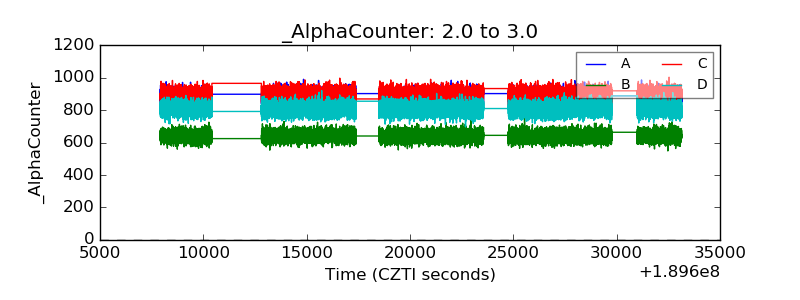 |
| _CPM_Rate | 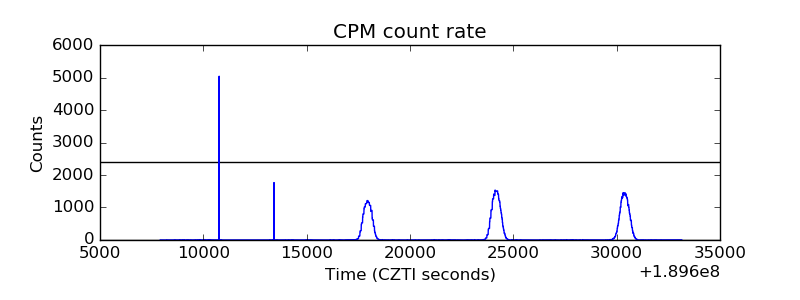 |
| CZT Counter | 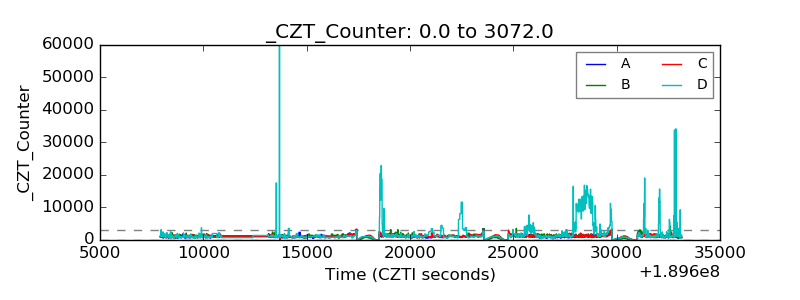 |
| +2.5 Volts monitor |  |
| +5 Volts monitor | 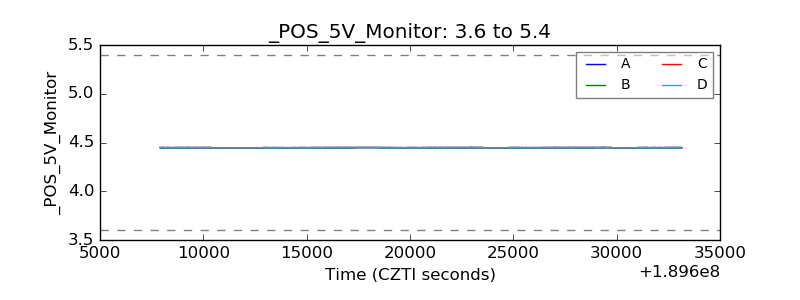 |
| _ROLL_ROT |  |
| _Roll_DEC |  |
| _Roll_RA | 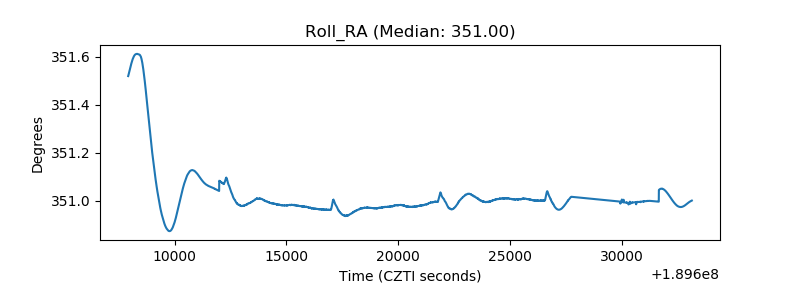 |
| Veto Counter | 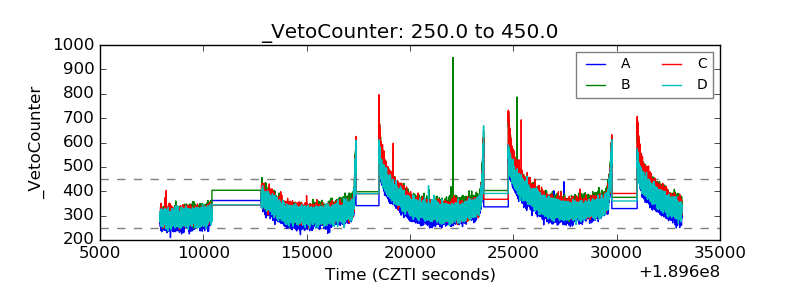 |