| Param | Original file | Final file |
|---|---|---|
| Filename | modeM0/AS1T01_023T01_9000000250_01493cztM0_level2.evt | modeM0/AS1T01_023T01_9000000250_01493cztM0_level2_quad_clean.evt |
| Size (bytes) | 1,128,231,360 | 63,982,080 |
| Size | 1.1 GB | 61.0 MB |
| Events in quadrant A | 8,676,216 | 363,485 |
| Events in quadrant B | 8,664,728 | 370,814 |
| Events in quadrant C | 8,061,682 | 368,703 |
| Events in quadrant D | 8,317,057 | 361,445 |
| Mode SS | |||
|---|---|---|---|
| Quadrant | BADHDUFLAG | Total packets | Discarded packets |
| A | 0 | 138 | 0 |
| B | 0 | 138 | 0 |
| C | 0 | 138 | 0 |
| D | 0 | 138 | 0 |
| Mode M0 | |||
|---|---|---|---|
| Quadrant | BADHDUFLAG | Total packets | Discarded packets |
| A | 0 | 30597 | 2 |
| B | 0 | 30551 | 1 |
| C | 0 | 28772 | 1 |
| D | 0 | 29529 | 1 |
| Mode M9 | |||
|---|---|---|---|
| Quadrant | BADHDUFLAG | Total packets | Discarded packets |
| A | 0 | 8 | 0 |
| B | 0 | 8 | 0 |
| C | 0 | 8 | 0 |
| D | 0 | 8 | 0 |
| Quadrant | Total seconds | Saturated seconds | Saturation percentage |
|---|---|---|---|
| A | 6782 | 39 | 0.575052% |
| B | 6782 | 35 | 0.516072% |
| C | 6782 | 17 | 0.250664% |
| D | 6782 | 108 | 1.592451% |
Noise dominated data is calculated using 1-second bins in cleaned event files. If a bin has >2000 counts, and if more than 50% of those come from <1% of pixels, then it is considered to be noise-dominated and hence unusable.
| Quadrant | # 1 sec bins | Bins with >0 counts | Bins with >2000 counts | High rate bins dominated by noise | Noise dominated (total time) | Noise dominated (detector-on time) | Marked lightcurve |
|---|---|---|---|---|---|---|---|
| A | 7592 | 6783 | 319 | 319 | 4.20% | 4.70% | 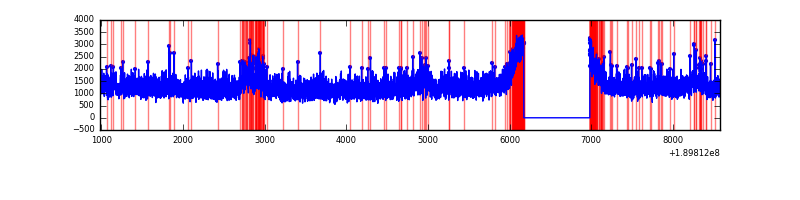 |
| B | 7592 | 6783 | 341 | 341 | 4.49% | 5.03% | 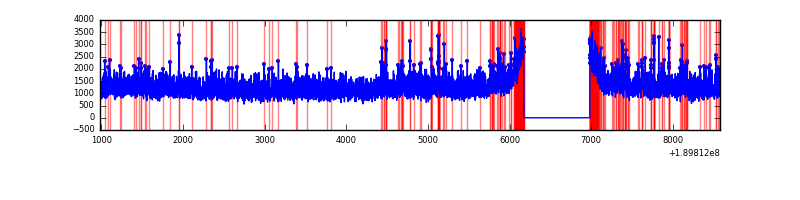 |
| C | 7592 | 6782 | 217 | 217 | 2.86% | 3.20% | 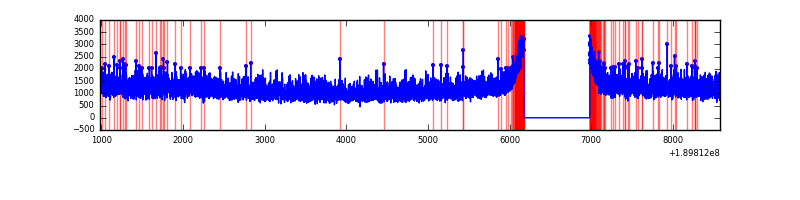 |
| D | 7592 | 6783 | 393 | 393 | 5.18% | 5.79% | 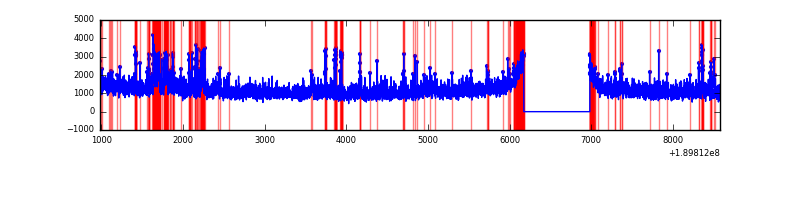 |
Top three noisy pixels from each quadrant. If the there are fewer than three noisy pixels in the level2.evt file, extra rows are filled as -1
| Pixel properties | Quadrant properties | ||||||
|---|---|---|---|---|---|---|---|
| Quadrant | DetID | PixID | Counts | Sigma | Mean | Median | Sigma |
| A | 15 | 127 | 734874 | 1466.54 | 2064 | 2081 | 499.7 |
| A | 4 | 32 | 14443 | 24.74 | 2064 | 2081 | 499.7 |
| A | 13 | 235 | 12435 | 20.72 | 2064 | 2081 | 499.7 |
| B | 8 | 4 | 284675 | 548.02 | 2176 | 2190 | 515.5 |
| B | 12 | 52 | 31143 | 56.17 | 2176 | 2190 | 515.5 |
| B | 15 | 22 | 30759 | 55.42 | 2176 | 2190 | 515.5 |
| C | 15 | 241 | 255937 | 458.03 | 1982 | 2052 | 554.3 |
| C | 3 | 111 | 19933 | 32.26 | 1982 | 2052 | 554.3 |
| C | 7 | 239 | 13841 | 21.27 | 1982 | 2052 | 554.3 |
| D | 9 | 66 | 890646 | 1512.41 | 1905 | 1981 | 587.6 |
| D | 10 | 125 | 107647 | 179.83 | 1905 | 1981 | 587.6 |
| D | 9 | 53 | 78386 | 130.03 | 1905 | 1981 | 587.6 |
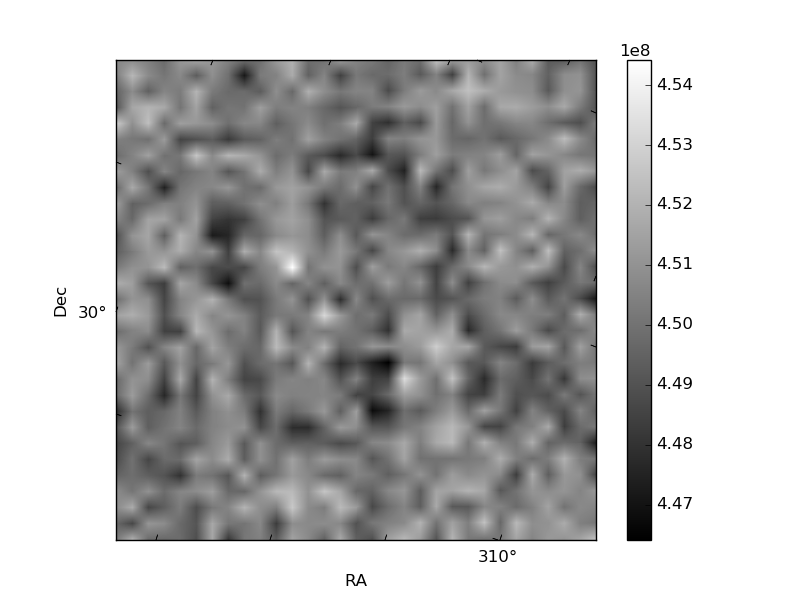
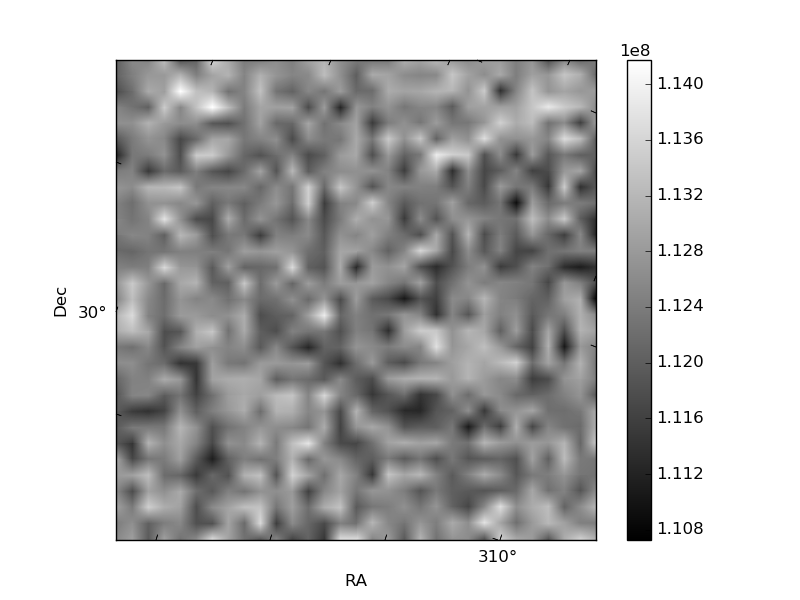
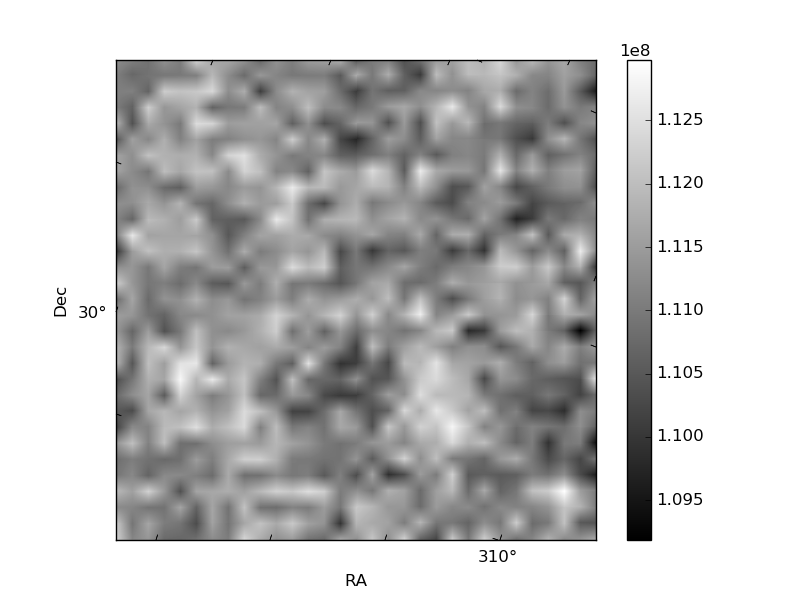
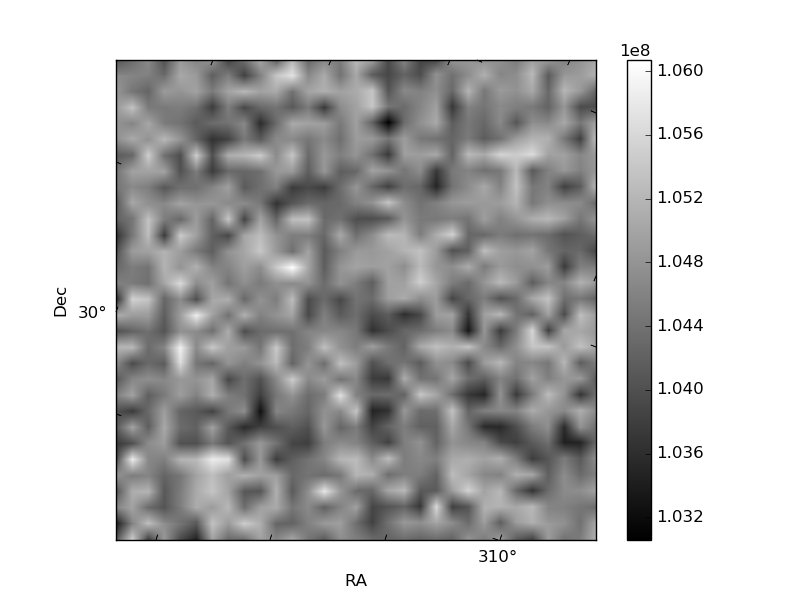
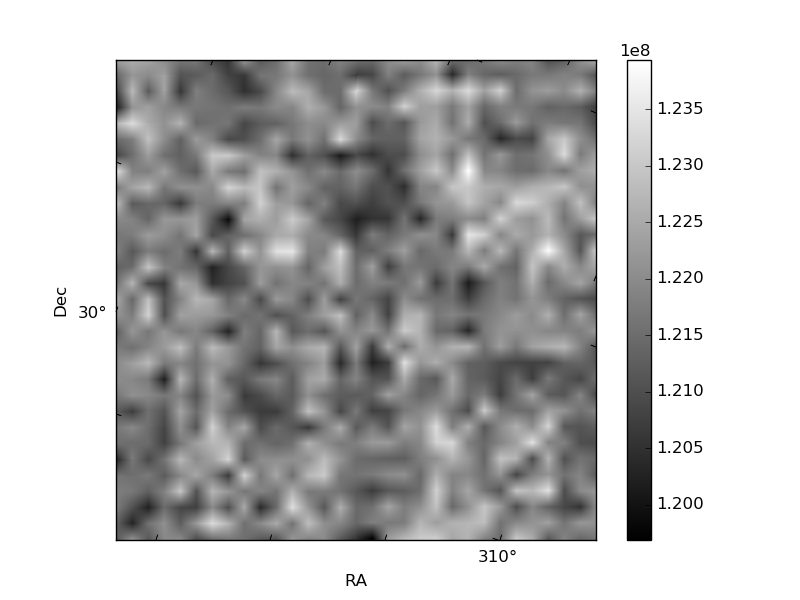
Histogram calculated using DETX and DETY for each event in the final _common_clean file
| Quadrant A | 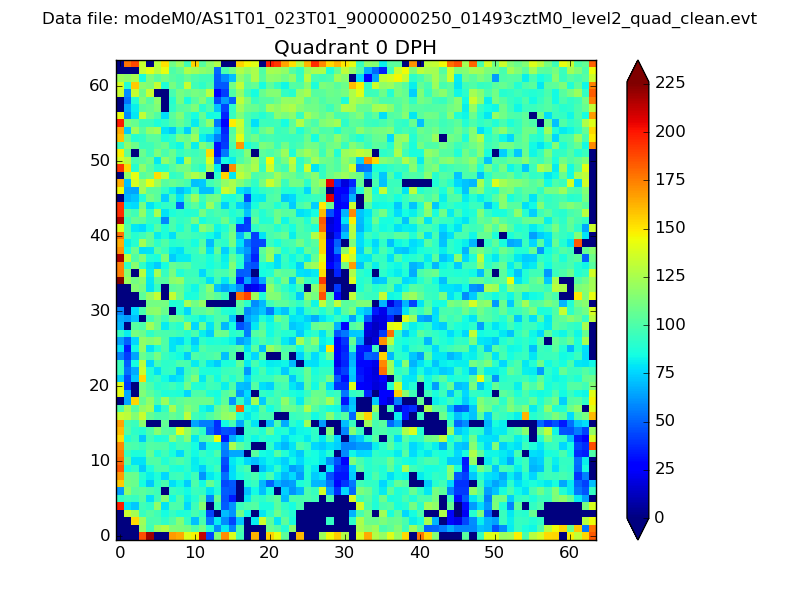 |
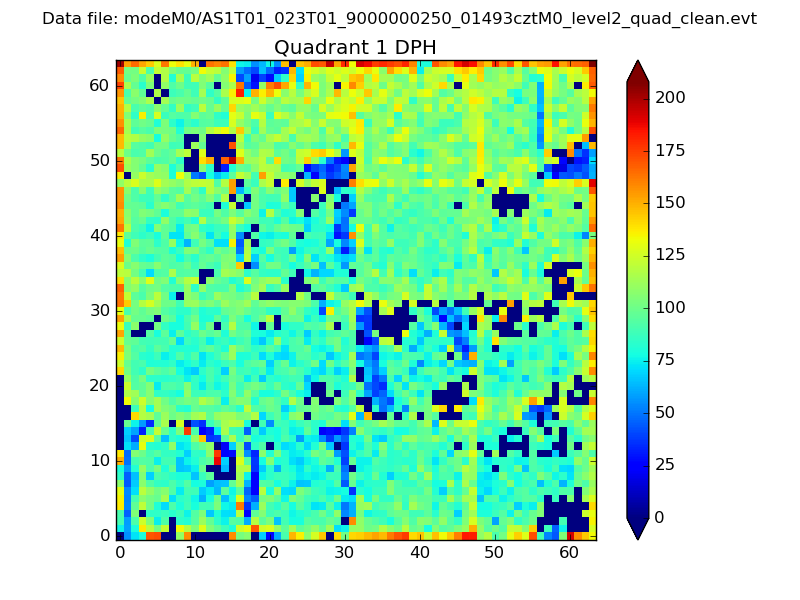 |
Quadrant B |
|---|---|---|---|
| Quadrant D | 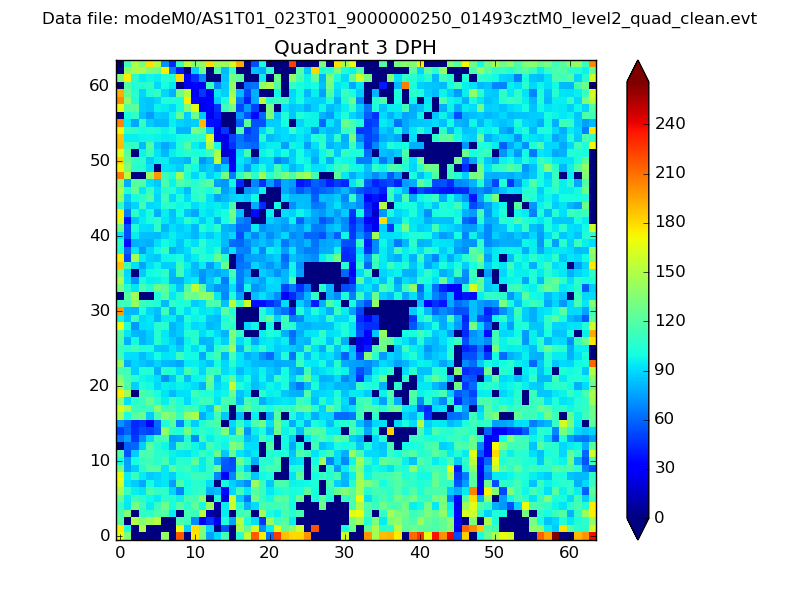 |
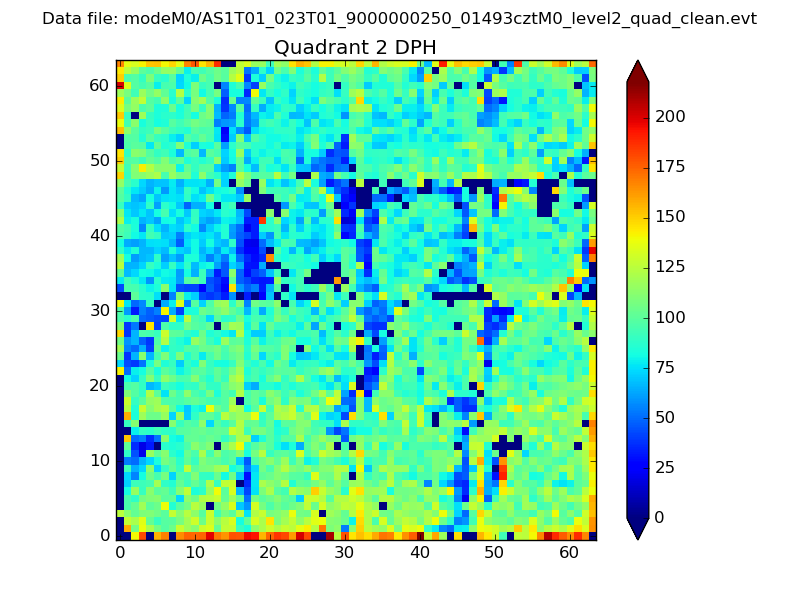 |
Quadrant C |
| Plot type | Count rate plots | Images |
|---|---|---|
| Comparison with Poisson distribution Blue bars denote a histogram of data divided into 1 sec bins. Red curve is a Poisson curve with rate = median count rate of data. |
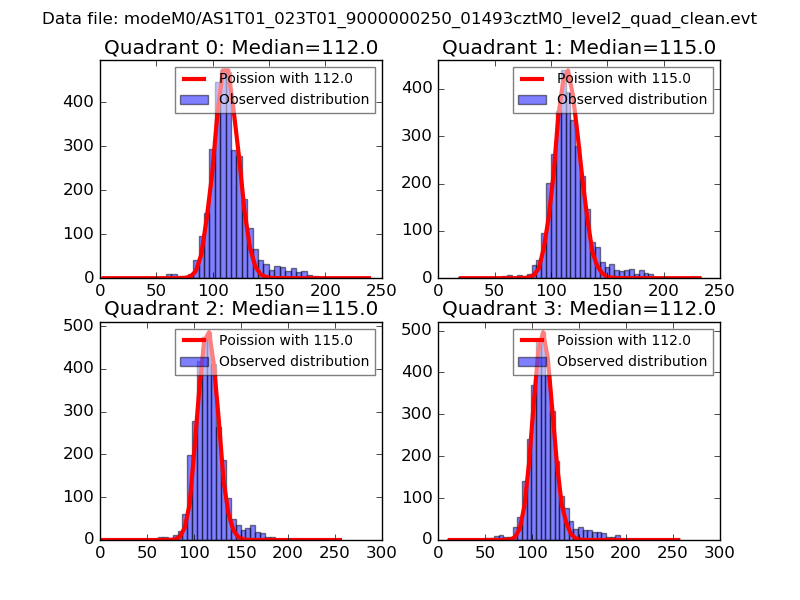 |
 |
| Quadrant-wise count rates Data is divided into 100 sec bins |
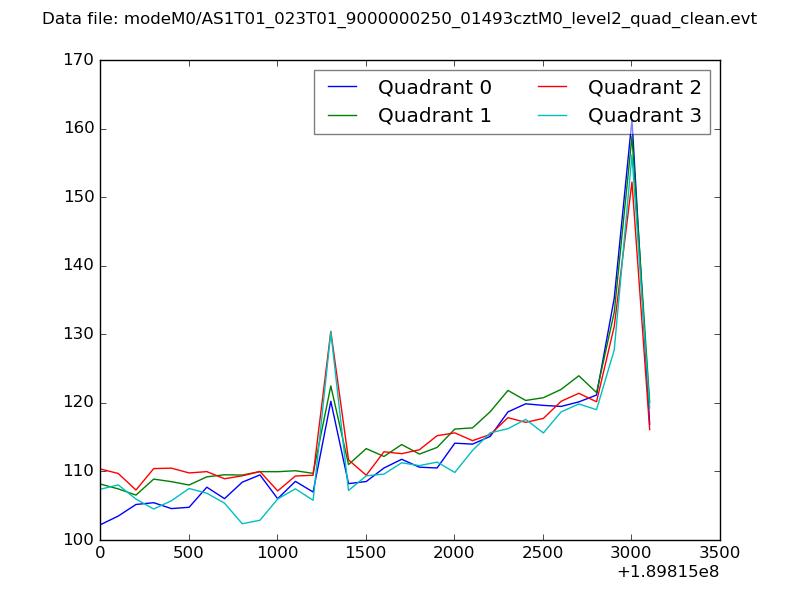 |
|
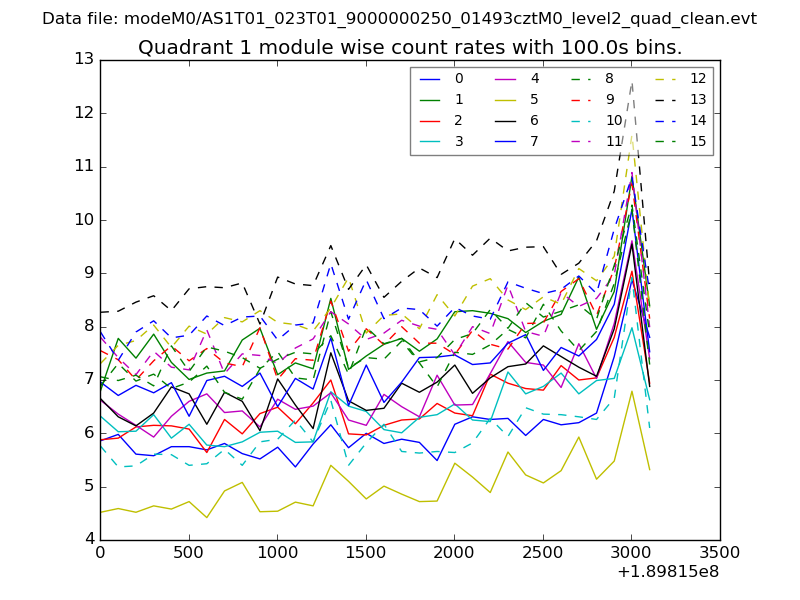
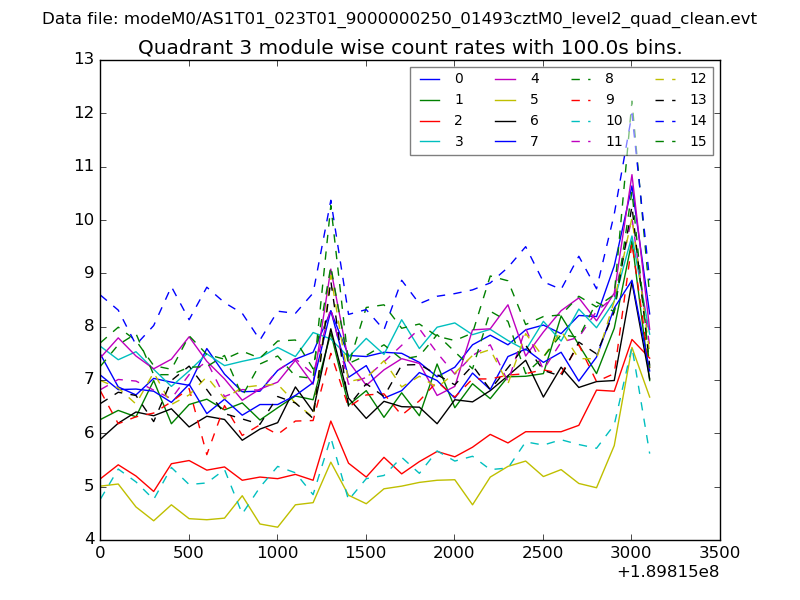
| Module-wise count rates for Quadrant A Data is divided into 100 sec bins |
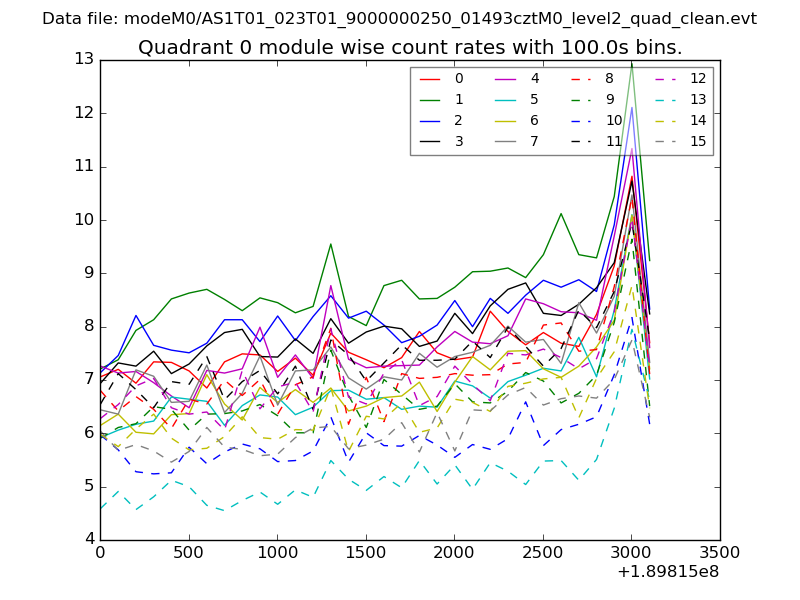 |
 |
| Module-wise count rates for Quadrant B Data is divided into 100 sec bins |
 |
 |
| Module-wise count rates for Quadrant C Data is divided into 100 sec bins |
 |
 |
| Module-wise count rates for Quadrant D Data is divided into 100 sec bins |
 |
 |
| Parameter | Plot |
|---|---|
| CZT HV Monitor |  |
| D_VDD | 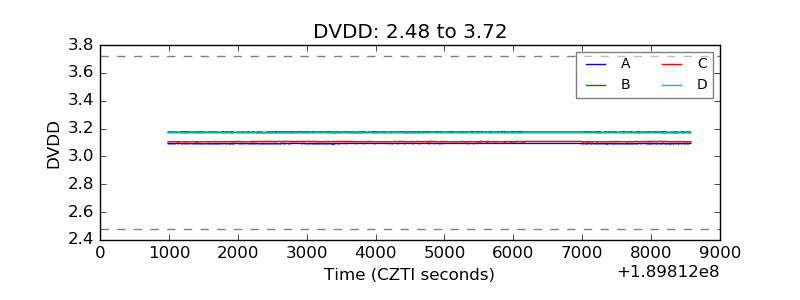 |
| Temperature 1 | 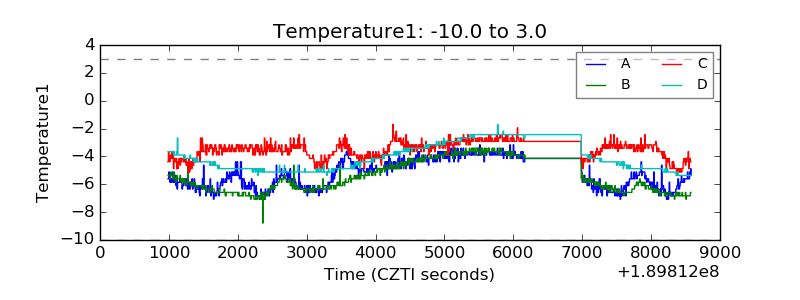 |
| Veto HV Monitor | 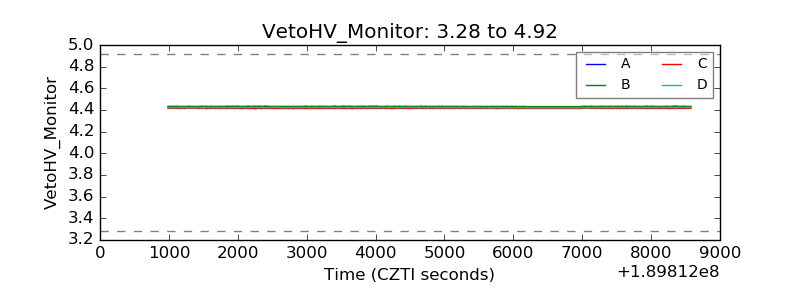 |
| Veto LLD | 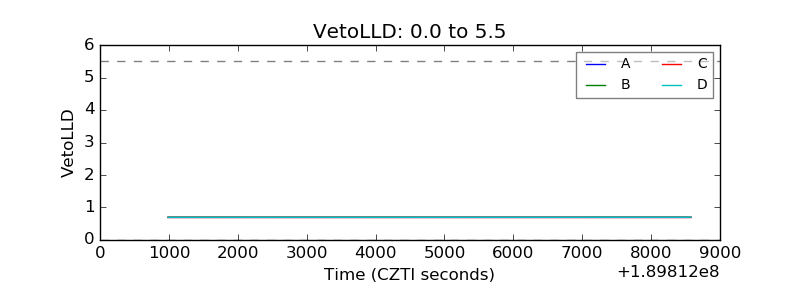 |
| Alpha Counter | 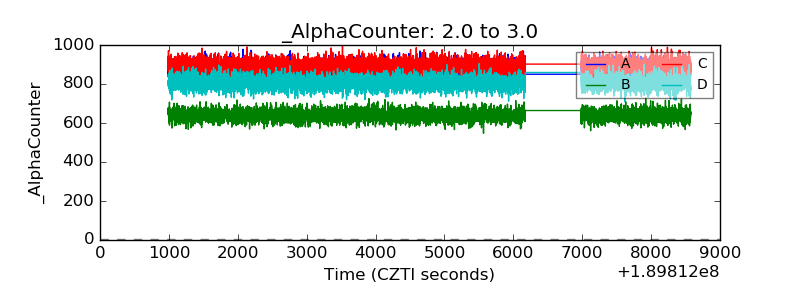 |
| _CPM_Rate | 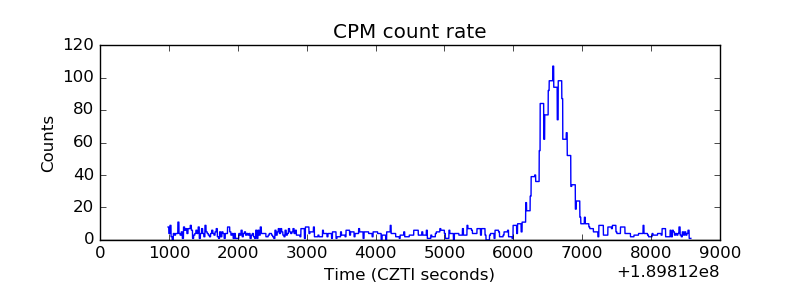 |
| CZT Counter | 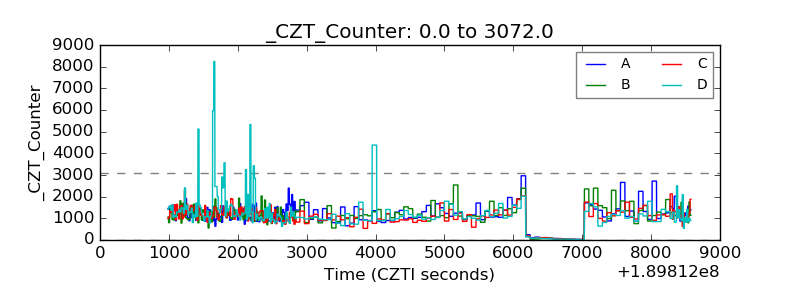 |
| +2.5 Volts monitor | 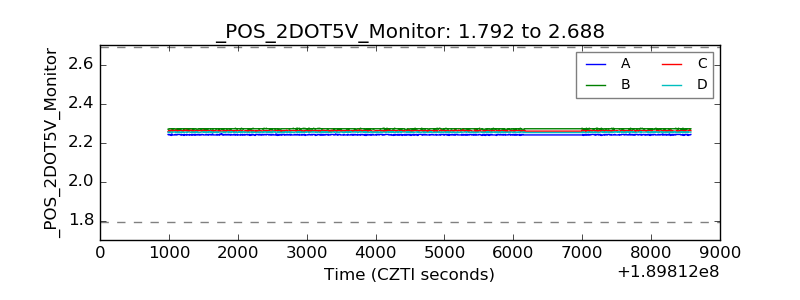 |
| +5 Volts monitor | 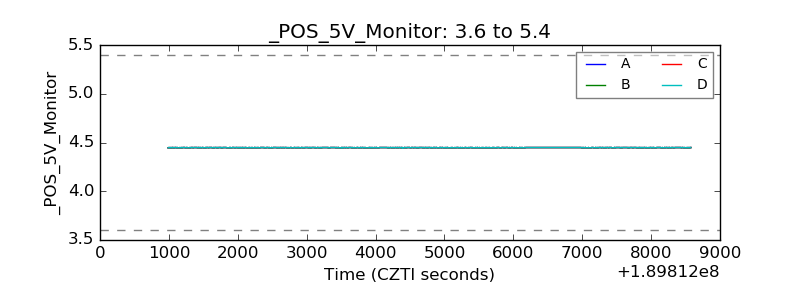 |
| _ROLL_ROT | 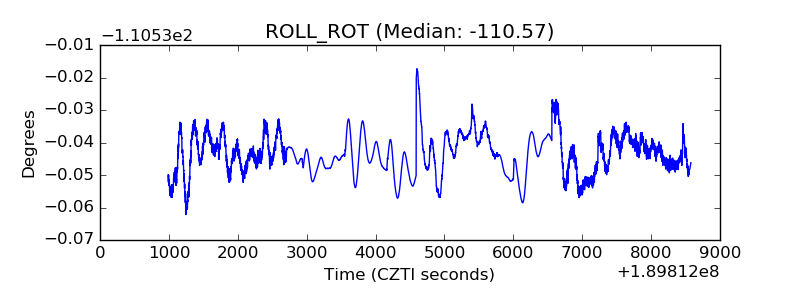 |
| _Roll_DEC | 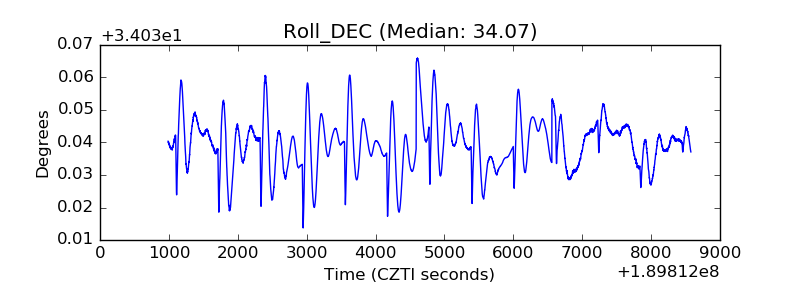 |
| _Roll_RA | 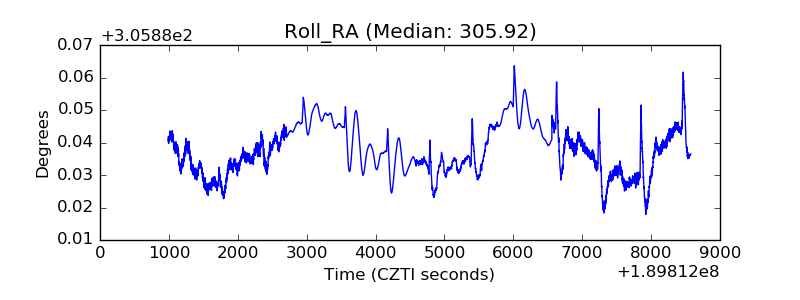 |
| Veto Counter | 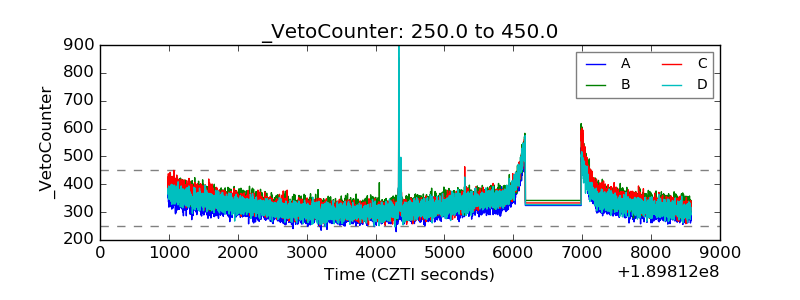 |