| Param | Original file | Final file |
|---|---|---|
| Filename | modeM0/AS1G02_010T01_9000000252cztM0_level2.fits | modeM0/AS1G02_010T01_9000000252cztM0_level2_quad_clean.evt |
| Size (bytes) | 797,097,600 | 932,235,840 |
| Size | 760.2 MB | 889.0 MB |
| Events in quadrant A | 4,660,102 | 5,774,173 |
| Events in quadrant B | 4,615,480 | 5,782,179 |
| Events in quadrant C | 4,579,686 | 5,522,066 |
| Events in quadrant D | 3,856,082 | 4,729,988 |
| Mode SS | |||
|---|---|---|---|
| Quadrant | BADHDUFLAG | Total packets | Discarded packets |
| A | 0 | 1910 | 0 |
| B | 0 | 1910 | 0 |
| C | 0 | 1910 | 0 |
| D | 0 | 1910 | 0 |
| Mode M9 | |||
|---|---|---|---|
| Quadrant | BADHDUFLAG | Total packets | Discarded packets |
| A | 0 | 126 | 0 |
| B | 0 | 126 | 0 |
| C | 0 | 126 | 0 |
| D | 0 | 126 | 0 |
| Mode M0 | |||
|---|---|---|---|
| Quadrant | BADHDUFLAG | Total packets | Discarded packets |
| A | 0 | 402583 | 0 |
| B | 0 | 415315 | 0 |
| C | 0 | 393502 | 0 |
| D | 0 | 421521 | 0 |
| Quadrant | Total seconds | Saturated seconds | Saturation percentage |
|---|---|---|---|
| A | 93611 | 564 | 0.602493% |
| B | 93805 | 618 | 0.658813% |
| C | 93890 | 399 | 0.424965% |
| D | 93813 | 4279 | 4.561202% |
Noise dominated data is calculated using 1-second bins in cleaned event files. If a bin has >2000 counts, and if more than 50% of those come from <1% of pixels, then it is considered to be noise-dominated and hence unusable.
| Quadrant | # 1 sec bins | Bins with >0 counts | Bins with >2000 counts | High rate bins dominated by noise | Noise dominated (total time) | Noise dominated (detector-on time) | Marked lightcurve |
|---|---|---|---|---|---|---|---|
| A | 113124 | 93601 | 0 | 0 | 0.00% | 0.00% |  |
| B | 113124 | 93798 | 0 | 0 | 0.00% | 0.00% |  |
| C | 113124 | 93882 | 0 | 0 | 0.00% | 0.00% | 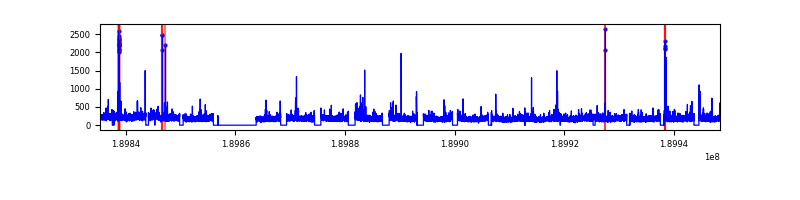 |
| D | 113124 | 93573 | 0 | 0 | 0.00% | 0.00% |  |
Top three noisy pixels from each quadrant. If the there are fewer than three noisy pixels in the level2.evt file, extra rows are filled as -1
| Pixel properties | Quadrant properties | ||||||
|---|---|---|---|---|---|---|---|
| Quadrant | DetID | PixID | Counts | Sigma | Mean | Median | Sigma |
| A | 0 | 29 | 4422 | 11.69 | 1202 | 1118 | 282.7 |
| A | 14 | 188 | 4263 | 11.12 | 1202 | 1118 | 282.7 |
| A | 7 | 110 | 4148 | 10.72 | 1202 | 1118 | 282.7 |
| B | 2 | 9 | 3658 | 11.18 | 1216 | 1151 | 224.3 |
| B | 14 | 254 | 3074 | 8.57 | 1216 | 1151 | 224.3 |
| B | 5 | 128 | 2994 | 8.22 | 1216 | 1151 | 224.3 |
| C | 12 | 241 | 3013 | 6.36 | 1209 | 1116 | 298.4 |
| C | 9 | 242 | 3010 | 6.35 | 1209 | 1116 | 298.4 |
| C | 2 | 127 | 3007 | 6.34 | 1209 | 1116 | 298.4 |
| D | 6 | 44 | 2777 | 6.74 | 1102 | 1009 | 262.1 |
| D | 15 | 30 | 2761 | 6.68 | 1102 | 1009 | 262.1 |
| D | 6 | 231 | 2742 | 6.61 | 1102 | 1009 | 262.1 |
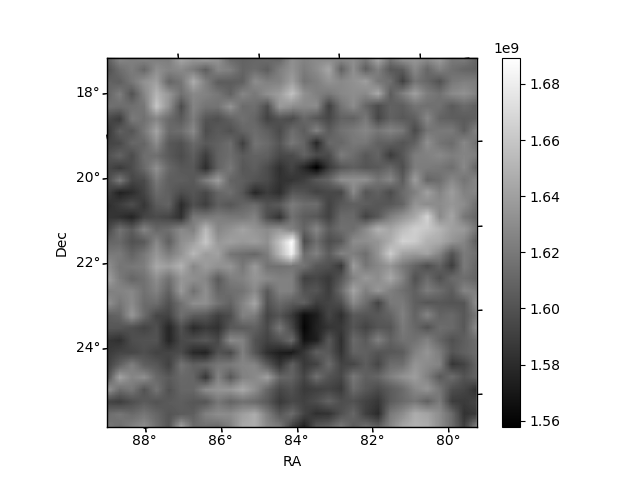
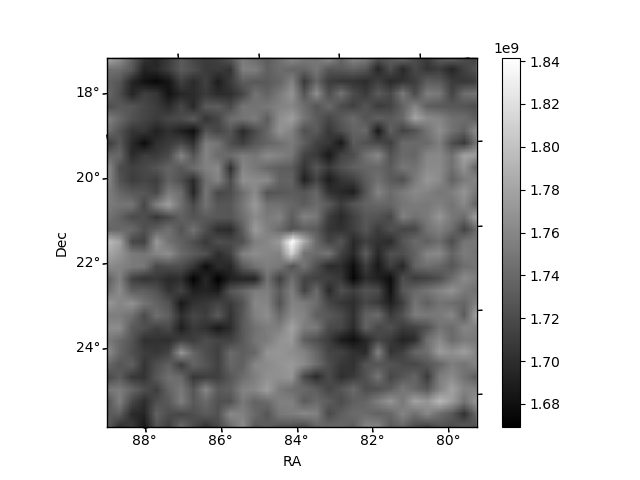
Histogram calculated using DETX and DETY for each event in the final _common_clean file
| Quadrant A |  |
 |
Quadrant B |
|---|---|---|---|
| Quadrant D | 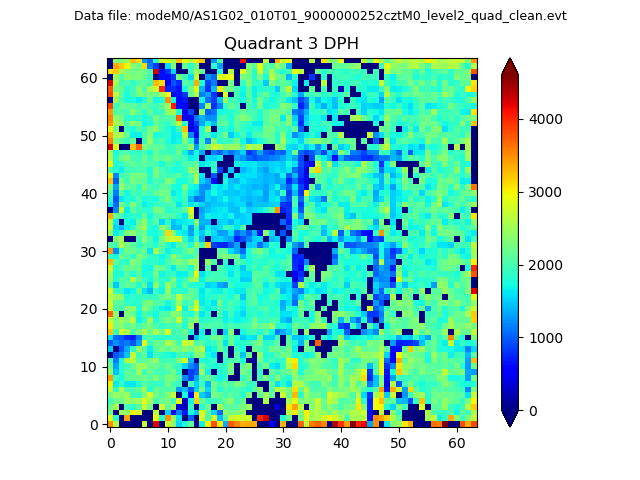 |
 |
Quadrant C |
| Plot type | Count rate plots | Images |
|---|---|---|
| Comparison with Poisson distribution Blue bars denote a histogram of data divided into 1 sec bins. Red curve is a Poisson curve with rate = median count rate of data. |
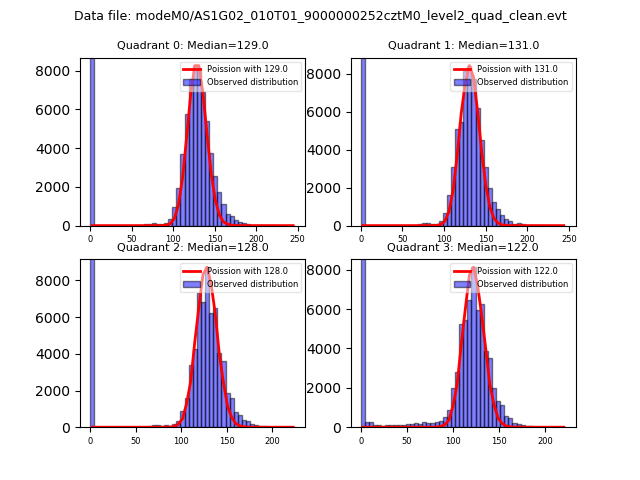 |
 |
| Quadrant-wise count rates Data is divided into 100 sec bins |
 |
|
| Module-wise count rates for Quadrant A Data is divided into 100 sec bins |
 |
 |
| Module-wise count rates for Quadrant B Data is divided into 100 sec bins |
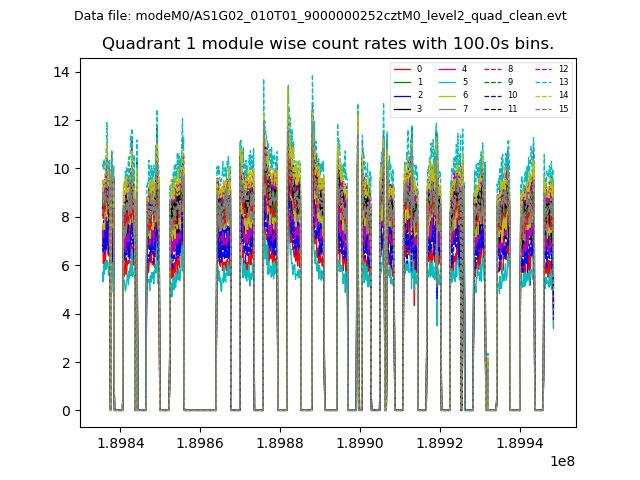 |
 |
| Module-wise count rates for Quadrant C Data is divided into 100 sec bins |
 |
 |
| Module-wise count rates for Quadrant D Data is divided into 100 sec bins |
 |
 |
| Parameter | Plot |
|---|---|
| CZT HV Monitor | 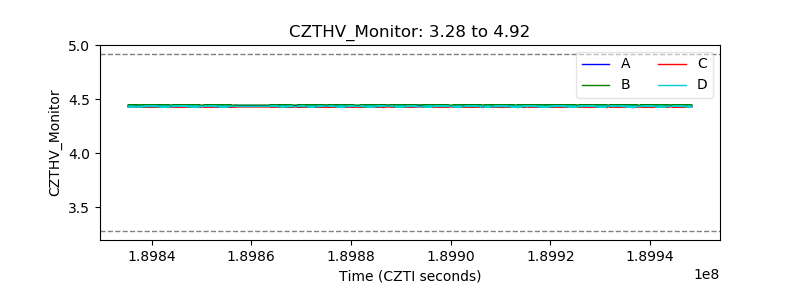 |
| D_VDD |  |
| Temperature 1 |  |
| Veto HV Monitor | 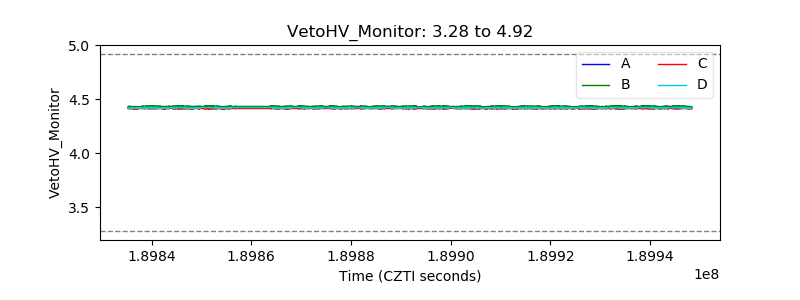 |
| Veto LLD |  |
| Alpha Counter |  |
| _CPM_Rate | 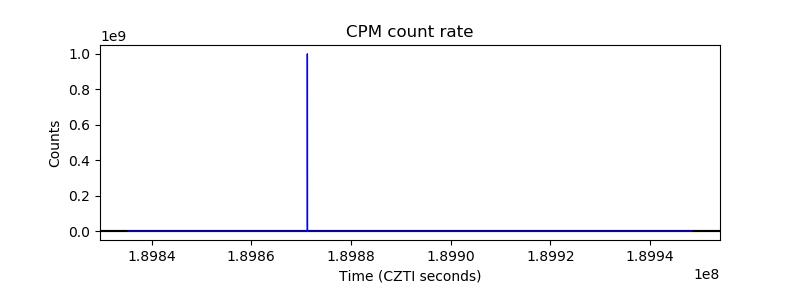 |
| CZT Counter | 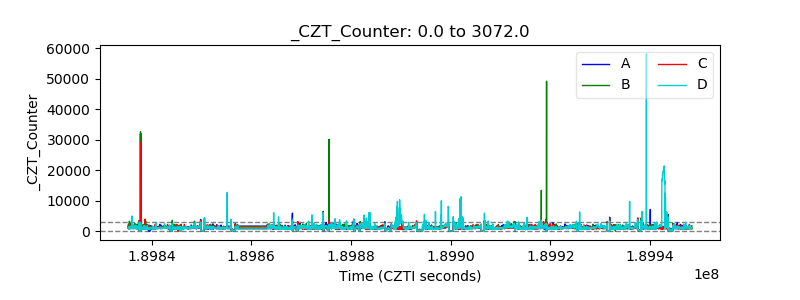 |
| +2.5 Volts monitor |  |
| +5 Volts monitor |  |
| _ROLL_ROT | 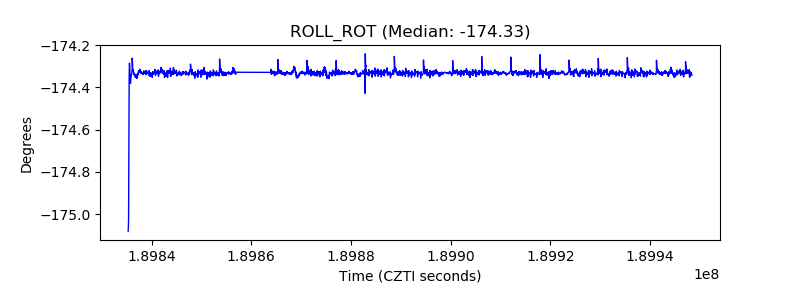 |
| _Roll_DEC | 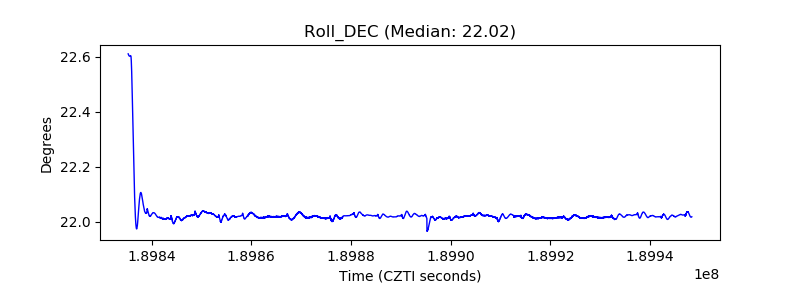 |
| _Roll_RA |  |
| Veto Counter |  |