| Param | Original file | Final file |
|---|---|---|
| Filename | modeM0/AS1G02_011T01_9000000254cztM0_level2.fits | modeM0/AS1G02_011T01_9000000254cztM0_level2_quad_clean.evt |
| Size (bytes) | 115,303,680 | 126,282,240 |
| Size | 110.0 MB | 120.4 MB |
| Events in quadrant A | 702,314 | 818,964 |
| Events in quadrant B | 686,552 | 819,100 |
| Events in quadrant C | 680,034 | 774,498 |
| Events in quadrant D | 523,146 | 512,649 |
| Mode M0 | |||
|---|---|---|---|
| Quadrant | BADHDUFLAG | Total packets | Discarded packets |
| A | 0 | 56747 | 0 |
| B | 0 | 58321 | 0 |
| C | 0 | 54955 | 0 |
| D | 0 | 76207 | 0 |
| Mode SS | |||
|---|---|---|---|
| Quadrant | BADHDUFLAG | Total packets | Discarded packets |
| A | 0 | 266 | 0 |
| B | 0 | 266 | 0 |
| C | 0 | 266 | 0 |
| D | 0 | 266 | 0 |
| Mode M9 | |||
|---|---|---|---|
| Quadrant | BADHDUFLAG | Total packets | Discarded packets |
| A | 0 | 33 | 0 |
| B | 0 | 33 | 0 |
| C | 0 | 33 | 0 |
| D | 0 | 33 | 0 |
| Quadrant | Total seconds | Saturated seconds | Saturation percentage |
|---|---|---|---|
| A | 13006 | 143 | 1.099493% |
| B | 13006 | 142 | 1.091804% |
| C | 13006 | 104 | 0.799631% |
| D | 13006 | 2790 | 21.451638% |
Noise dominated data is calculated using 1-second bins in cleaned event files. If a bin has >2000 counts, and if more than 50% of those come from <1% of pixels, then it is considered to be noise-dominated and hence unusable.
| Quadrant | # 1 sec bins | Bins with >0 counts | Bins with >2000 counts | High rate bins dominated by noise | Noise dominated (total time) | Noise dominated (detector-on time) | Marked lightcurve |
|---|---|---|---|---|---|---|---|
| A | 16366 | 13003 | 0 | 0 | 0.00% | 0.00% |  |
| B | 16366 | 13003 | 0 | 0 | 0.00% | 0.00% | 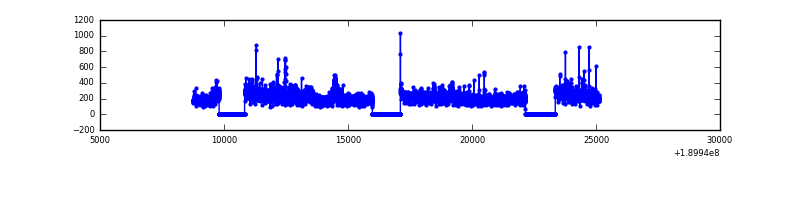 |
| C | 16366 | 13003 | 0 | 0 | 0.00% | 0.00% |  |
| D | 16366 | 12970 | 0 | 0 | 0.00% | 0.00% | 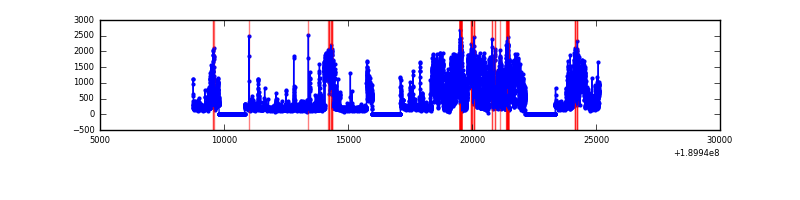 |
Top three noisy pixels from each quadrant. If the there are fewer than three noisy pixels in the level2.evt file, extra rows are filled as -1
| Pixel properties | Quadrant properties | ||||||
|---|---|---|---|---|---|---|---|
| Quadrant | DetID | PixID | Counts | Sigma | Mean | Median | Sigma |
| A | 14 | 188 | 659 | 10.95 | 182 | 170 | 44.7 |
| A | 0 | 29 | 637 | 10.46 | 182 | 170 | 44.7 |
| A | 7 | 110 | 579 | 9.16 | 182 | 170 | 44.7 |
| B | 2 | 9 | 531 | 10.12 | 181 | 172 | 35.5 |
| B | 5 | 232 | 450 | 7.84 | 181 | 172 | 35.5 |
| B | 5 | 225 | 447 | 7.75 | 181 | 172 | 35.5 |
| C | 9 | 242 | 461 | 6.28 | 179 | 166 | 47.0 |
| C | 1 | 81 | 446 | 5.96 | 179 | 166 | 47.0 |
| C | 12 | 241 | 432 | 5.66 | 179 | 166 | 47.0 |
| D | 6 | 231 | 398 | 7.12 | 149 | 137 | 36.7 |
| D | 11 | 82 | 395 | 7.03 | 149 | 137 | 36.7 |
| D | 15 | 30 | 370 | 6.35 | 149 | 137 | 36.7 |
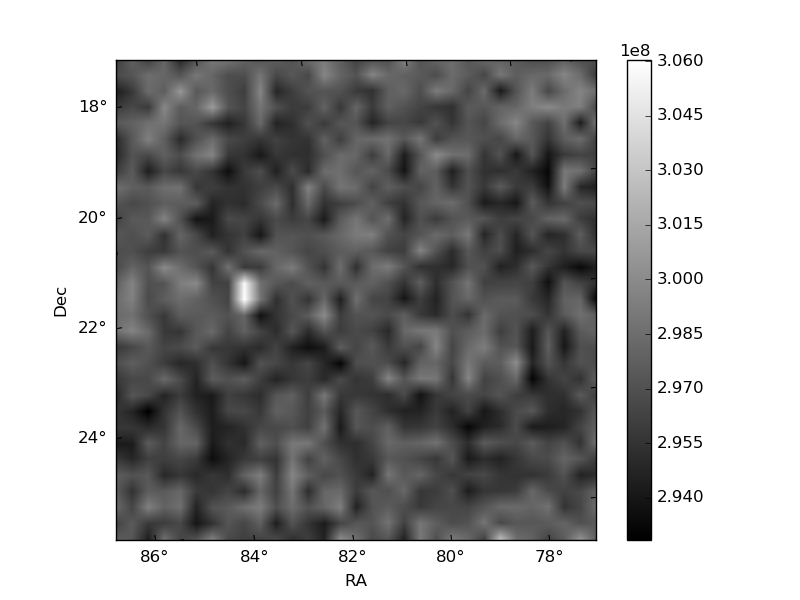
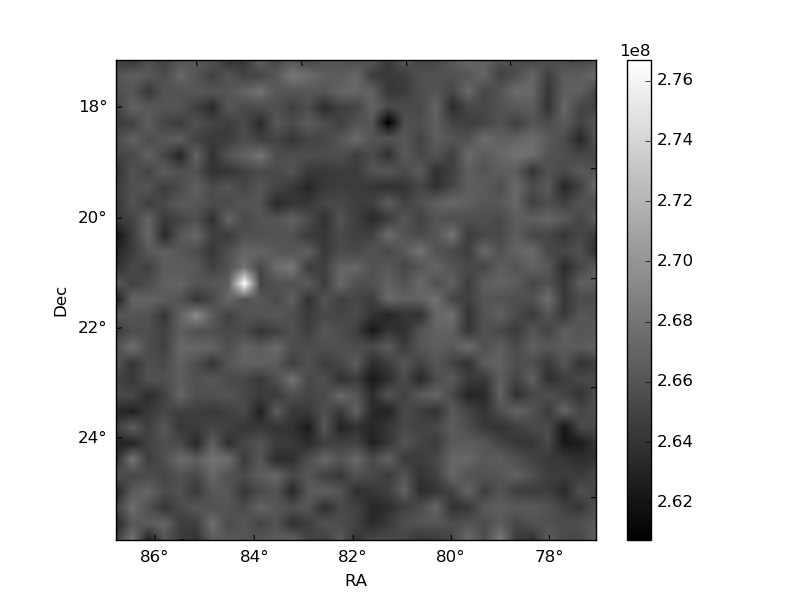
Histogram calculated using DETX and DETY for each event in the final _common_clean file
| Quadrant A | 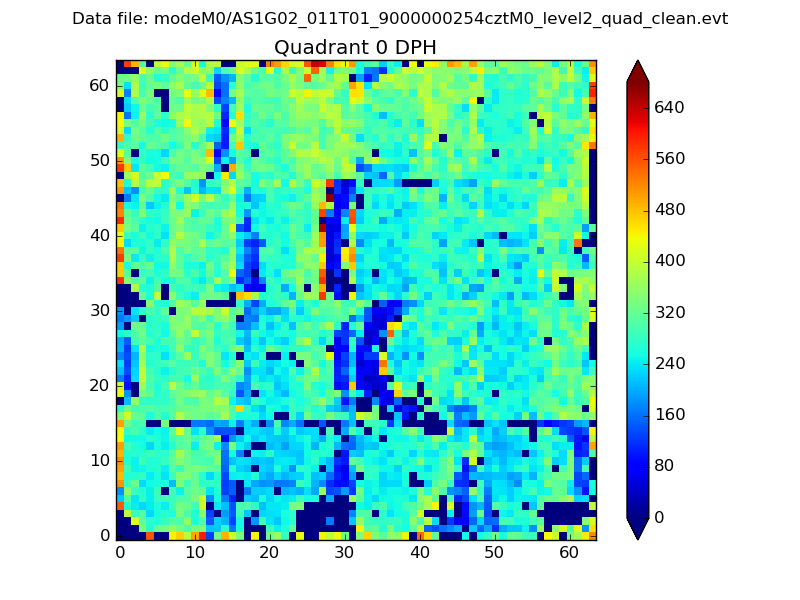 |
 |
Quadrant B |
|---|---|---|---|
| Quadrant D |  |
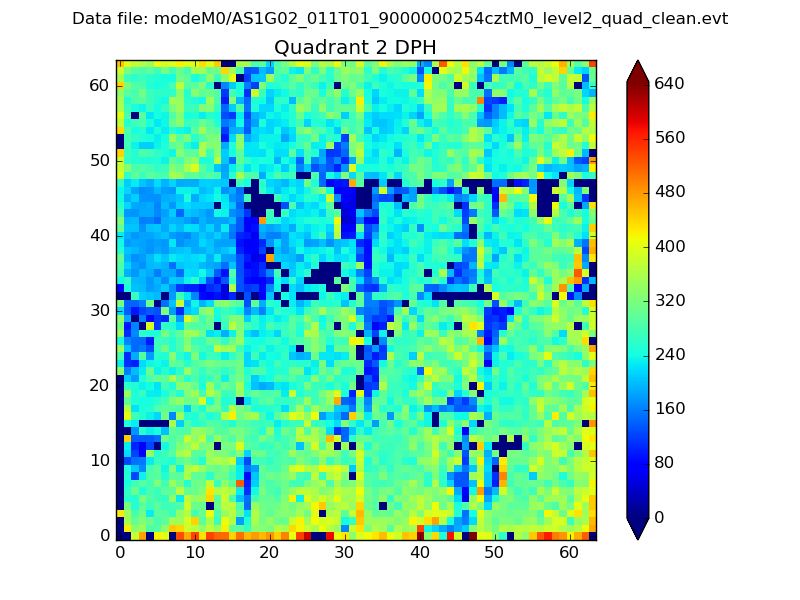 |
Quadrant C |
| Plot type | Count rate plots | Images |
|---|---|---|
| Comparison with Poisson distribution Blue bars denote a histogram of data divided into 1 sec bins. Red curve is a Poisson curve with rate = median count rate of data. |
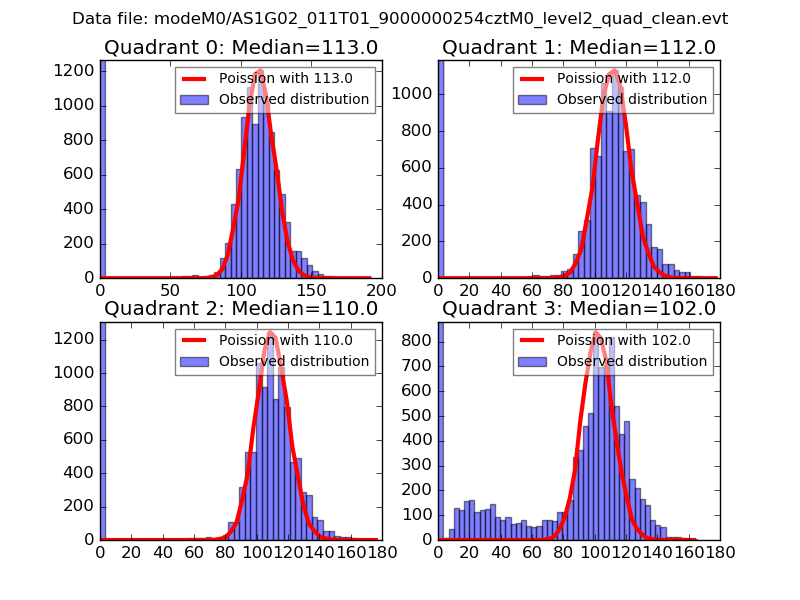 |
 |
| Quadrant-wise count rates Data is divided into 100 sec bins |
 |
|
| Module-wise count rates for Quadrant A Data is divided into 100 sec bins |
 |
 |
| Module-wise count rates for Quadrant B Data is divided into 100 sec bins |
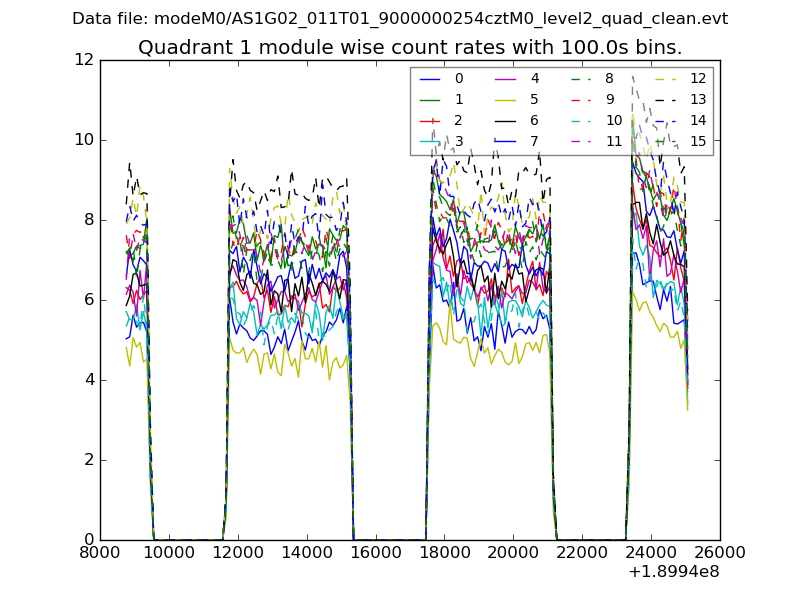 |
 |
| Module-wise count rates for Quadrant C Data is divided into 100 sec bins |
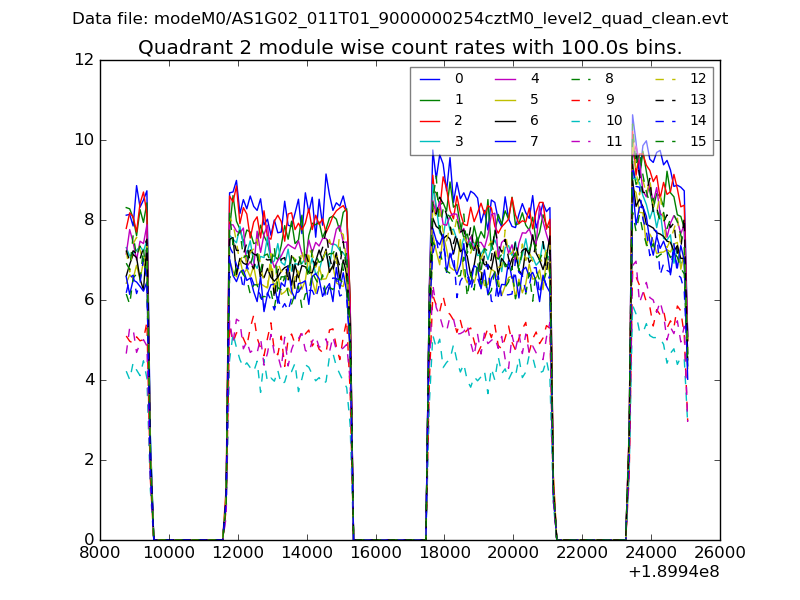 |
 |
| Module-wise count rates for Quadrant D Data is divided into 100 sec bins |
 |
 |
| Parameter | Plot |
|---|---|
| CZT HV Monitor |  |
| D_VDD |  |
| Temperature 1 |  |
| Veto HV Monitor |  |
| Veto LLD | 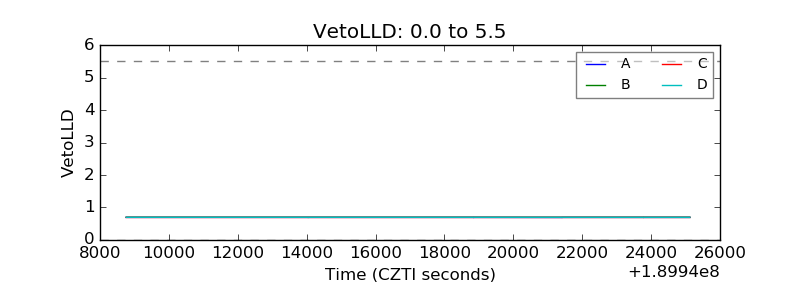 |
| Alpha Counter |  |
| _CPM_Rate | 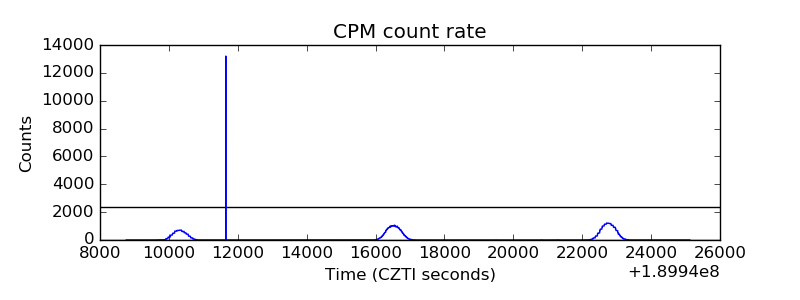 |
| CZT Counter |  |
| +2.5 Volts monitor | 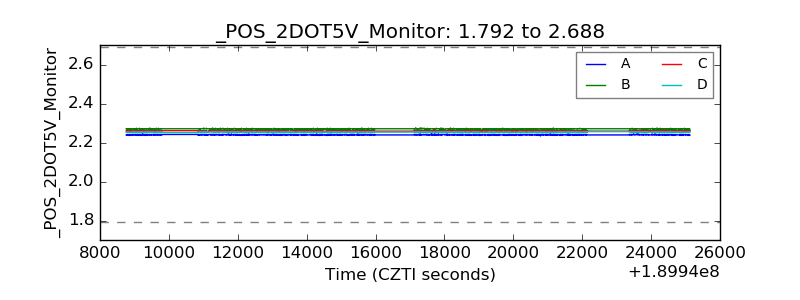 |
| +5 Volts monitor |  |
| _ROLL_ROT |  |
| _Roll_DEC |  |
| _Roll_RA | 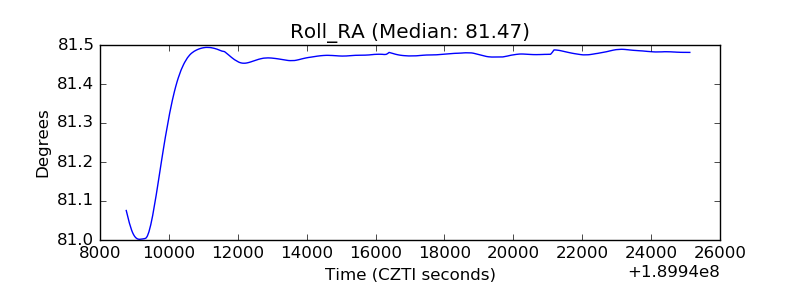 |
| Veto Counter |  |