| Param | Original file | Final file |
|---|---|---|
| Filename | modeM0/AS1G02_012T01_9000000256cztM0_level2.fits | modeM0/AS1G02_012T01_9000000256cztM0_level2_quad_clean.evt |
| Size (bytes) | 90,017,280 | 77,863,680 |
| Size | 85.8 MB | 74.3 MB |
| Events in quadrant A | 532,334 | 436,687 |
| Events in quadrant B | 527,128 | 437,853 |
| Events in quadrant C | 520,978 | 411,006 |
| Events in quadrant D | 453,212 | 379,113 |
| Mode M0 | |||
|---|---|---|---|
| Quadrant | BADHDUFLAG | Total packets | Discarded packets |
| A | 0 | 42610 | 0 |
| B | 0 | 43681 | 0 |
| C | 0 | 41746 | 0 |
| D | 0 | 43883 | 0 |
| Mode SS | |||
|---|---|---|---|
| Quadrant | BADHDUFLAG | Total packets | Discarded packets |
| A | 0 | 204 | 0 |
| B | 0 | 204 | 0 |
| C | 0 | 204 | 0 |
| D | 0 | 204 | 0 |
| Mode M9 | |||
|---|---|---|---|
| Quadrant | BADHDUFLAG | Total packets | Discarded packets |
| A | 0 | 24 | 0 |
| B | 0 | 24 | 0 |
| C | 0 | 24 | 0 |
| D | 0 | 24 | 0 |
| Quadrant | Total seconds | Saturated seconds | Saturation percentage |
|---|---|---|---|
| A | 9991 | 163 | 1.631468% |
| B | 9991 | 144 | 1.441297% |
| C | 9991 | 124 | 1.241117% |
| D | 9991 | 268 | 2.682414% |
Noise dominated data is calculated using 1-second bins in cleaned event files. If a bin has >2000 counts, and if more than 50% of those come from <1% of pixels, then it is considered to be noise-dominated and hence unusable.
| Quadrant | # 1 sec bins | Bins with >0 counts | Bins with >2000 counts | High rate bins dominated by noise | Noise dominated (total time) | Noise dominated (detector-on time) | Marked lightcurve |
|---|---|---|---|---|---|---|---|
| A | 12361 | 9989 | 0 | 0 | 0.00% | 0.00% | 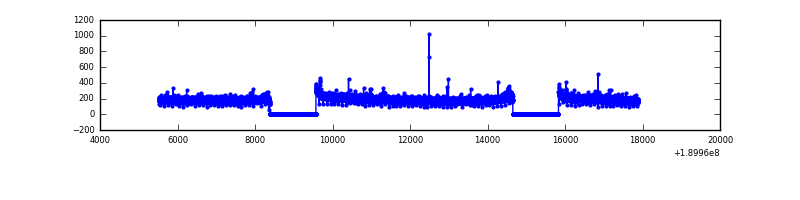 |
| B | 12361 | 9990 | 0 | 0 | 0.00% | 0.00% | 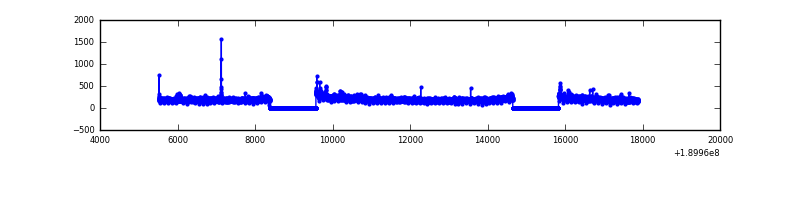 |
| C | 12361 | 9990 | 0 | 0 | 0.00% | 0.00% |  |
| D | 12361 | 9989 | 0 | 0 | 0.00% | 0.00% |  |
Top three noisy pixels from each quadrant. If the there are fewer than three noisy pixels in the level2.evt file, extra rows are filled as -1
| Pixel properties | Quadrant properties | ||||||
|---|---|---|---|---|---|---|---|
| Quadrant | DetID | PixID | Counts | Sigma | Mean | Median | Sigma |
| A | 0 | 29 | 460 | 9.67 | 137 | 129 | 34.2 |
| A | 7 | 110 | 441 | 9.12 | 137 | 129 | 34.2 |
| A | 14 | 30 | 415 | 8.36 | 137 | 129 | 34.2 |
| B | 2 | 9 | 412 | 10.05 | 139 | 133 | 27.8 |
| B | 5 | 128 | 330 | 7.1 | 139 | 133 | 27.8 |
| B | 14 | 254 | 328 | 7.03 | 139 | 133 | 27.8 |
| C | 1 | 225 | 333 | 5.76 | 137 | 127 | 35.8 |
| C | 3 | 235 | 331 | 5.7 | 137 | 127 | 35.8 |
| C | 9 | 242 | 330 | 5.68 | 137 | 127 | 35.8 |
| D | 6 | 231 | 339 | 7.02 | 128 | 118 | 31.5 |
| D | 15 | 30 | 338 | 6.99 | 128 | 118 | 31.5 |
| D | 11 | 82 | 331 | 6.77 | 128 | 118 | 31.5 |
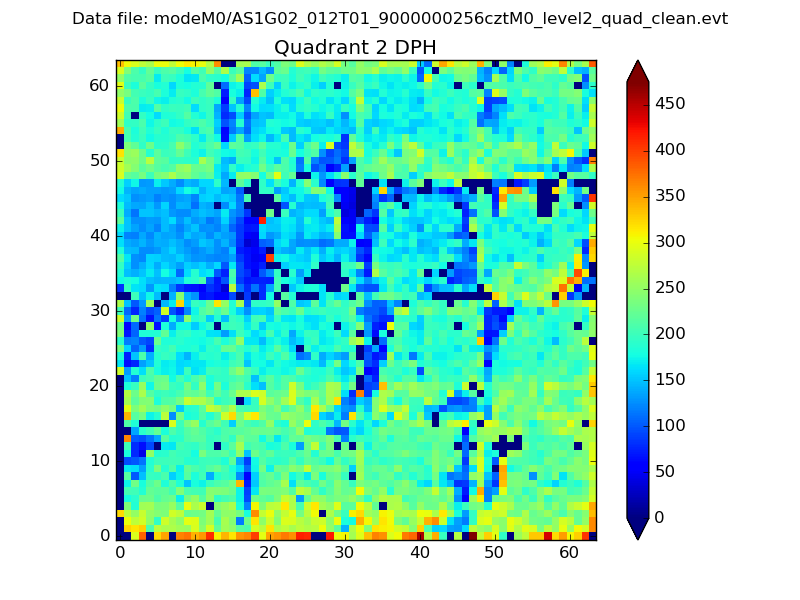
Histogram calculated using DETX and DETY for each event in the final _common_clean file
| Quadrant A | 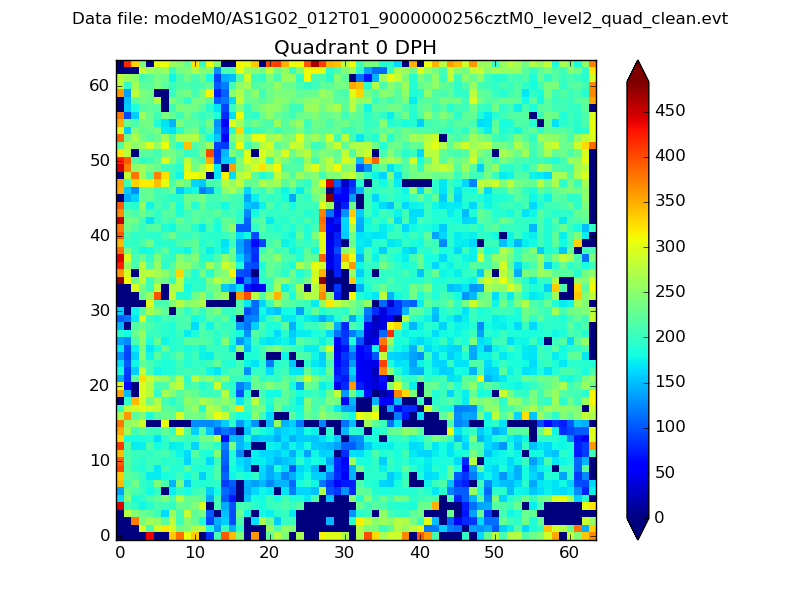 |
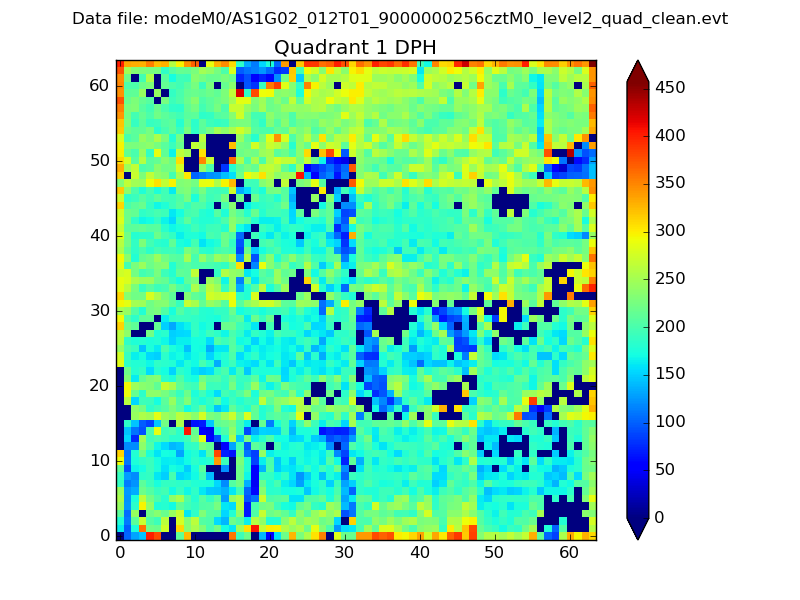 |
Quadrant B |
|---|---|---|---|
| Quadrant D | 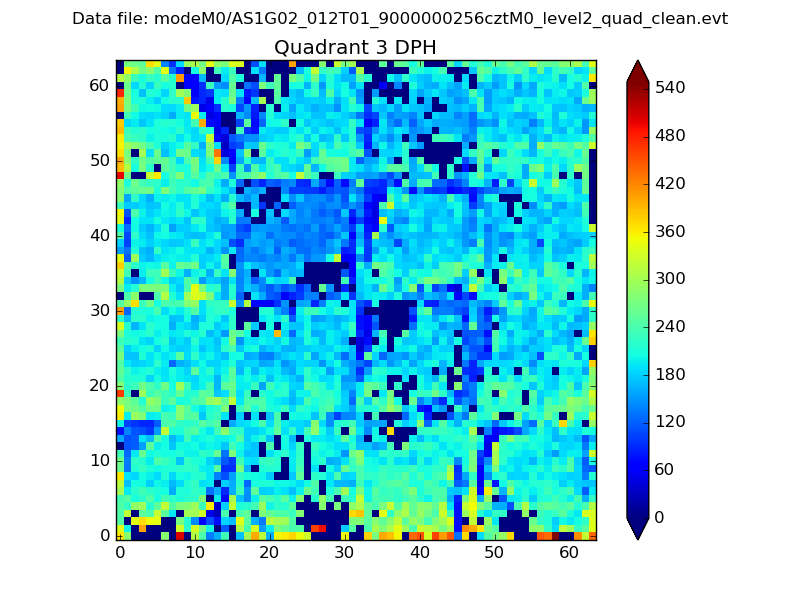 |
 |
Quadrant C |
| Plot type | Count rate plots | Images |
|---|---|---|
| Comparison with Poisson distribution Blue bars denote a histogram of data divided into 1 sec bins. Red curve is a Poisson curve with rate = median count rate of data. |
 |
 |
| Quadrant-wise count rates Data is divided into 100 sec bins |
 |
|
| Module-wise count rates for Quadrant A Data is divided into 100 sec bins |
 |
 |
| Module-wise count rates for Quadrant B Data is divided into 100 sec bins |
 |
 |
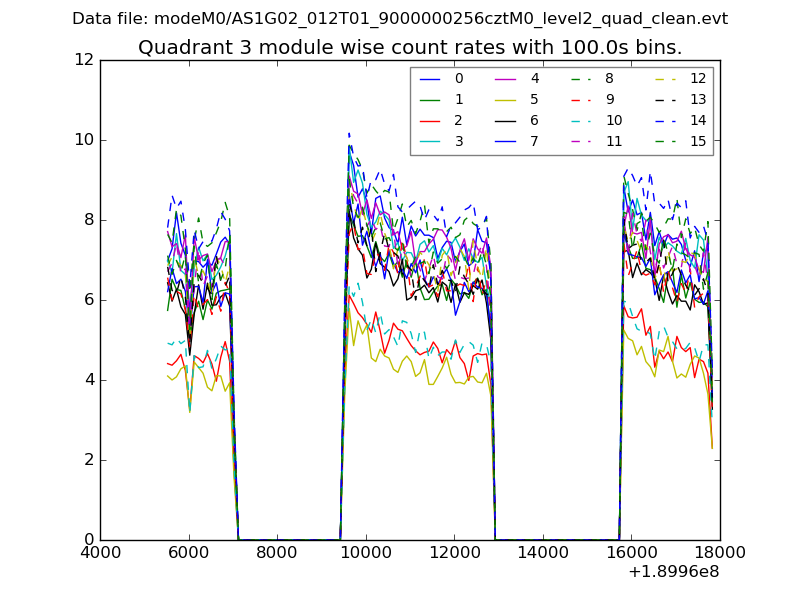
| Module-wise count rates for Quadrant C Data is divided into 100 sec bins |
 |
 |
| Module-wise count rates for Quadrant D Data is divided into 100 sec bins |
 |
 |
| Parameter | Plot |
|---|---|
| CZT HV Monitor |  |
| D_VDD | 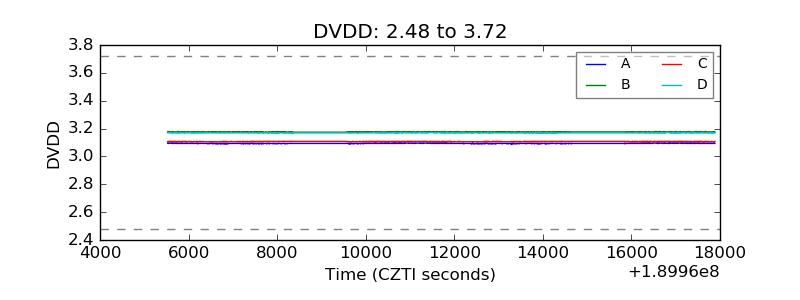 |
| Temperature 1 |  |
| Veto HV Monitor | 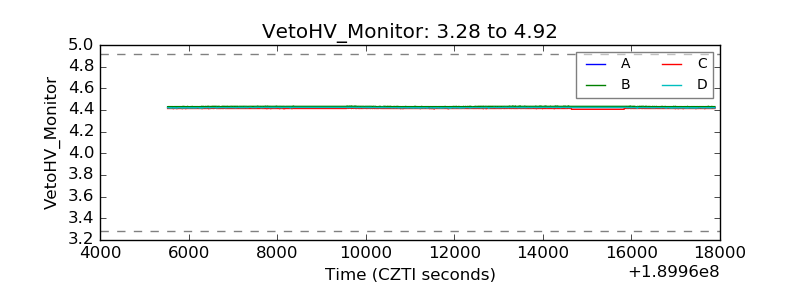 |
| Veto LLD |  |
| Alpha Counter |  |
| _CPM_Rate | 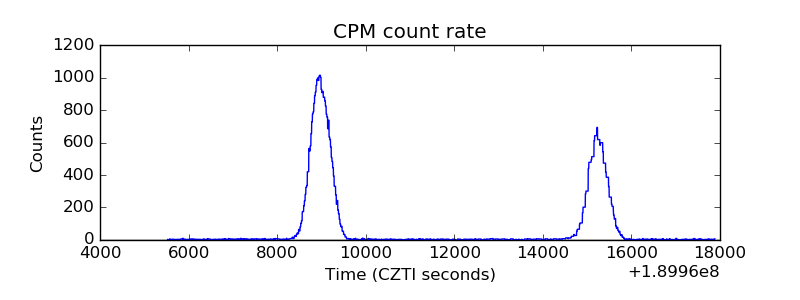 |
| CZT Counter |  |
| +2.5 Volts monitor |  |
| +5 Volts monitor |  |
| _ROLL_ROT |  |
| _Roll_DEC |  |
| _Roll_RA | 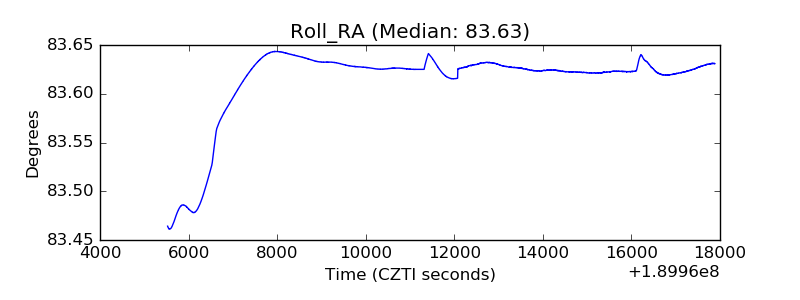 |
| Veto Counter | 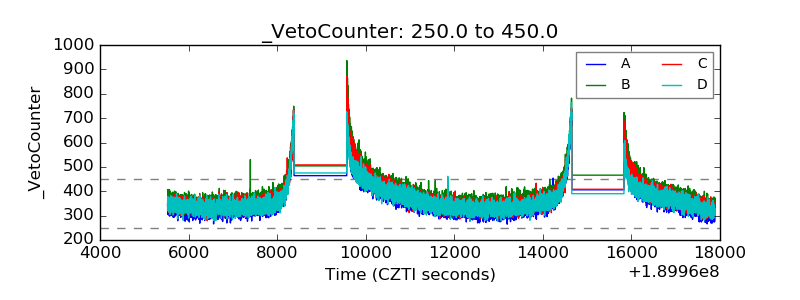 |