| Param | Original file | Final file |
|---|---|---|
| Filename | modeM0/AS1G02_016T01_9000000258cztM0_level2.fits | modeM0/AS1G02_016T01_9000000258cztM0_level2_quad_clean.evt |
| Size (bytes) | 540,858,240 | 618,600,960 |
| Size | 515.8 MB | 589.9 MB |
| Events in quadrant A | 3,119,754 | 3,740,932 |
| Events in quadrant B | 3,115,584 | 3,778,398 |
| Events in quadrant C | 3,108,260 | 3,606,143 |
| Events in quadrant D | 2,649,760 | 3,224,514 |
| Mode M0 | |||
|---|---|---|---|
| Quadrant | BADHDUFLAG | Total packets | Discarded packets |
| A | 0 | 287158 | 0 |
| B | 0 | 280447 | 0 |
| C | 0 | 266070 | 0 |
| D | 0 | 291269 | 0 |
| Mode SS | |||
|---|---|---|---|
| Quadrant | BADHDUFLAG | Total packets | Discarded packets |
| A | 0 | 1302 | 0 |
| B | 0 | 1302 | 0 |
| C | 0 | 1302 | 0 |
| D | 0 | 1302 | 0 |
| Mode M9 | |||
|---|---|---|---|
| Quadrant | BADHDUFLAG | Total packets | Discarded packets |
| A | 0 | 86 | 0 |
| B | 0 | 86 | 0 |
| C | 0 | 86 | 0 |
| D | 0 | 86 | 0 |
| Quadrant | Total seconds | Saturated seconds | Saturation percentage |
|---|---|---|---|
| A | 63934 | 847 | 1.324804% |
| B | 63934 | 300 | 0.469234% |
| C | 63934 | 233 | 0.364438% |
| D | 63934 | 2417 | 3.780461% |
Noise dominated data is calculated using 1-second bins in cleaned event files. If a bin has >2000 counts, and if more than 50% of those come from <1% of pixels, then it is considered to be noise-dominated and hence unusable.
| Quadrant | # 1 sec bins | Bins with >0 counts | Bins with >2000 counts | High rate bins dominated by noise | Noise dominated (total time) | Noise dominated (detector-on time) | Marked lightcurve |
|---|---|---|---|---|---|---|---|
| A | 72581 | 63930 | 0 | 0 | 0.00% | 0.00% |  |
| B | 72581 | 63933 | 0 | 0 | 0.00% | 0.00% |  |
| C | 72581 | 63931 | 0 | 0 | 0.00% | 0.00% |  |
| D | 72580 | 63911 | 0 | 0 | 0.00% | 0.00% |  |
Top three noisy pixels from each quadrant. If the there are fewer than three noisy pixels in the level2.evt file, extra rows are filled as -1
| Pixel properties | Quadrant properties | ||||||
|---|---|---|---|---|---|---|---|
| Quadrant | DetID | PixID | Counts | Sigma | Mean | Median | Sigma |
| A | 0 | 29 | 2925 | 11.29 | 806 | 750 | 192.7 |
| A | 7 | 110 | 2874 | 11.02 | 806 | 750 | 192.7 |
| A | 14 | 188 | 2872 | 11.01 | 806 | 750 | 192.7 |
| B | 2 | 9 | 2525 | 11.56 | 820 | 776 | 151.4 |
| B | 5 | 128 | 2065 | 8.52 | 820 | 776 | 151.4 |
| B | 14 | 254 | 2045 | 8.38 | 820 | 776 | 151.4 |
| C | 1 | 81 | 2135 | 6.82 | 819 | 757 | 201.9 |
| C | 12 | 241 | 2086 | 6.58 | 819 | 757 | 201.9 |
| C | 3 | 235 | 2080 | 6.55 | 819 | 757 | 201.9 |
| D | 11 | 82 | 1931 | 6.93 | 753 | 691 | 178.9 |
| D | 6 | 231 | 1897 | 6.74 | 753 | 691 | 178.9 |
| D | 6 | 44 | 1887 | 6.69 | 753 | 691 | 178.9 |
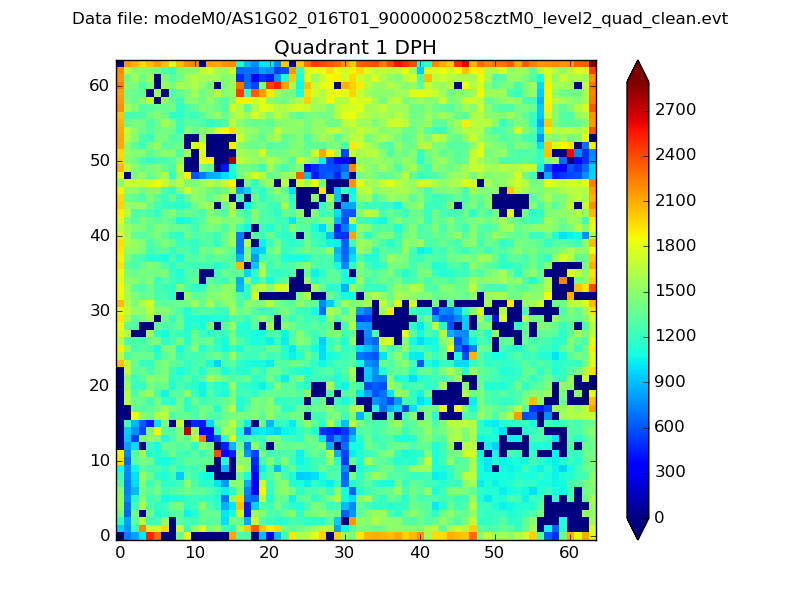
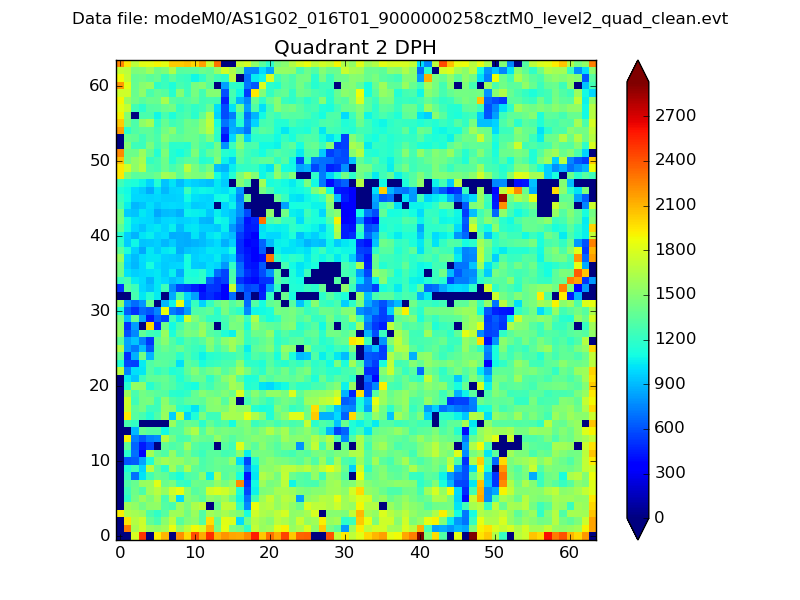
Histogram calculated using DETX and DETY for each event in the final _common_clean file
| Quadrant A |  |
 |
Quadrant B |
|---|---|---|---|
| Quadrant D |  |
 |
Quadrant C |
| Plot type | Count rate plots | Images |
|---|---|---|
| Comparison with Poisson distribution Blue bars denote a histogram of data divided into 1 sec bins. Red curve is a Poisson curve with rate = median count rate of data. |
 |
 |
| Quadrant-wise count rates Data is divided into 100 sec bins |
 |
|
| Module-wise count rates for Quadrant A Data is divided into 100 sec bins |
 |
 |
| Module-wise count rates for Quadrant B Data is divided into 100 sec bins |
 |
 |
| Module-wise count rates for Quadrant C Data is divided into 100 sec bins |
 |
 |
| Module-wise count rates for Quadrant D Data is divided into 100 sec bins |
 |
 |
| Parameter | Plot |
|---|---|
| CZT HV Monitor |  |
| D_VDD |  |
| Temperature 1 |  |
| Veto HV Monitor |  |
| Veto LLD |  |
| Alpha Counter |  |
| _CPM_Rate |  |
| CZT Counter |  |
| +2.5 Volts monitor |  |
| +5 Volts monitor |  |
| _ROLL_ROT |  |
| _Roll_DEC |  |
| _Roll_RA |  |
| Veto Counter |  |