| Param | Original file | Final file |
|---|---|---|
| Filename | modeM0/AS1G02_020T01_9000000260cztM0_level2.fits | modeM0/AS1G02_020T01_9000000260cztM0_level2_quad_clean.evt |
| Size (bytes) | 789,413,760 | 952,200,000 |
| Size | 752.8 MB | 908.1 MB |
| Events in quadrant A | 4,528,344 | 5,859,312 |
| Events in quadrant B | 4,546,698 | 5,965,662 |
| Events in quadrant C | 4,529,688 | 5,618,334 |
| Events in quadrant D | 3,776,184 | 4,873,491 |
| Mode SS | |||
|---|---|---|---|
| Quadrant | BADHDUFLAG | Total packets | Discarded packets |
| A | 0 | 1938 | 0 |
| B | 0 | 1940 | 0 |
| C | 0 | 1938 | 0 |
| D | 0 | 1940 | 0 |
| Mode M0 | |||
|---|---|---|---|
| Quadrant | BADHDUFLAG | Total packets | Discarded packets |
| A | 0 | 418518 | 0 |
| B | 0 | 417218 | 0 |
| C | 0 | 397038 | 0 |
| D | 0 | 437777 | 0 |
| Mode M9 | |||
|---|---|---|---|
| Quadrant | BADHDUFLAG | Total packets | Discarded packets |
| A | 0 | 127 | 0 |
| B | 0 | 124 | 0 |
| C | 0 | 127 | 0 |
| D | 0 | 126 | 0 |
| Quadrant | Total seconds | Saturated seconds | Saturation percentage |
|---|---|---|---|
| A | 95124 | 1805 | 1.897523% |
| B | 95129 | 353 | 0.371075% |
| C | 95137 | 572 | 0.601238% |
| D | 95145 | 6552 | 6.886331% |
Noise dominated data is calculated using 1-second bins in cleaned event files. If a bin has >2000 counts, and if more than 50% of those come from <1% of pixels, then it is considered to be noise-dominated and hence unusable.
| Quadrant | # 1 sec bins | Bins with >0 counts | Bins with >2000 counts | High rate bins dominated by noise | Noise dominated (total time) | Noise dominated (detector-on time) | Marked lightcurve |
|---|---|---|---|---|---|---|---|
| A | 127352 | 95197 | 0 | 0 | 0.00% | 0.00% | 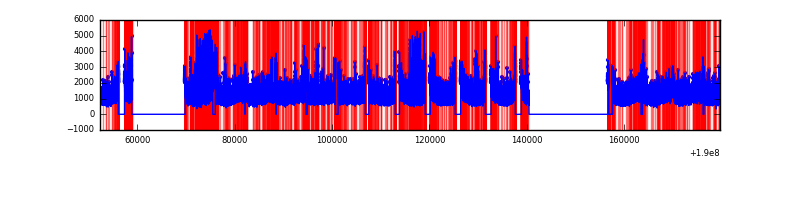 |
| B | 127352 | 95225 | 0 | 0 | 0.00% | 0.00% | 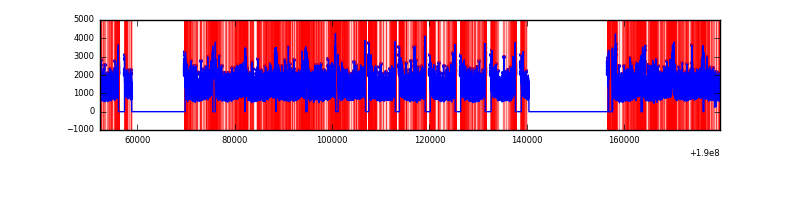 |
| C | 127352 | 95227 | 0 | 0 | 0.00% | 0.00% | 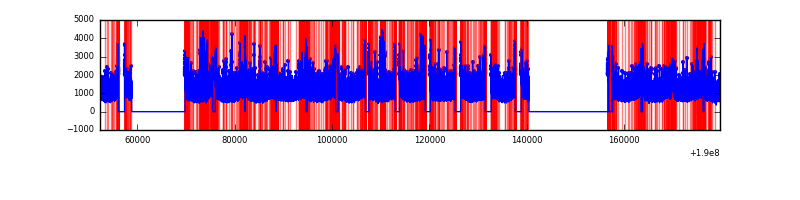 |
| D | 127352 | 94779 | 0 | 0 | 0.00% | 0.00% | 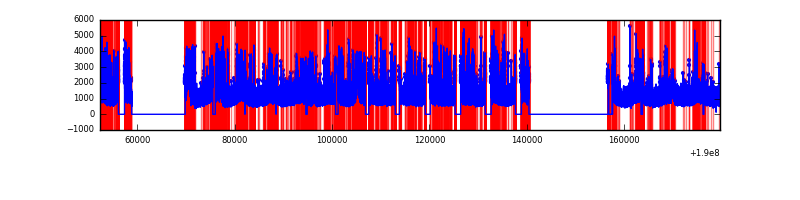 |
Top three noisy pixels from each quadrant. If the there are fewer than three noisy pixels in the level2.evt file, extra rows are filled as -1
| Pixel properties | Quadrant properties | ||||||
|---|---|---|---|---|---|---|---|
| Quadrant | DetID | PixID | Counts | Sigma | Mean | Median | Sigma |
| A | 0 | 29 | 4147 | 11.16 | 1172 | 1094 | 273.6 |
| A | 7 | 110 | 3961 | 10.48 | 1172 | 1094 | 273.6 |
| A | 9 | 19 | 3295 | 8.04 | 1172 | 1094 | 273.6 |
| B | 2 | 9 | 3542 | 11.01 | 1202 | 1141 | 218.1 |
| B | 5 | 128 | 3007 | 8.55 | 1202 | 1141 | 218.1 |
| B | 14 | 254 | 2952 | 8.3 | 1202 | 1141 | 218.1 |
| C | 12 | 241 | 3034 | 6.67 | 1195 | 1105 | 289.1 |
| C | 9 | 242 | 2979 | 6.48 | 1195 | 1105 | 289.1 |
| C | 1 | 81 | 2930 | 6.31 | 1195 | 1105 | 289.1 |
| D | 6 | 44 | 2736 | 6.91 | 1078 | 988 | 253.1 |
| D | 10 | 189 | 2724 | 6.86 | 1078 | 988 | 253.1 |
| D | 6 | 231 | 2664 | 6.62 | 1078 | 988 | 253.1 |
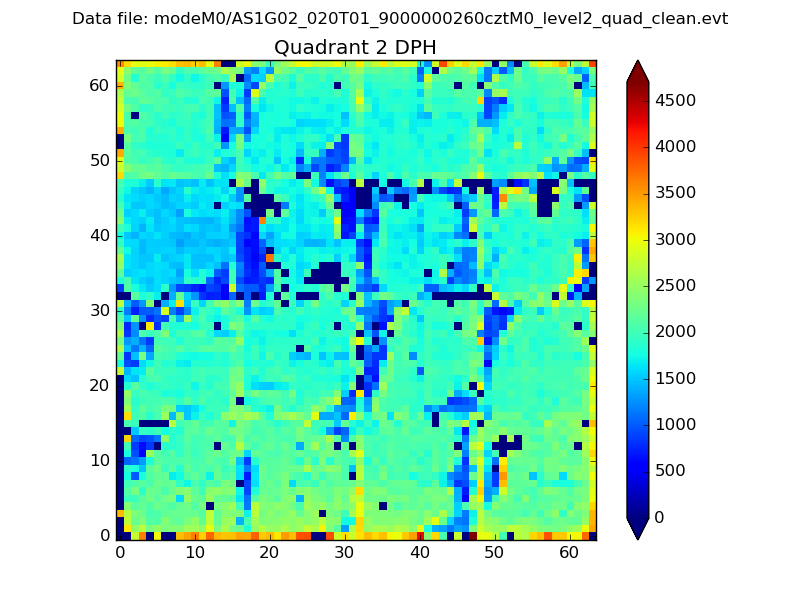
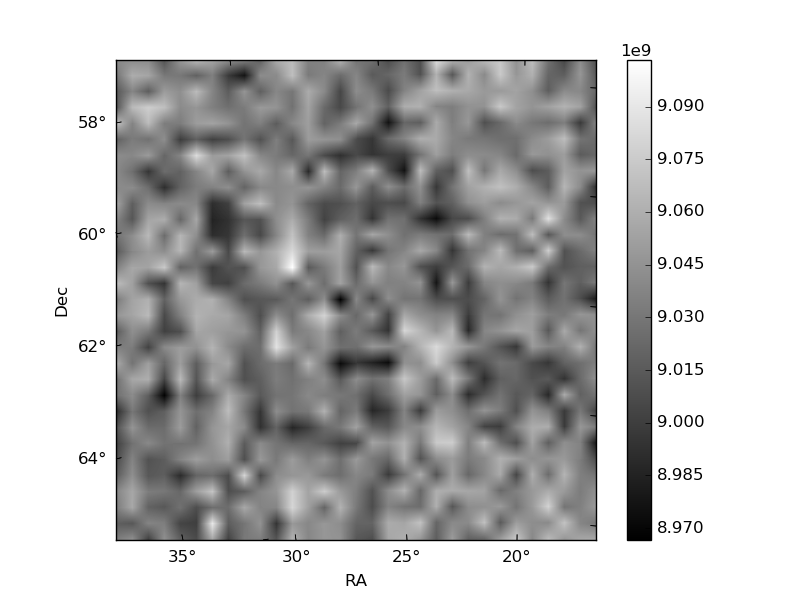
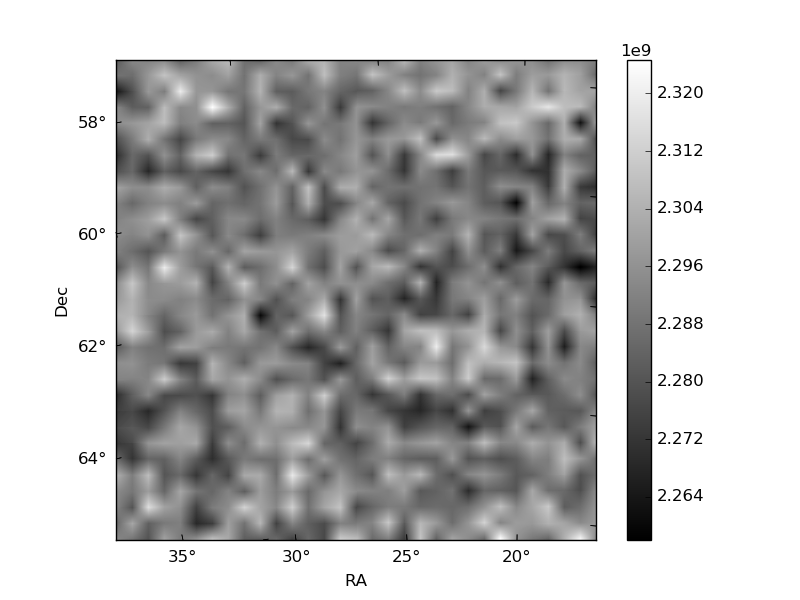
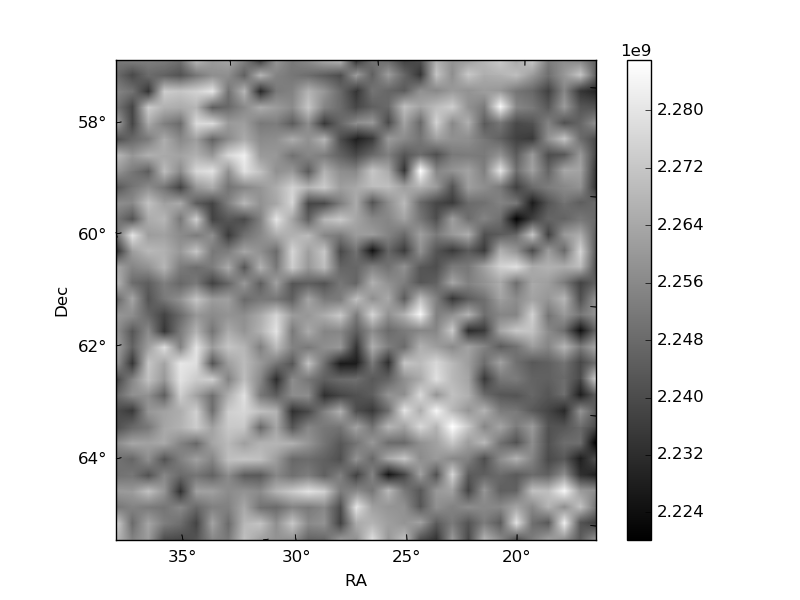
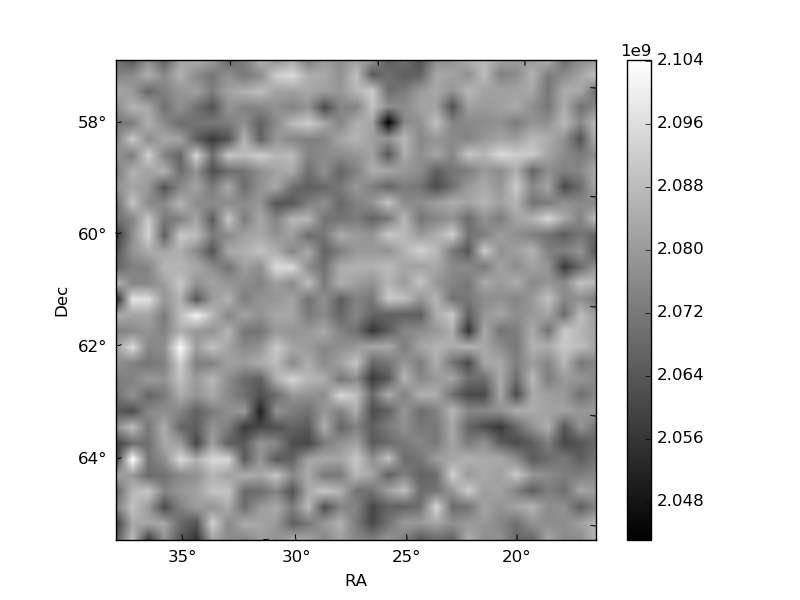
Histogram calculated using DETX and DETY for each event in the final _common_clean file
| Quadrant A | 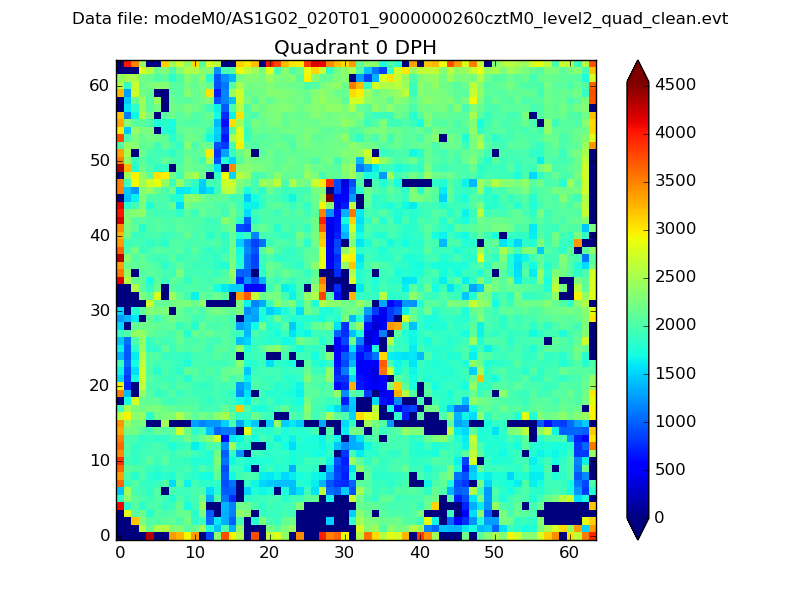 |
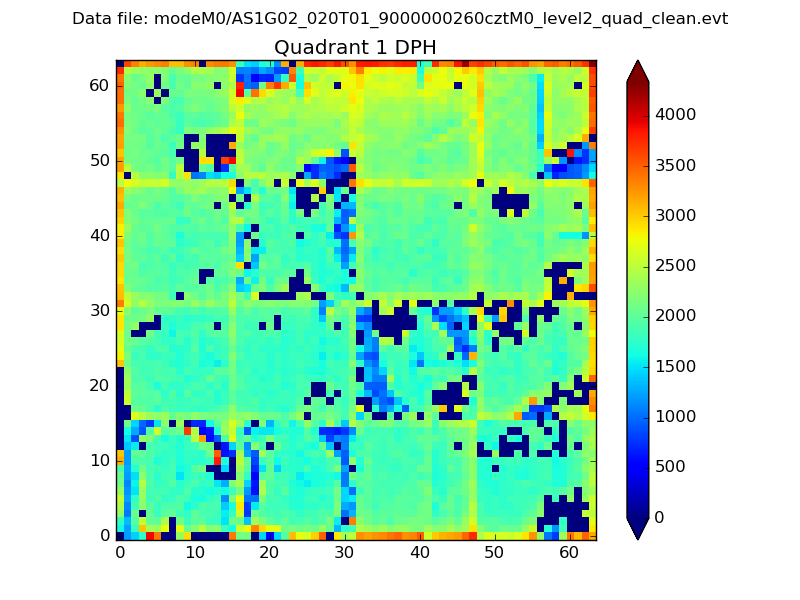 |
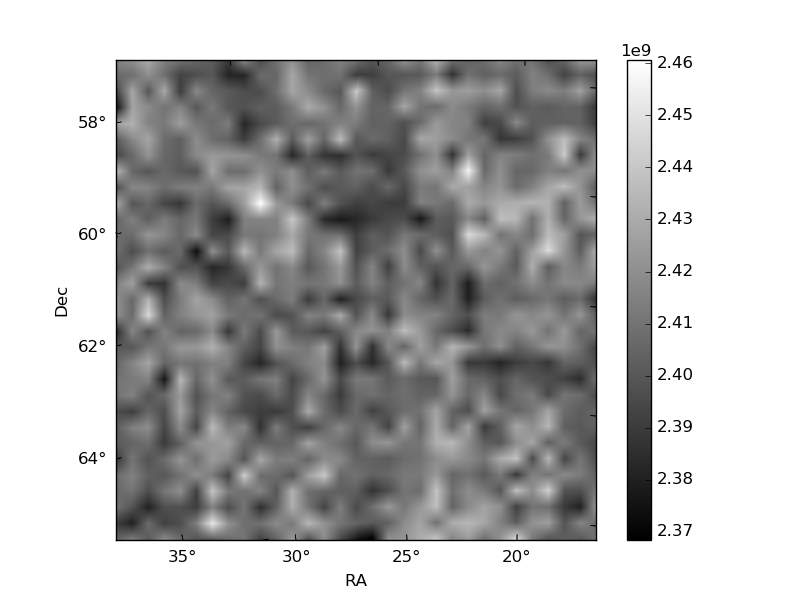
Quadrant B |
|---|---|---|---|
| Quadrant D | 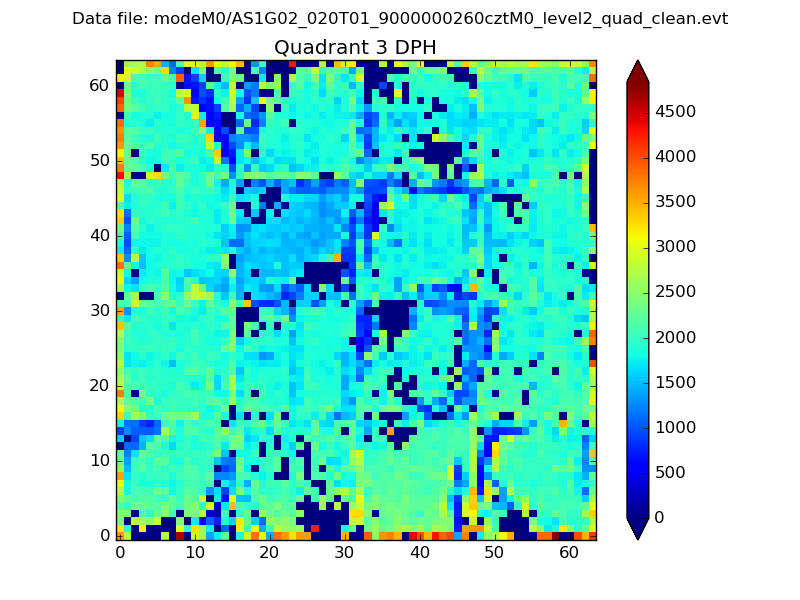 |
 |
Quadrant C |
| Plot type | Count rate plots | Images |
|---|---|---|
| Comparison with Poisson distribution Blue bars denote a histogram of data divided into 1 sec bins. Red curve is a Poisson curve with rate = median count rate of data. |
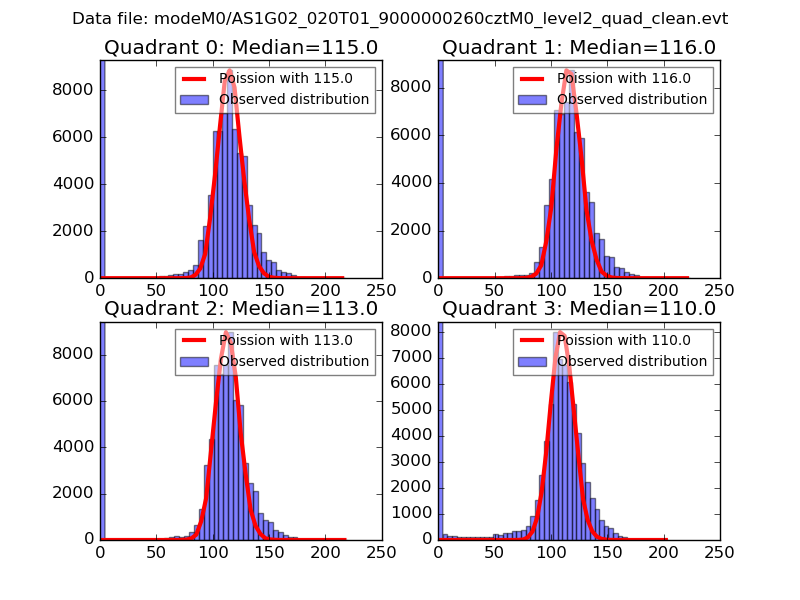 |
 |
| Quadrant-wise count rates Data is divided into 100 sec bins |
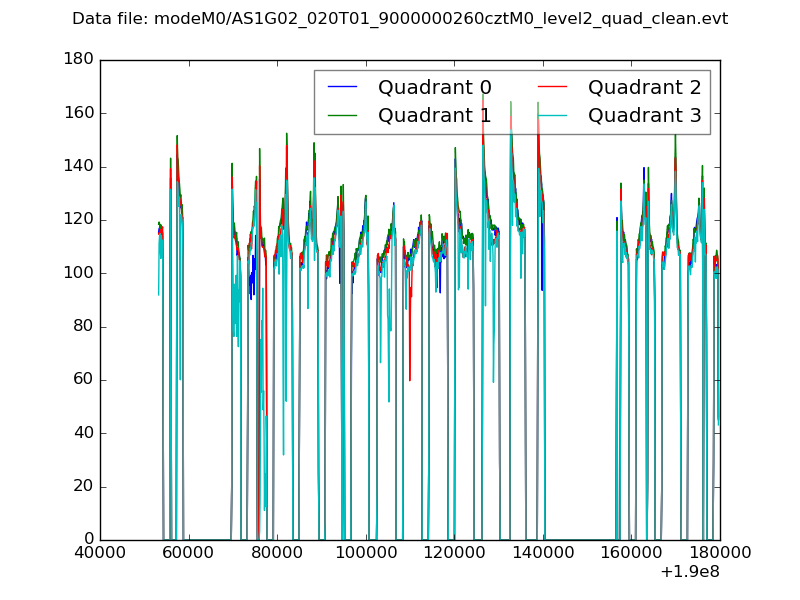 |
|
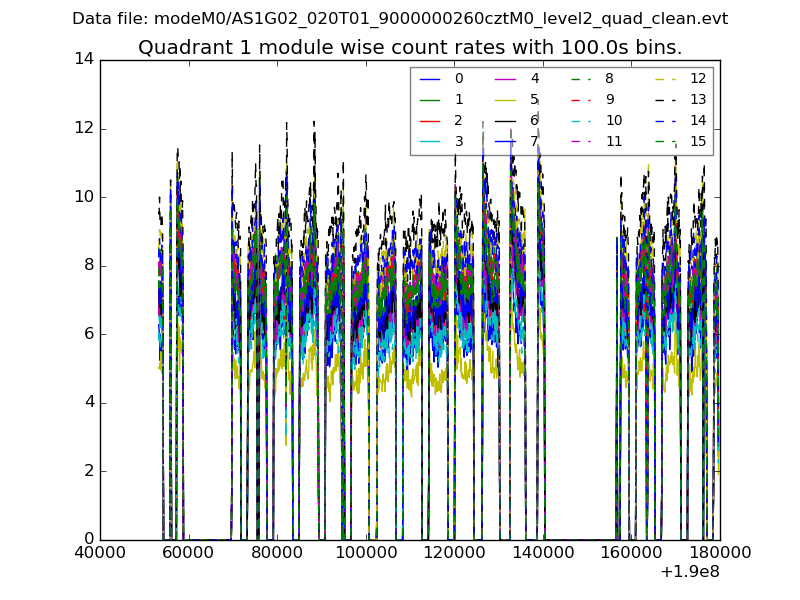
| Module-wise count rates for Quadrant A Data is divided into 100 sec bins |
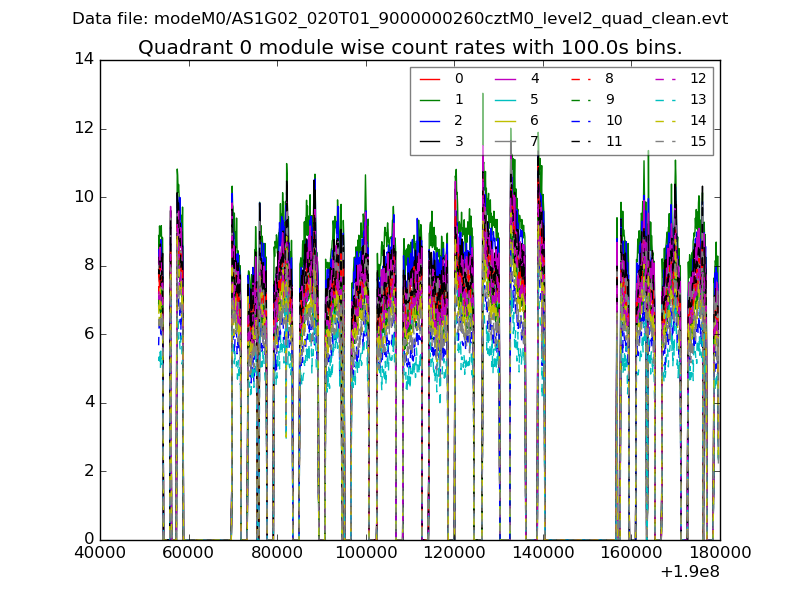 |
 |
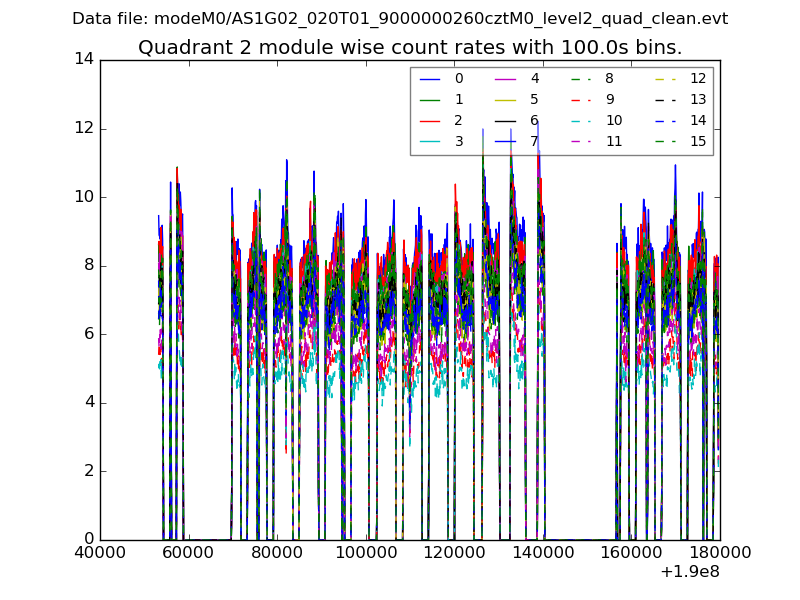
| Module-wise count rates for Quadrant B Data is divided into 100 sec bins |
 |
 |
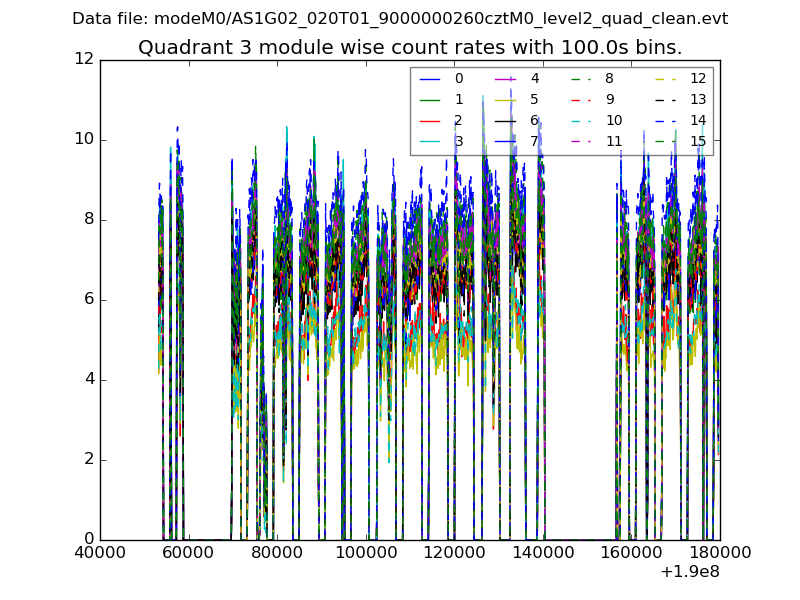
| Module-wise count rates for Quadrant C Data is divided into 100 sec bins |
 |
 |
| Module-wise count rates for Quadrant D Data is divided into 100 sec bins |
 |
 |
| Parameter | Plot |
|---|---|
| CZT HV Monitor | 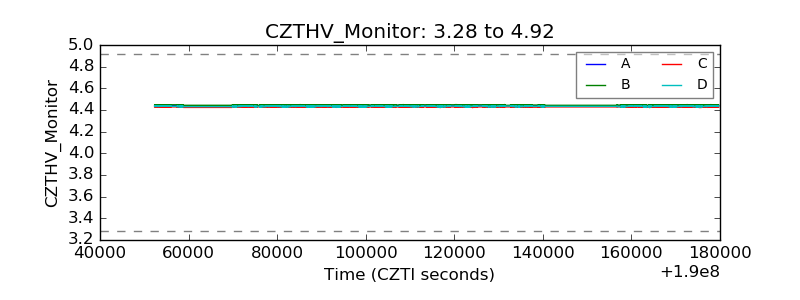 |
| D_VDD | 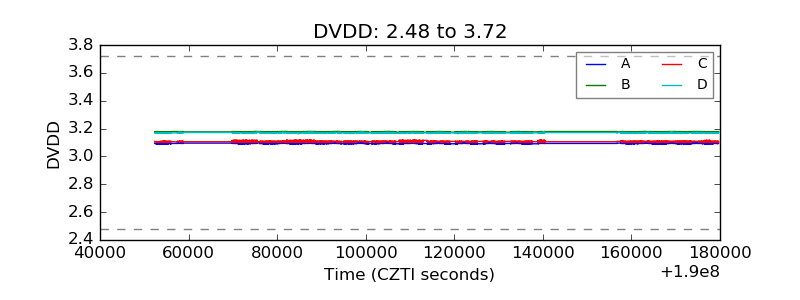 |
| Temperature 1 | 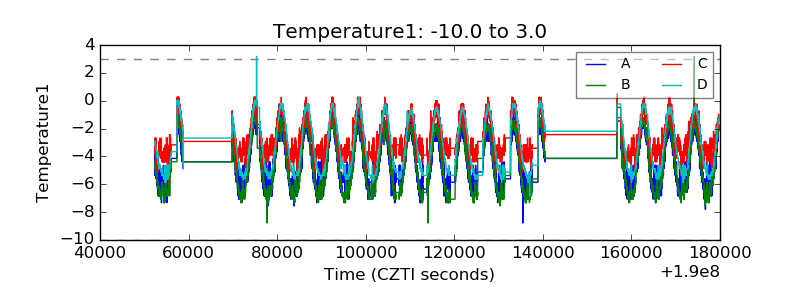 |
| Veto HV Monitor | 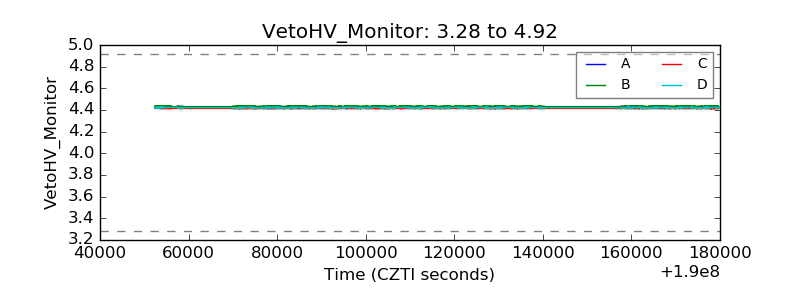 |
| Veto LLD | 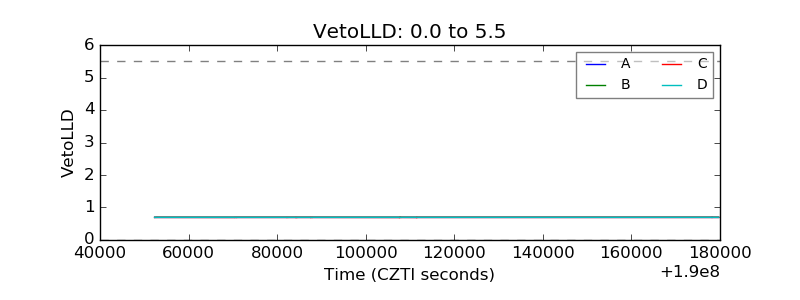 |
| Alpha Counter | 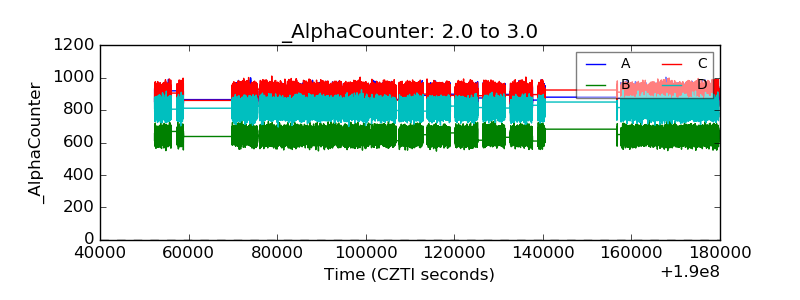 |
| _CPM_Rate | 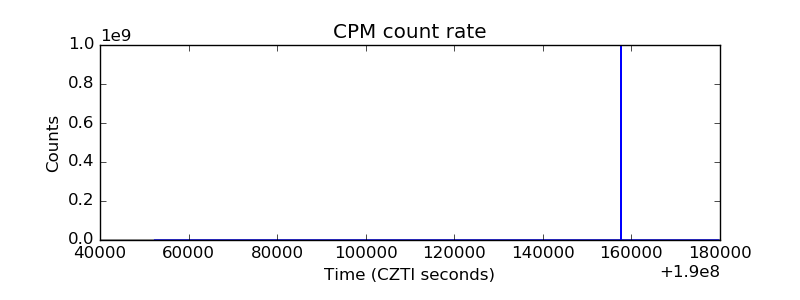 |
| CZT Counter | 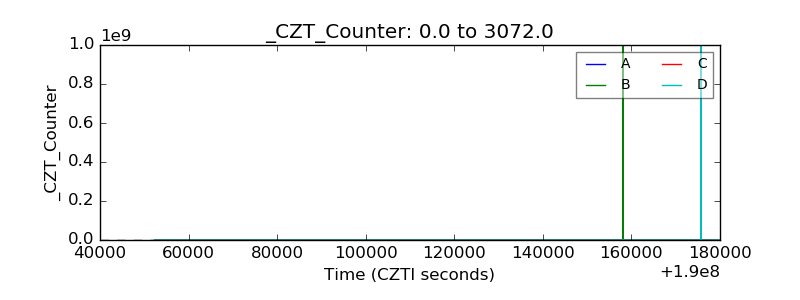 |
| +2.5 Volts monitor | 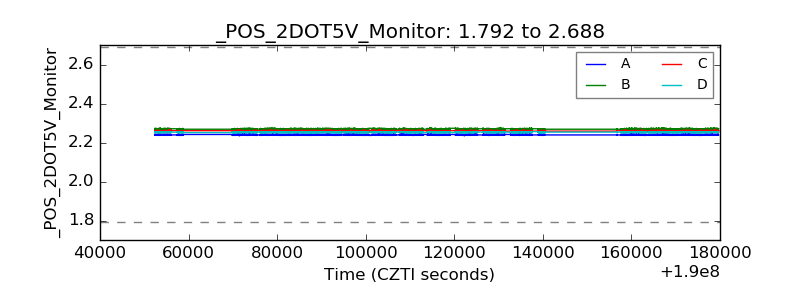 |
| +5 Volts monitor | 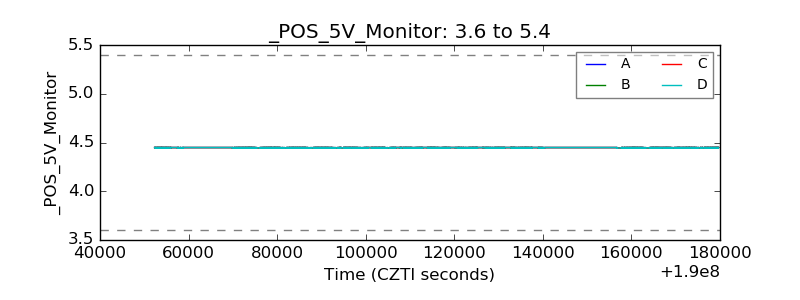 |
| _ROLL_ROT |  |
| _Roll_DEC | 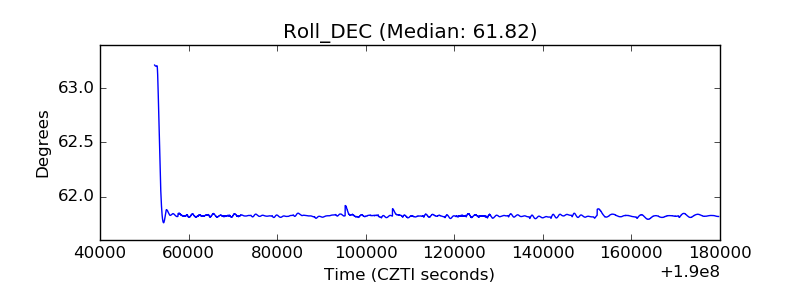 |
| _Roll_RA | 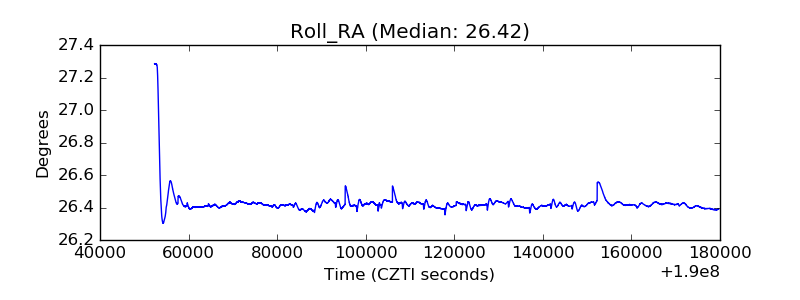 |
| Veto Counter | 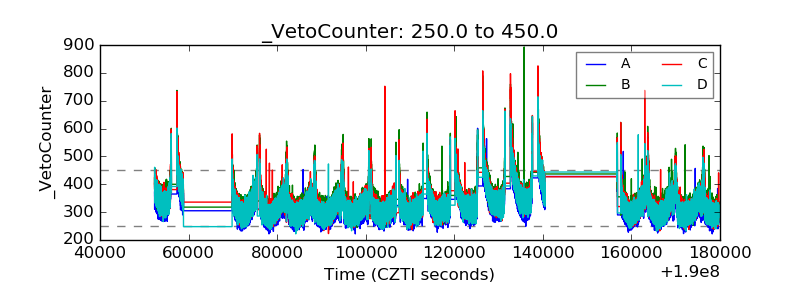 |