| Param | Original file | Final file |
|---|---|---|
| Filename | modeM0/AS1G02_019T01_9000000264cztM0_level2.fits | modeM0/AS1G02_019T01_9000000264cztM0_level2_quad_clean.evt |
| Size (bytes) | 640,108,800 | 656,461,440 |
| Size | 610.5 MB | 626.1 MB |
| Events in quadrant A | 3,743,230 | 3,850,414 |
| Events in quadrant B | 3,713,270 | 3,882,610 |
| Events in quadrant C | 3,707,572 | 3,710,722 |
| Events in quadrant D | 3,174,050 | 3,390,666 |
| Mode M0 | |||
|---|---|---|---|
| Quadrant | BADHDUFLAG | Total packets | Discarded packets |
| A | 0 | 315618 | 0 |
| B | 0 | 324297 | 0 |
| C | 0 | 308823 | 0 |
| D | 0 | 311632 | 0 |
| Mode M9 | |||
|---|---|---|---|
| Quadrant | BADHDUFLAG | Total packets | Discarded packets |
| A | 0 | 113 | 0 |
| B | 0 | 113 | 0 |
| C | 0 | 113 | 0 |
| D | 0 | 113 | 0 |
| Mode SS | |||
|---|---|---|---|
| Quadrant | BADHDUFLAG | Total packets | Discarded packets |
| A | 0 | 1498 | 0 |
| B | 0 | 1502 | 0 |
| C | 0 | 1502 | 0 |
| D | 0 | 1498 | 0 |
| Quadrant | Total seconds | Saturated seconds | Saturation percentage |
|---|---|---|---|
| A | 73583 | 484 | 0.657761% |
| B | 73539 | 449 | 0.610560% |
| C | 73608 | 474 | 0.643952% |
| D | 73603 | 1710 | 2.323275% |
Noise dominated data is calculated using 1-second bins in cleaned event files. If a bin has >2000 counts, and if more than 50% of those come from <1% of pixels, then it is considered to be noise-dominated and hence unusable.
| Quadrant | # 1 sec bins | Bins with >0 counts | Bins with >2000 counts | High rate bins dominated by noise | Noise dominated (total time) | Noise dominated (detector-on time) | Marked lightcurve |
|---|---|---|---|---|---|---|---|
| A | 95973 | 73778 | 0 | 0 | 0.00% | 0.00% | 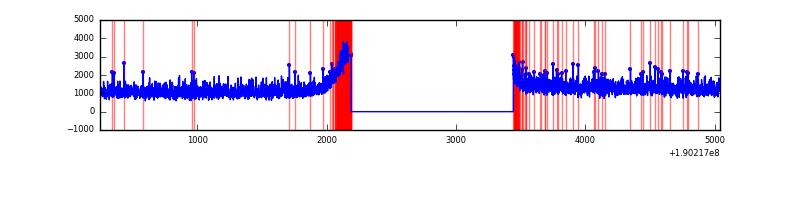 |
| B | 95973 | 73712 | 0 | 0 | 0.00% | 0.00% |  |
| C | 95973 | 73770 | 0 | 0 | 0.00% | 0.00% |  |
| D | 95973 | 73740 | 0 | 0 | 0.00% | 0.00% |  |
Top three noisy pixels from each quadrant. If the there are fewer than three noisy pixels in the level2.evt file, extra rows are filled as -1
| Pixel properties | Quadrant properties | ||||||
|---|---|---|---|---|---|---|---|
| Quadrant | DetID | PixID | Counts | Sigma | Mean | Median | Sigma |
| A | 0 | 29 | 3378 | 10.86 | 969 | 902 | 228.0 |
| A | 7 | 110 | 3327 | 10.64 | 969 | 902 | 228.0 |
| A | 14 | 79 | 2760 | 8.15 | 969 | 902 | 228.0 |
| B | 2 | 9 | 3011 | 11.67 | 979 | 930 | 178.3 |
| B | 14 | 254 | 2403 | 8.26 | 979 | 930 | 178.3 |
| B | 10 | 225 | 2366 | 8.05 | 979 | 930 | 178.3 |
| C | 2 | 191 | 2406 | 6.35 | 978 | 905 | 236.4 |
| C | 12 | 241 | 2405 | 6.34 | 978 | 905 | 236.4 |
| C | 9 | 242 | 2402 | 6.33 | 978 | 905 | 236.4 |
| D | 6 | 231 | 2247 | 6.67 | 906 | 831 | 212.1 |
| D | 6 | 44 | 2208 | 6.49 | 906 | 831 | 212.1 |
| D | 11 | 82 | 2195 | 6.43 | 906 | 831 | 212.1 |
Histogram calculated using DETX and DETY for each event in the final _common_clean file
| Quadrant A |  |
 |
Quadrant B |
|---|---|---|---|
| Quadrant D |  |
 |
Quadrant C |
| Plot type | Count rate plots | Images |
|---|---|---|
| Comparison with Poisson distribution Blue bars denote a histogram of data divided into 1 sec bins. Red curve is a Poisson curve with rate = median count rate of data. |
 |
 |
| Quadrant-wise count rates Data is divided into 100 sec bins |
 |
|
| Module-wise count rates for Quadrant A Data is divided into 100 sec bins |
 |
 |
| Module-wise count rates for Quadrant B Data is divided into 100 sec bins |
 |
 |
| Module-wise count rates for Quadrant C Data is divided into 100 sec bins |
 |
 |
| Module-wise count rates for Quadrant D Data is divided into 100 sec bins |
 |
 |
| Parameter | Plot |
|---|---|
| CZT HV Monitor |  |
| D_VDD |  |
| Temperature 1 | 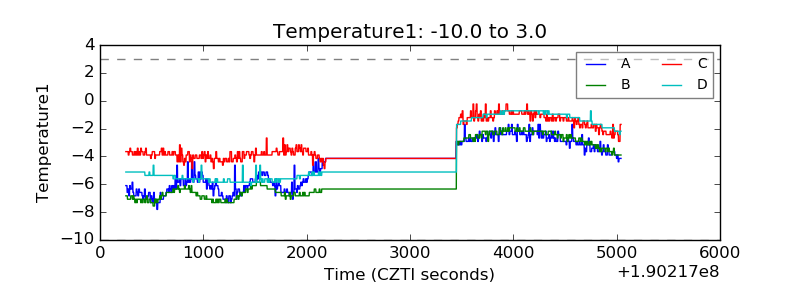 |
| Veto HV Monitor |  |
| Veto LLD |  |
| Alpha Counter |  |
| _CPM_Rate |  |
| CZT Counter |  |
| +2.5 Volts monitor |  |
| +5 Volts monitor |  |
| _ROLL_ROT |  |
| _Roll_DEC |  |
| _Roll_RA |  |
| Veto Counter |  |