| Param | Original file | Final file |
|---|---|---|
| Filename | modeM0/AS1G02_019T04_9000000262cztM0_level2.fits | modeM0/AS1G02_019T04_9000000262cztM0_level2_quad_clean.evt |
| Size (bytes) | 153,434,880 | 130,144,320 |
| Size | 146.3 MB | 124.1 MB |
| Events in quadrant A | 888,152 | 699,356 |
| Events in quadrant B | 888,918 | 707,318 |
| Events in quadrant C | 874,804 | 676,216 |
| Events in quadrant D | 759,624 | 622,796 |
| Mode M9 | |||
|---|---|---|---|
| Quadrant | BADHDUFLAG | Total packets | Discarded packets |
| A | 0 | 26 | 0 |
| B | 0 | 26 | 0 |
| C | 0 | 26 | 0 |
| D | 0 | 26 | 0 |
| Mode SS | |||
|---|---|---|---|
| Quadrant | BADHDUFLAG | Total packets | Discarded packets |
| A | 0 | 372 | 0 |
| B | 0 | 384 | 0 |
| C | 0 | 378 | 0 |
| D | 0 | 370 | 0 |
| Mode M0 | |||
|---|---|---|---|
| Quadrant | BADHDUFLAG | Total packets | Discarded packets |
| A | 0 | 77430 | 0 |
| B | 0 | 79184 | 0 |
| C | 0 | 75247 | 0 |
| D | 0 | 76038 | 0 |
| Quadrant | Total seconds | Saturated seconds | Saturation percentage |
|---|---|---|---|
| A | 17865 | 121 | 0.677302% |
| B | 17864 | 92 | 0.515002% |
| C | 17868 | 102 | 0.570853% |
| D | 17892 | 286 | 1.598480% |
Noise dominated data is calculated using 1-second bins in cleaned event files. If a bin has >2000 counts, and if more than 50% of those come from <1% of pixels, then it is considered to be noise-dominated and hence unusable.
| Quadrant | # 1 sec bins | Bins with >0 counts | Bins with >2000 counts | High rate bins dominated by noise | Noise dominated (total time) | Noise dominated (detector-on time) | Marked lightcurve |
|---|---|---|---|---|---|---|---|
| A | 36010 | 18178 | 0 | 0 | 0.00% | 0.00% |  |
| B | 36010 | 18187 | 0 | 0 | 0.00% | 0.00% | 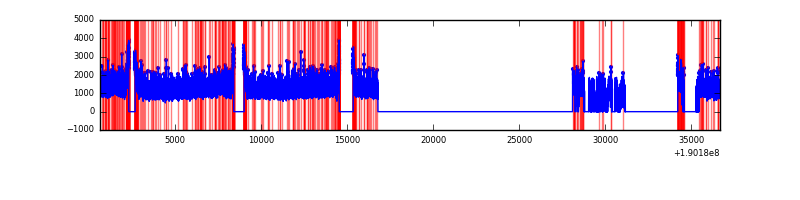 |
| C | 36010 | 18171 | 0 | 0 | 0.00% | 0.00% | 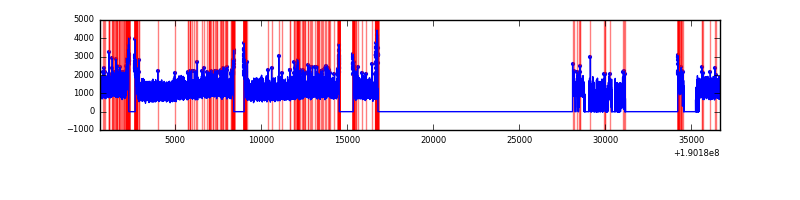 |
| D | 36010 | 18203 | 0 | 0 | 0.00% | 0.00% | 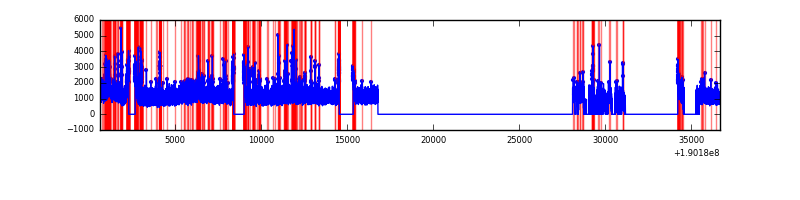 |
Top three noisy pixels from each quadrant. If the there are fewer than three noisy pixels in the level2.evt file, extra rows are filled as -1
| Pixel properties | Quadrant properties | ||||||
|---|---|---|---|---|---|---|---|
| Quadrant | DetID | PixID | Counts | Sigma | Mean | Median | Sigma |
| A | 0 | 29 | 805 | 10.4 | 230 | 215 | 56.8 |
| A | 7 | 110 | 802 | 10.34 | 230 | 215 | 56.8 |
| A | 0 | 30 | 667 | 7.96 | 230 | 215 | 56.8 |
| B | 2 | 9 | 681 | 10.05 | 234 | 222 | 45.7 |
| B | 14 | 254 | 583 | 7.9 | 234 | 222 | 45.7 |
| B | 5 | 232 | 564 | 7.49 | 234 | 222 | 45.7 |
| C | 2 | 191 | 570 | 6.07 | 231 | 213 | 58.8 |
| C | 9 | 242 | 569 | 6.05 | 231 | 213 | 58.8 |
| C | 9 | 233 | 563 | 5.95 | 231 | 213 | 58.8 |
| D | 15 | 46 | 544 | 6.65 | 216 | 198 | 52.0 |
| D | 15 | 30 | 539 | 6.56 | 216 | 198 | 52.0 |
| D | 6 | 44 | 533 | 6.44 | 216 | 198 | 52.0 |
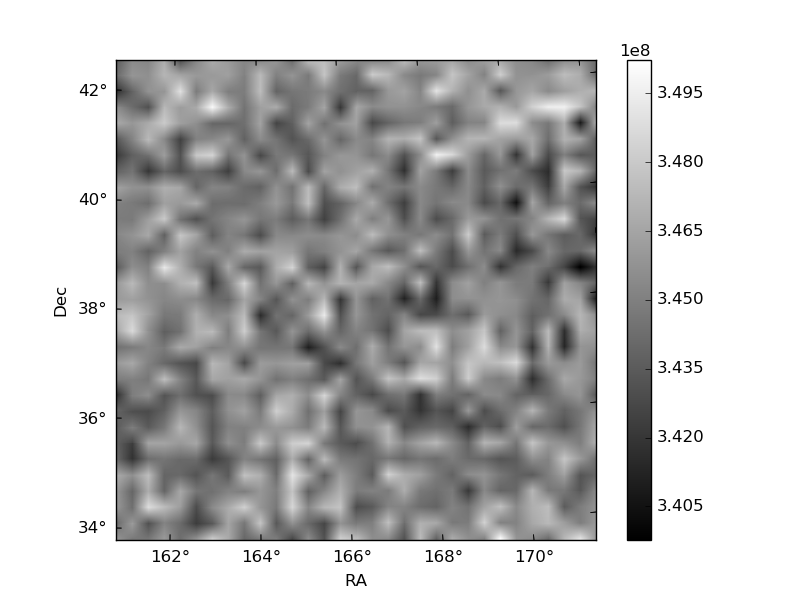
Histogram calculated using DETX and DETY for each event in the final _common_clean file
| Quadrant A |  |
 |
Quadrant B |
|---|---|---|---|
| Quadrant D | 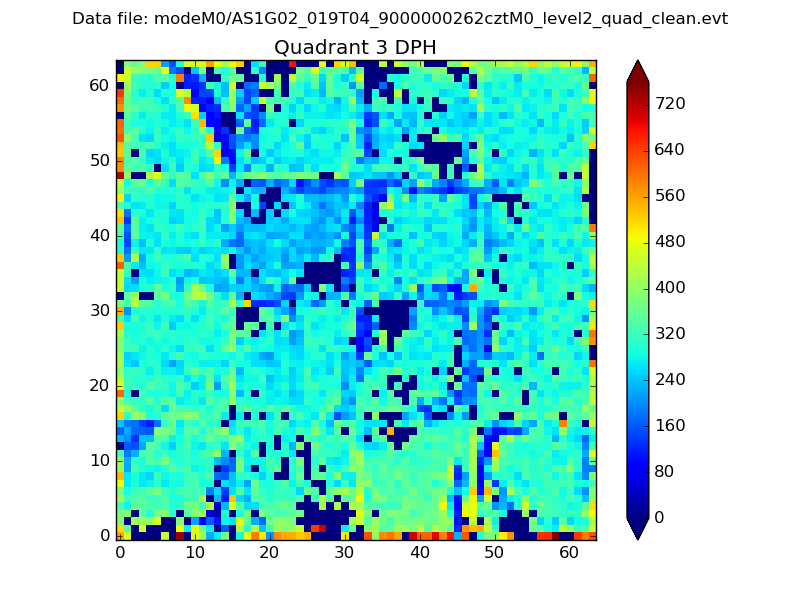 |
 |
Quadrant C |
| Plot type | Count rate plots | Images |
|---|---|---|
| Comparison with Poisson distribution Blue bars denote a histogram of data divided into 1 sec bins. Red curve is a Poisson curve with rate = median count rate of data. |
 |
 |
| Quadrant-wise count rates Data is divided into 100 sec bins |
 |
|
| Module-wise count rates for Quadrant A Data is divided into 100 sec bins |
 |
 |
| Module-wise count rates for Quadrant B Data is divided into 100 sec bins |
 |
 |
| Module-wise count rates for Quadrant C Data is divided into 100 sec bins |
 |
 |
| Module-wise count rates for Quadrant D Data is divided into 100 sec bins |
 |
 |
| Parameter | Plot |
|---|---|
| CZT HV Monitor | 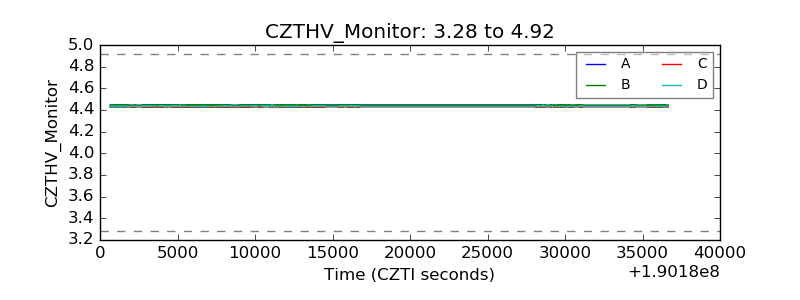 |
| D_VDD | 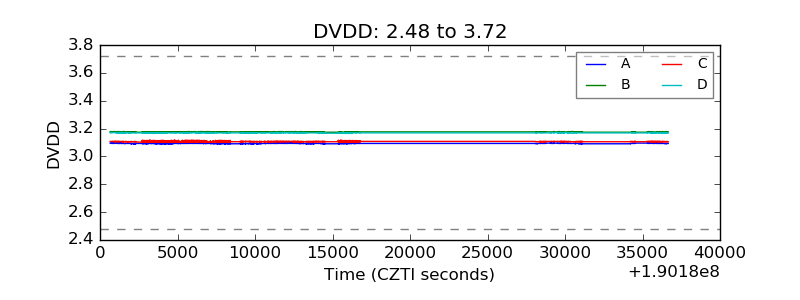 |
| Temperature 1 |  |
| Veto HV Monitor | 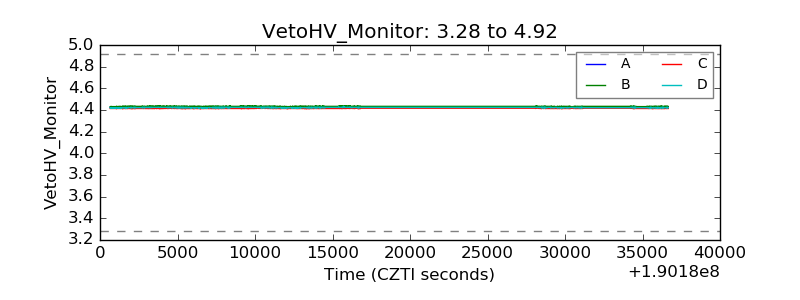 |
| Veto LLD |  |
| Alpha Counter |  |
| _CPM_Rate |  |
| CZT Counter |  |
| +2.5 Volts monitor |  |
| +5 Volts monitor |  |
| _ROLL_ROT |  |
| _Roll_DEC | 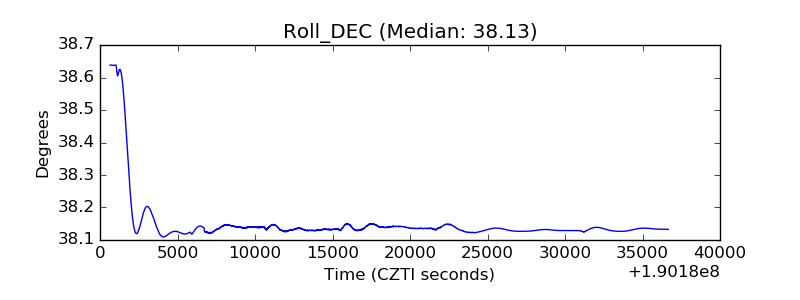 |
| _Roll_RA |  |
| Veto Counter |  |