| Param | Original file | Final file |
|---|---|---|
| Filename | modeM0/AS1G02_019T04_9000000262_01555cztM0_level2.evt | modeM0/AS1G02_019T04_9000000262_01555cztM0_level2_quad_clean.evt |
| Size (bytes) | 559,342,080 | 52,632,000 |
| Size | 533.4 MB | 50.2 MB |
| Events in quadrant A | 4,134,061 | 340,979 |
| Events in quadrant B | 4,312,848 | 350,219 |
| Events in quadrant C | 3,970,741 | 342,515 |
| Events in quadrant D | 4,302,753 | 326,638 |
| Mode M9 | |||
|---|---|---|---|
| Quadrant | BADHDUFLAG | Total packets | Discarded packets |
| A | 0 | 4 | 0 |
| B | 0 | 4 | 0 |
| C | 0 | 4 | 0 |
| D | 0 | 4 | 0 |
| Mode SS | |||
|---|---|---|---|
| Quadrant | BADHDUFLAG | Total packets | Discarded packets |
| A | 0 | 68 | 0 |
| B | 0 | 68 | 0 |
| C | 0 | 68 | 0 |
| D | 0 | 68 | 0 |
| Mode M0 | |||
|---|---|---|---|
| Quadrant | BADHDUFLAG | Total packets | Discarded packets |
| A | 0 | 14632 | 2 |
| B | 0 | 15133 | 1 |
| C | 0 | 14125 | 1 |
| D | 0 | 15129 | 1 |
| Quadrant | Total seconds | Saturated seconds | Saturation percentage |
|---|---|---|---|
| A | 3283 | 51 | 1.553457% |
| B | 3283 | 38 | 1.157478% |
| C | 3283 | 22 | 0.670119% |
| D | 3283 | 124 | 3.777033% |
Noise dominated data is calculated using 1-second bins in cleaned event files. If a bin has >2000 counts, and if more than 50% of those come from <1% of pixels, then it is considered to be noise-dominated and hence unusable.
| Quadrant | # 1 sec bins | Bins with >0 counts | Bins with >2000 counts | High rate bins dominated by noise | Noise dominated (total time) | Noise dominated (detector-on time) | Marked lightcurve |
|---|---|---|---|---|---|---|---|
| A | 3658 | 3283 | 194 | 194 | 5.30% | 5.91% | 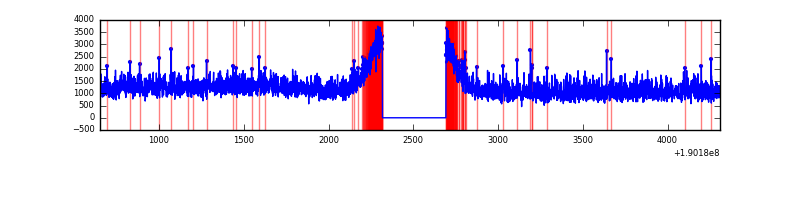 |
| B | 3658 | 3283 | 223 | 223 | 6.10% | 6.79% | 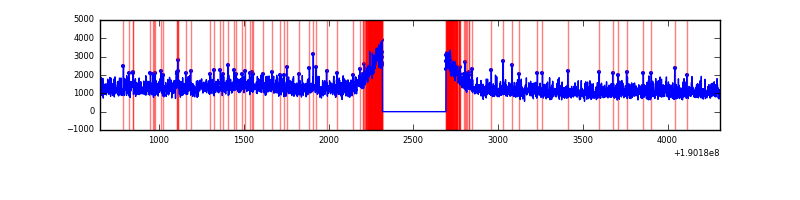 |
| C | 3658 | 3283 | 171 | 171 | 4.67% | 5.21% | 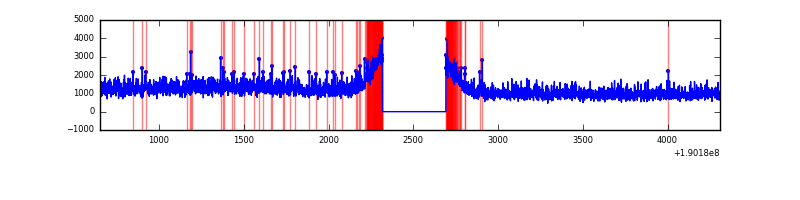 |
| D | 3658 | 3284 | 426 | 426 | 11.65% | 12.97% | 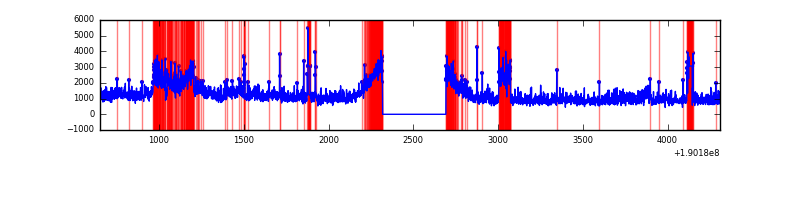 |
Top three noisy pixels from each quadrant. If the there are fewer than three noisy pixels in the level2.evt file, extra rows are filled as -1
| Pixel properties | Quadrant properties | ||||||
|---|---|---|---|---|---|---|---|
| Quadrant | DetID | PixID | Counts | Sigma | Mean | Median | Sigma |
| A | 12 | 251 | 12406 | 43.21 | 1075 | 1082 | 262.0 |
| A | 10 | 2 | 6404 | 20.31 | 1075 | 1082 | 262.0 |
| A | 13 | 9 | 4626 | 13.52 | 1075 | 1082 | 262.0 |
| B | 4 | 216 | 7890 | 24.88 | 1135 | 1141 | 271.2 |
| B | 4 | 170 | 4528 | 12.49 | 1135 | 1141 | 271.2 |
| B | 0 | 182 | 3413 | 8.38 | 1135 | 1141 | 271.2 |
| C | 8 | 208 | 25150 | 84.48 | 1009 | 1044 | 285.4 |
| C | 7 | 159 | 4518 | 12.17 | 1009 | 1044 | 285.4 |
| C | 14 | 223 | 4399 | 11.76 | 1009 | 1044 | 285.4 |
| D | 13 | 105 | 525058 | 1722.83 | 966 | 1002 | 304.2 |
| D | 10 | 84 | 143265 | 467.69 | 966 | 1002 | 304.2 |
| D | 13 | 169 | 13846 | 42.22 | 966 | 1002 | 304.2 |
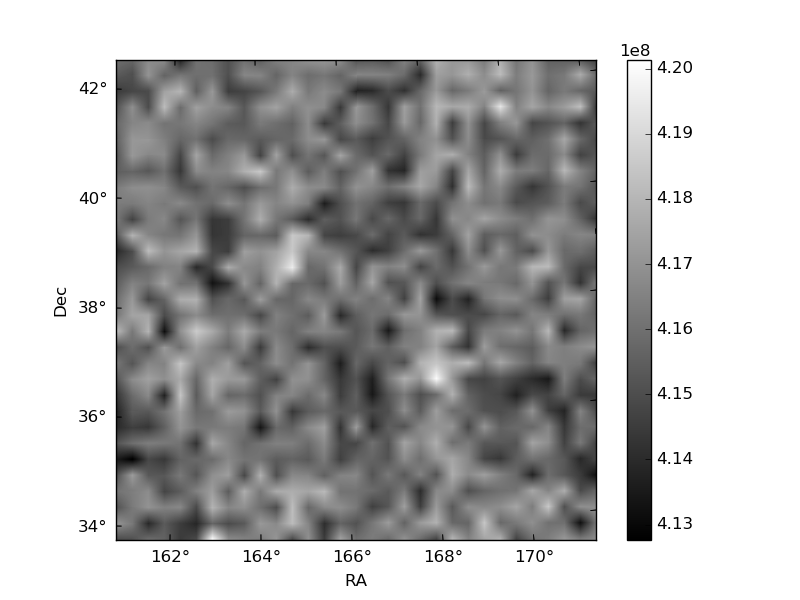
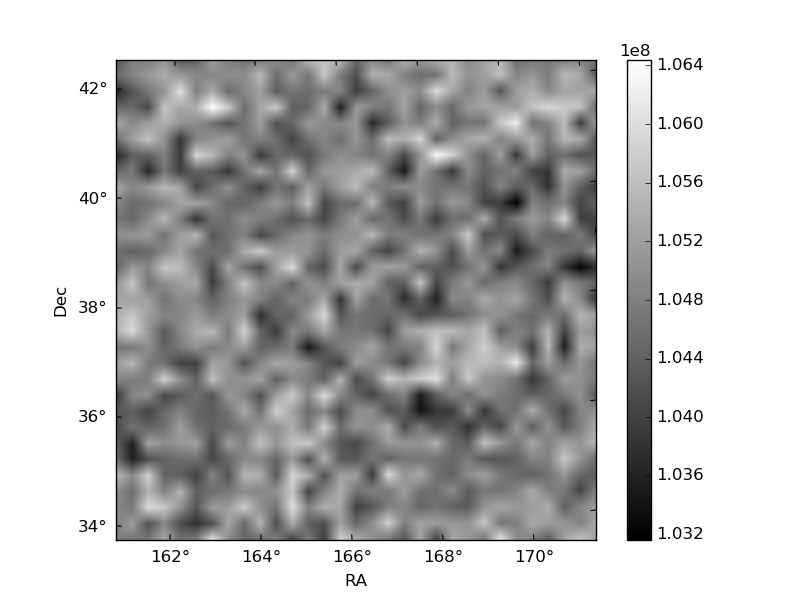
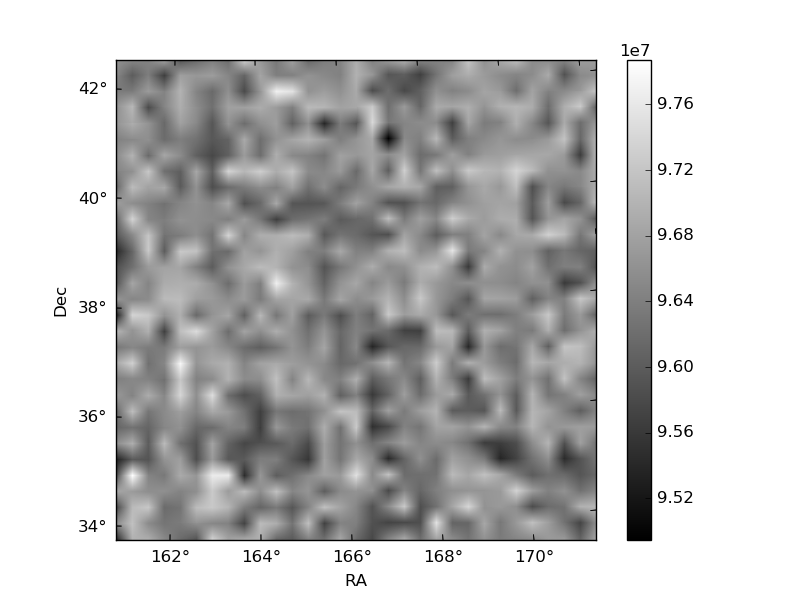
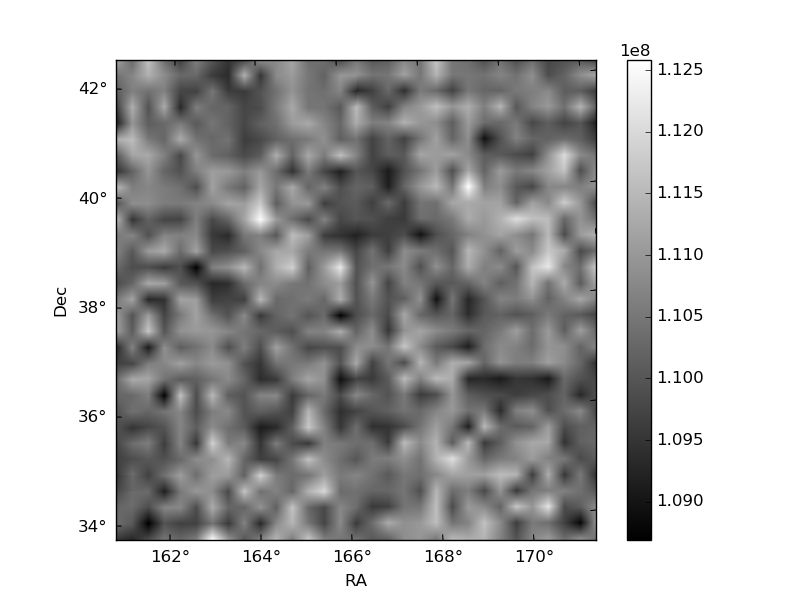
Histogram calculated using DETX and DETY for each event in the final _common_clean file
| Quadrant A | 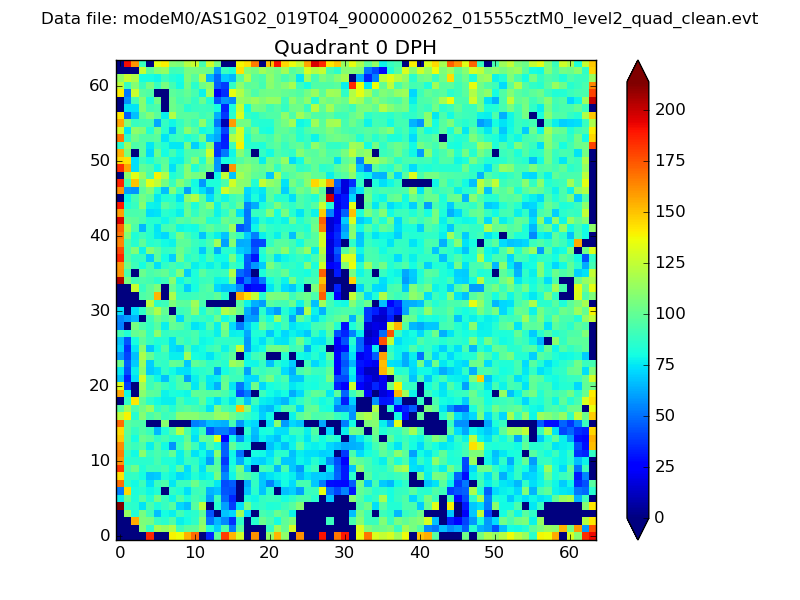 |
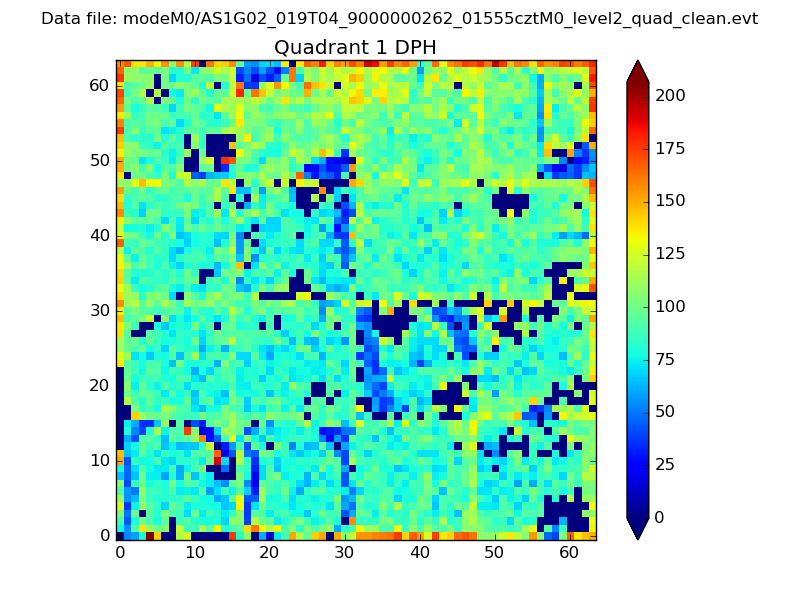 |
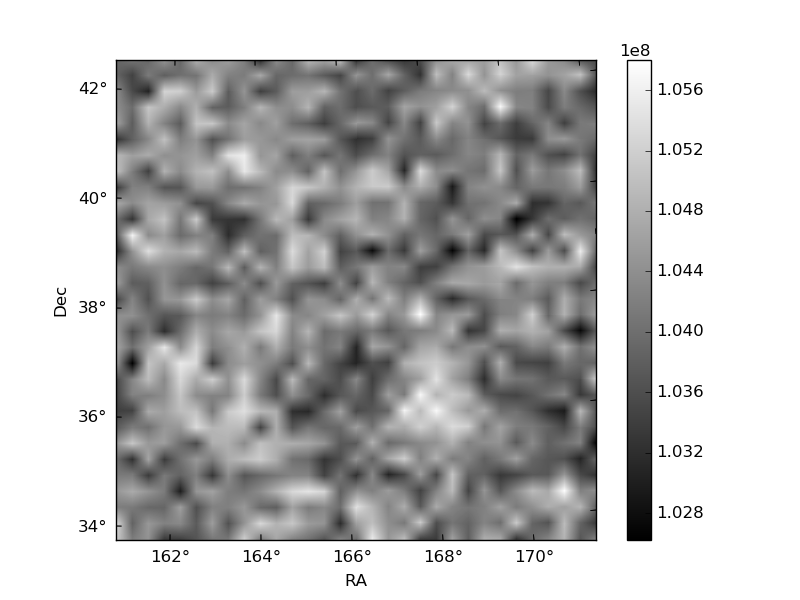
Quadrant B |
|---|---|---|---|
| Quadrant D | 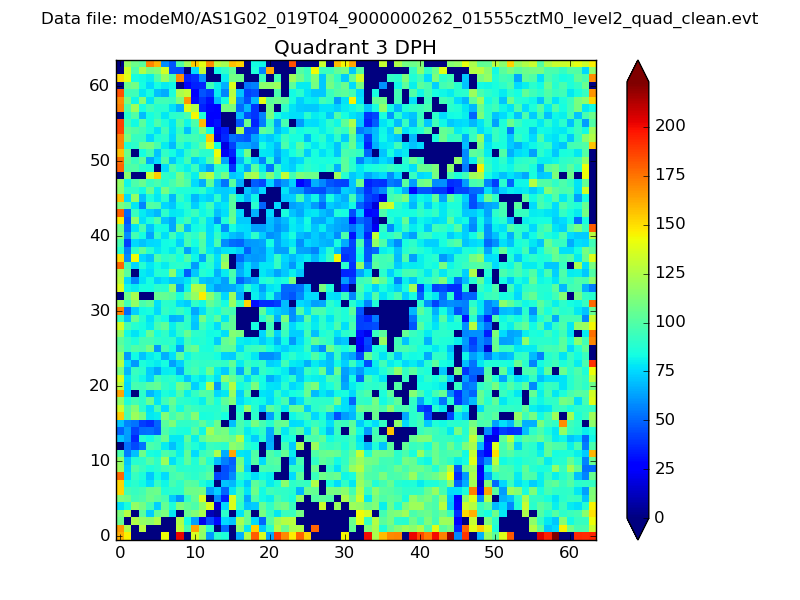 |
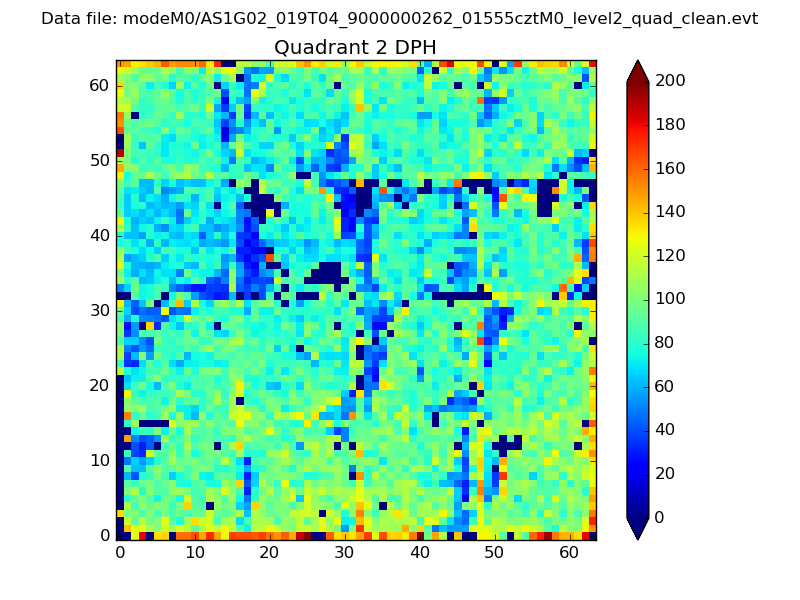 |
Quadrant C |
| Plot type | Count rate plots | Images |
|---|---|---|
| Comparison with Poisson distribution Blue bars denote a histogram of data divided into 1 sec bins. Red curve is a Poisson curve with rate = median count rate of data. |
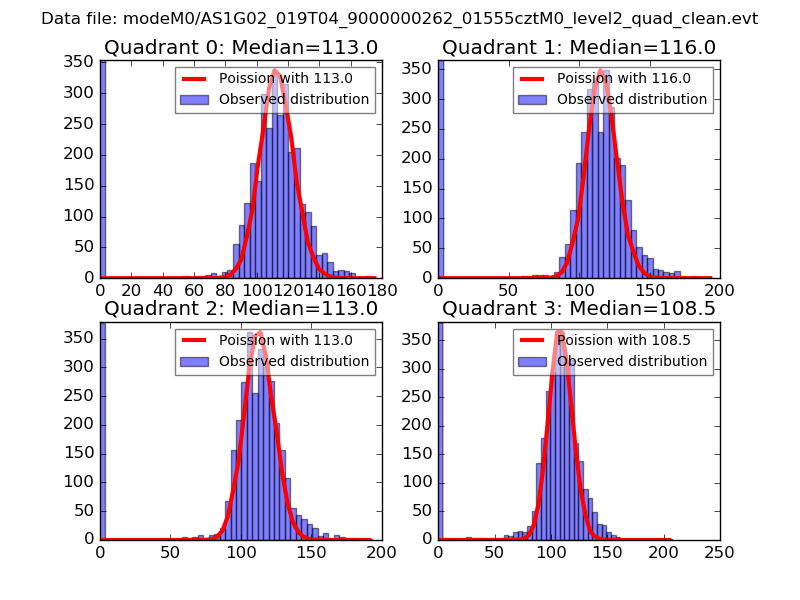 |
 |
| Quadrant-wise count rates Data is divided into 100 sec bins |
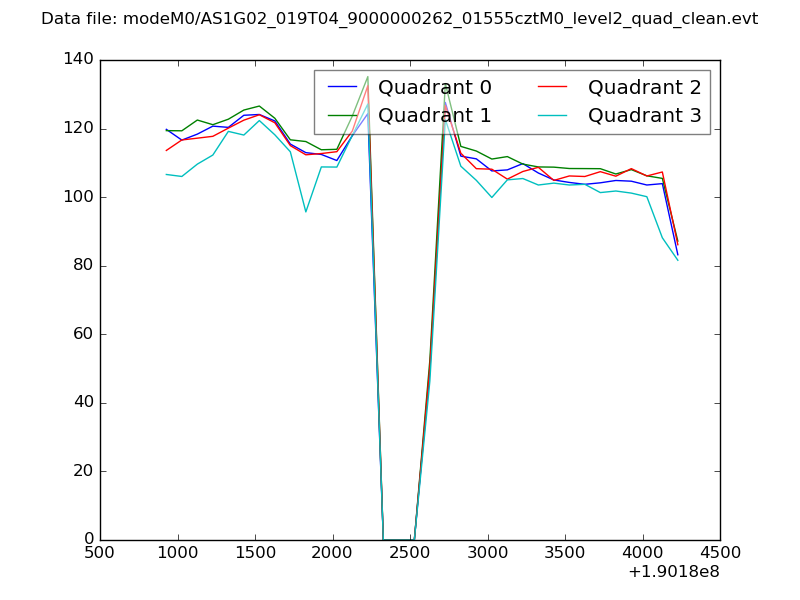 |
|
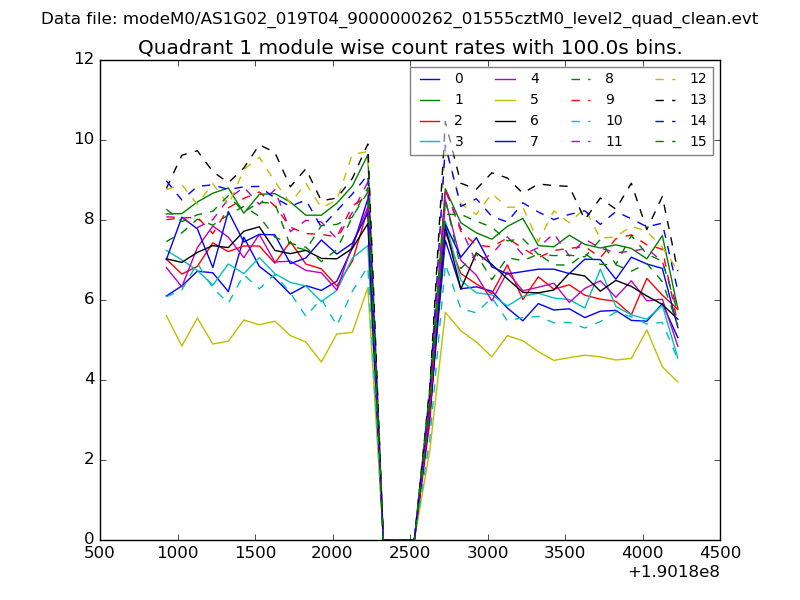
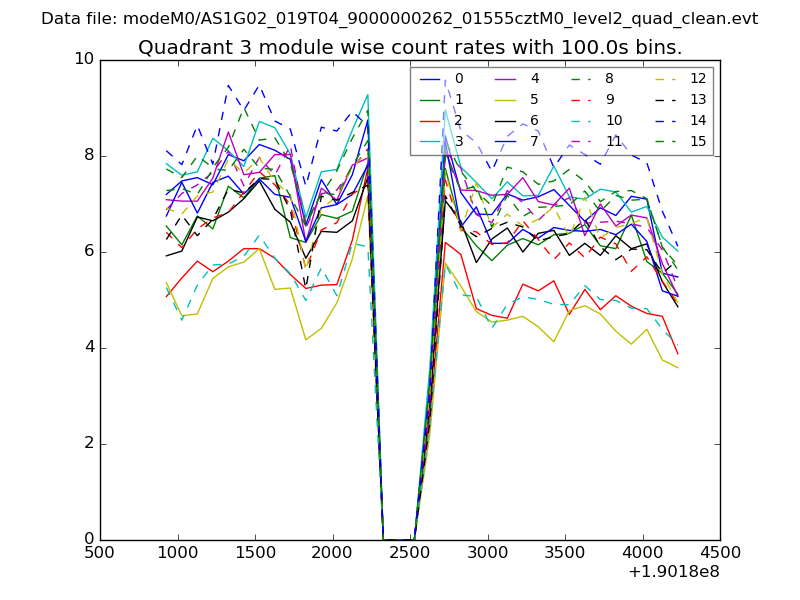
| Module-wise count rates for Quadrant A Data is divided into 100 sec bins |
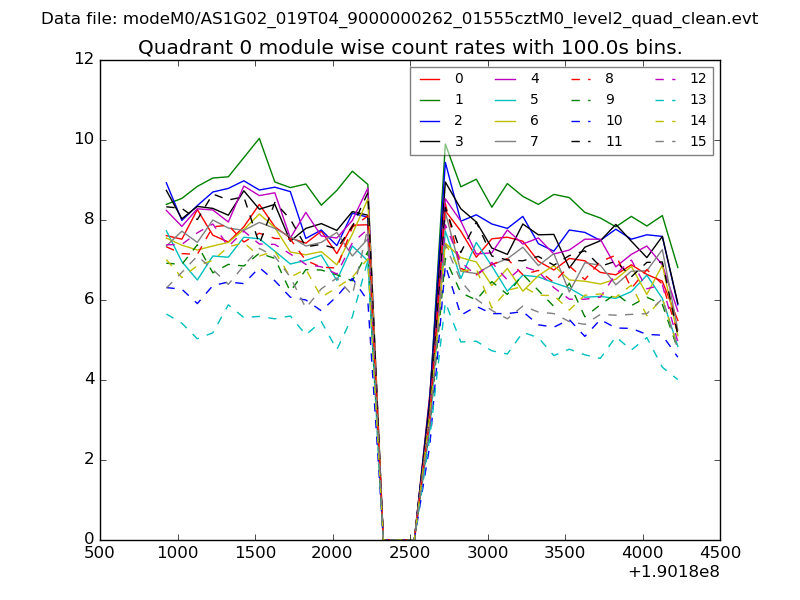 |
 |
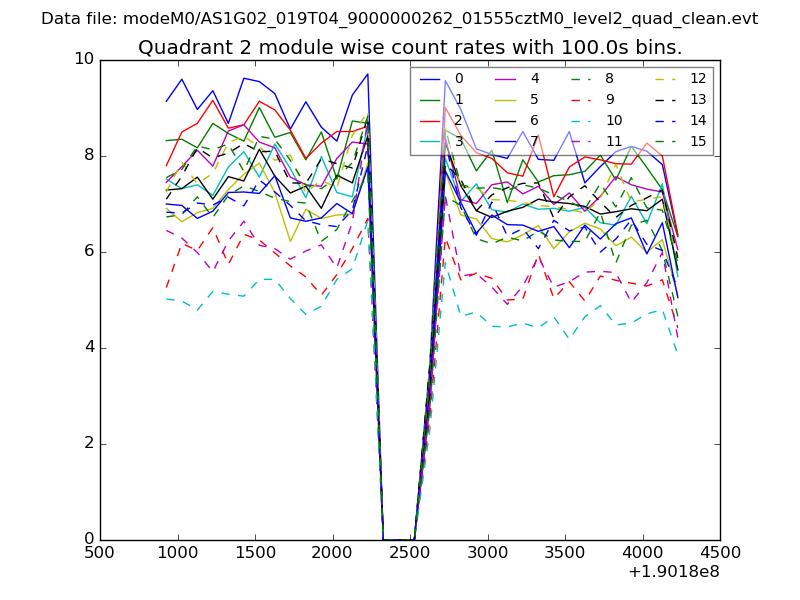
| Module-wise count rates for Quadrant B Data is divided into 100 sec bins |
 |
 |
| Module-wise count rates for Quadrant C Data is divided into 100 sec bins |
 |
 |
| Module-wise count rates for Quadrant D Data is divided into 100 sec bins |
 |
 |
| Parameter | Plot |
|---|---|
| CZT HV Monitor | 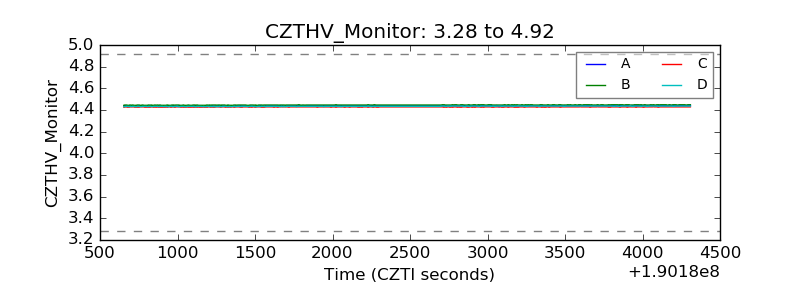 |
| D_VDD | 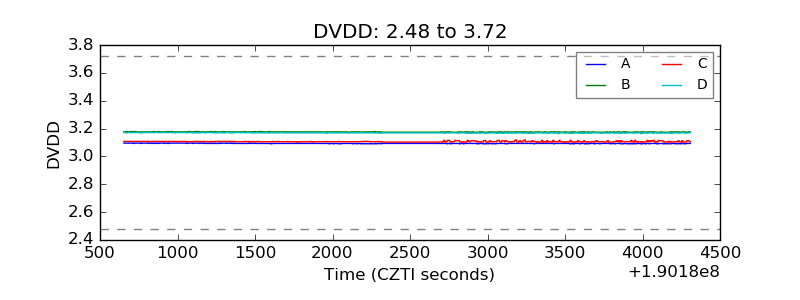 |
| Temperature 1 |  |
| Veto HV Monitor | 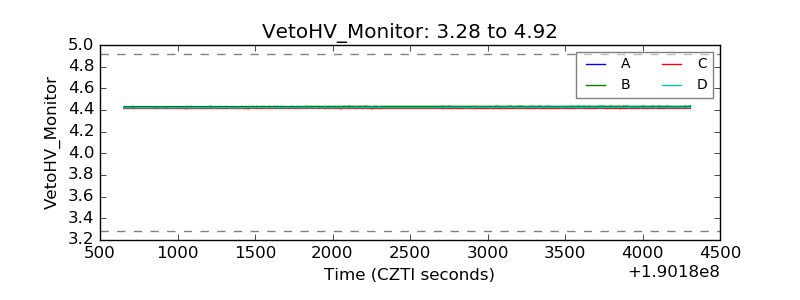 |
| Veto LLD | 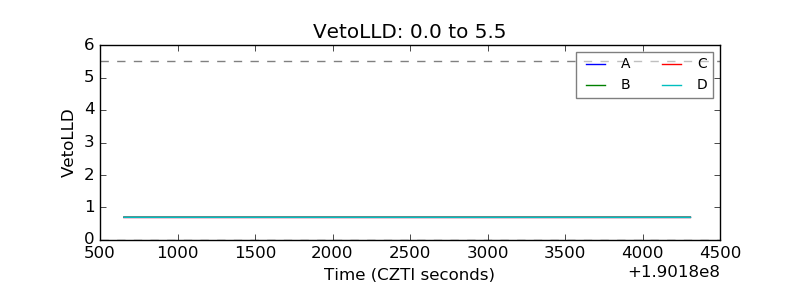 |
| Alpha Counter | 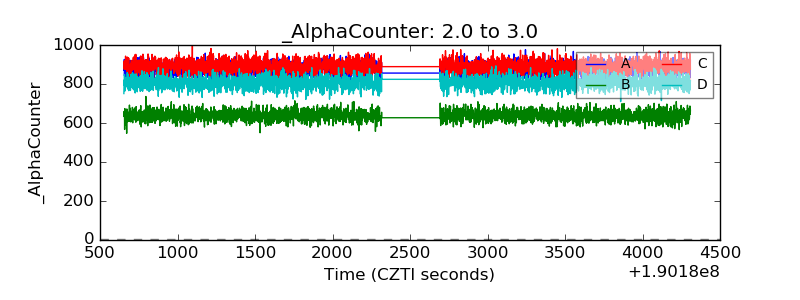 |
| _CPM_Rate | 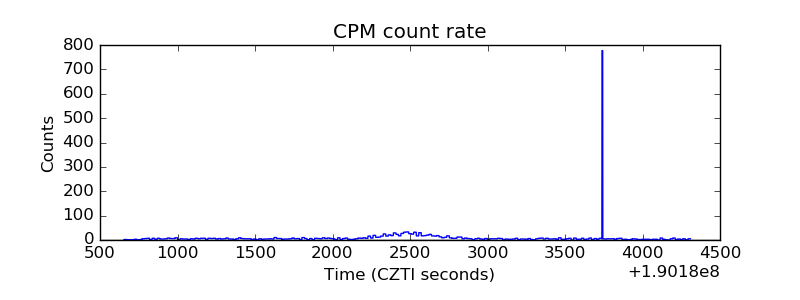 |
| CZT Counter | 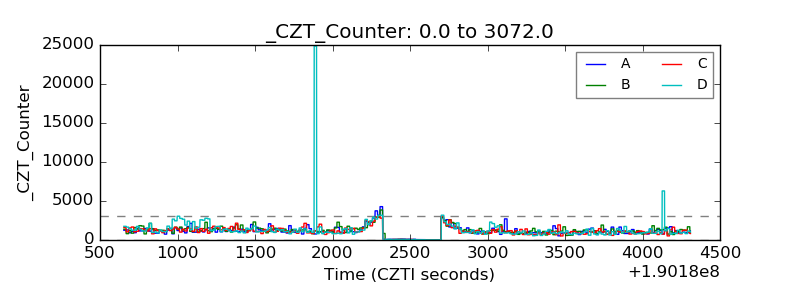 |
| +2.5 Volts monitor |  |
| +5 Volts monitor |  |
| _ROLL_ROT | 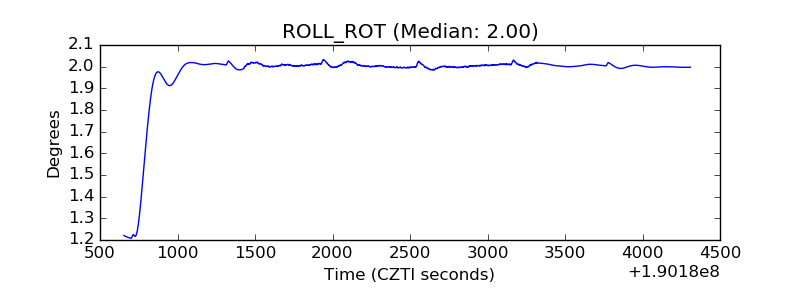 |
| _Roll_DEC | 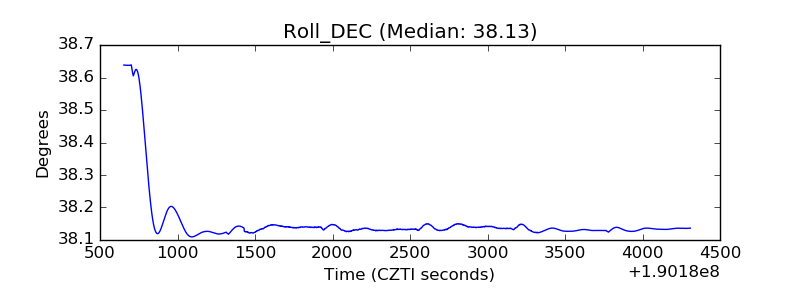 |
| _Roll_RA | 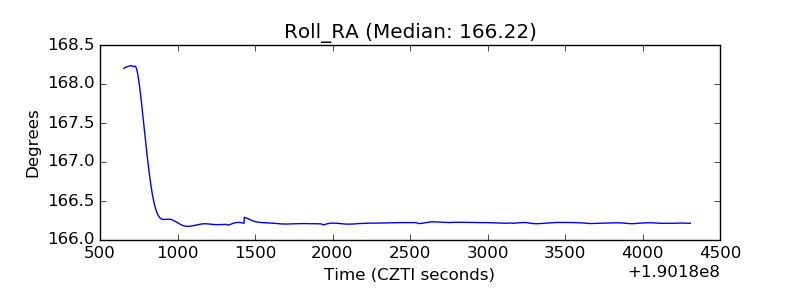 |
| Veto Counter | 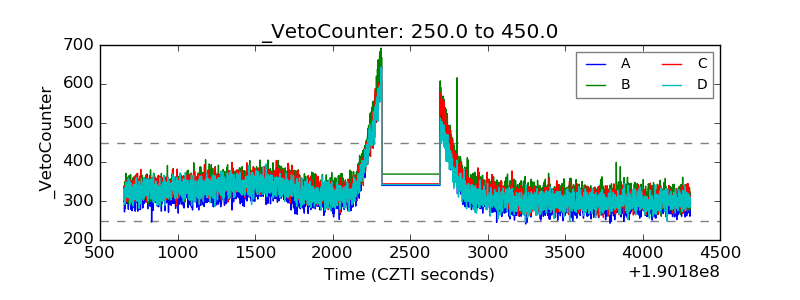 |