| Param | Original file | Final file |
|---|---|---|
| Filename | modeM0/AS1G02_019T04_9000000262_01556cztM0_level2.evt | modeM0/AS1G02_019T04_9000000262_01556cztM0_level2_quad_clean.evt |
| Size (bytes) | 1,078,804,800 | 85,561,920 |
| Size | 1.0 GB | 81.6 MB |
| Events in quadrant A | 8,202,441 | 525,495 |
| Events in quadrant B | 8,375,286 | 539,822 |
| Events in quadrant C | 7,695,046 | 531,256 |
| Events in quadrant D | 7,939,492 | 511,993 |
| Mode M9 | |||
|---|---|---|---|
| Quadrant | BADHDUFLAG | Total packets | Discarded packets |
| A | 0 | 6 | 0 |
| B | 0 | 6 | 0 |
| C | 0 | 6 | 0 |
| D | 0 | 6 | 0 |
| Mode SS | |||
|---|---|---|---|
| Quadrant | BADHDUFLAG | Total packets | Discarded packets |
| A | 0 | 140 | 0 |
| B | 0 | 140 | 0 |
| C | 0 | 140 | 0 |
| D | 0 | 140 | 0 |
| Mode M0 | |||
|---|---|---|---|
| Quadrant | BADHDUFLAG | Total packets | Discarded packets |
| A | 0 | 29285 | 2 |
| B | 0 | 29796 | 1 |
| C | 0 | 27819 | 1 |
| D | 0 | 28558 | 1 |
| Quadrant | Total seconds | Saturated seconds | Saturation percentage |
|---|---|---|---|
| A | 6926 | 39 | 0.563096% |
| B | 6926 | 29 | 0.418712% |
| C | 6926 | 14 | 0.202137% |
| D | 6926 | 75 | 1.082876% |
Noise dominated data is calculated using 1-second bins in cleaned event files. If a bin has >2000 counts, and if more than 50% of those come from <1% of pixels, then it is considered to be noise-dominated and hence unusable.
| Quadrant | # 1 sec bins | Bins with >0 counts | Bins with >2000 counts | High rate bins dominated by noise | Noise dominated (total time) | Noise dominated (detector-on time) | Marked lightcurve |
|---|---|---|---|---|---|---|---|
| A | 7536 | 6926 | 191 | 191 | 2.53% | 2.76% | 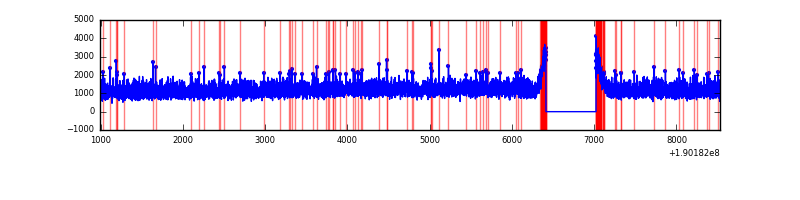 |
| B | 7536 | 6927 | 191 | 191 | 2.53% | 2.76% | 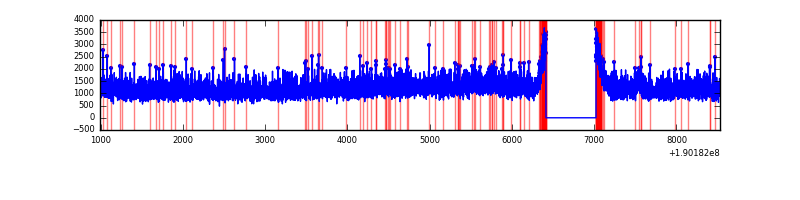 |
| C | 7536 | 6927 | 130 | 130 | 1.73% | 1.88% | 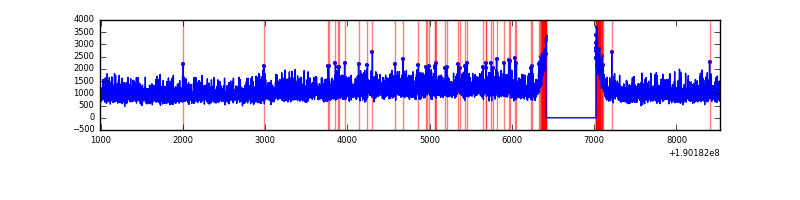 |
| D | 7536 | 6927 | 304 | 304 | 4.03% | 4.39% | 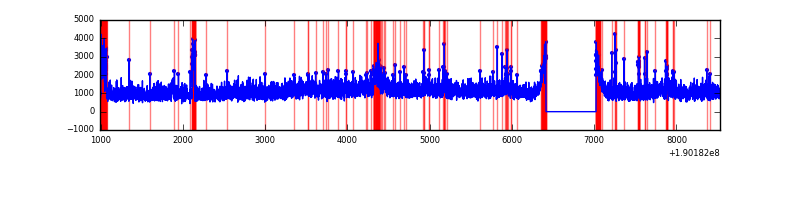 |
Top three noisy pixels from each quadrant. If the there are fewer than three noisy pixels in the level2.evt file, extra rows are filled as -1
| Pixel properties | Quadrant properties | ||||||
|---|---|---|---|---|---|---|---|
| Quadrant | DetID | PixID | Counts | Sigma | Mean | Median | Sigma |
| A | 12 | 251 | 13153 | 21.23 | 2140 | 2160 | 517.8 |
| A | 10 | 2 | 8364 | 11.98 | 2140 | 2160 | 517.8 |
| A | 8 | 14 | 5663 | 6.77 | 2140 | 2160 | 517.8 |
| B | 0 | 220 | 24941 | 43.51 | 2201 | 2215 | 522.3 |
| B | 4 | 216 | 9171 | 13.32 | 2201 | 2215 | 522.3 |
| B | 4 | 52 | 7930 | 10.94 | 2201 | 2215 | 522.3 |
| C | 8 | 208 | 11943 | 17.97 | 1966 | 2035 | 551.4 |
| C | 7 | 159 | 8569 | 11.85 | 1966 | 2035 | 551.4 |
| C | 14 | 223 | 5250 | 5.83 | 1966 | 2035 | 551.4 |
| D | 10 | 84 | 232549 | 384.69 | 1924 | 1992 | 599.3 |
| D | 13 | 105 | 200443 | 331.12 | 1924 | 1992 | 599.3 |
| D | 12 | 33 | 90184 | 147.15 | 1924 | 1992 | 599.3 |
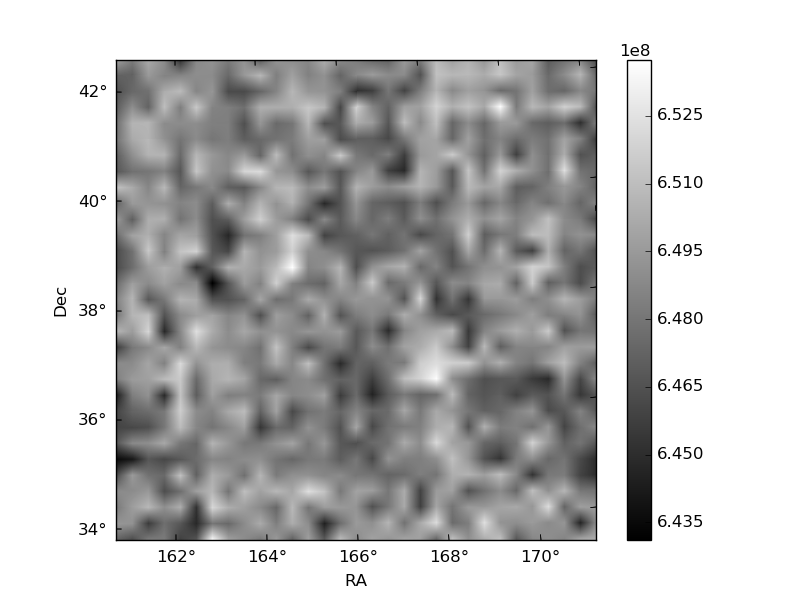
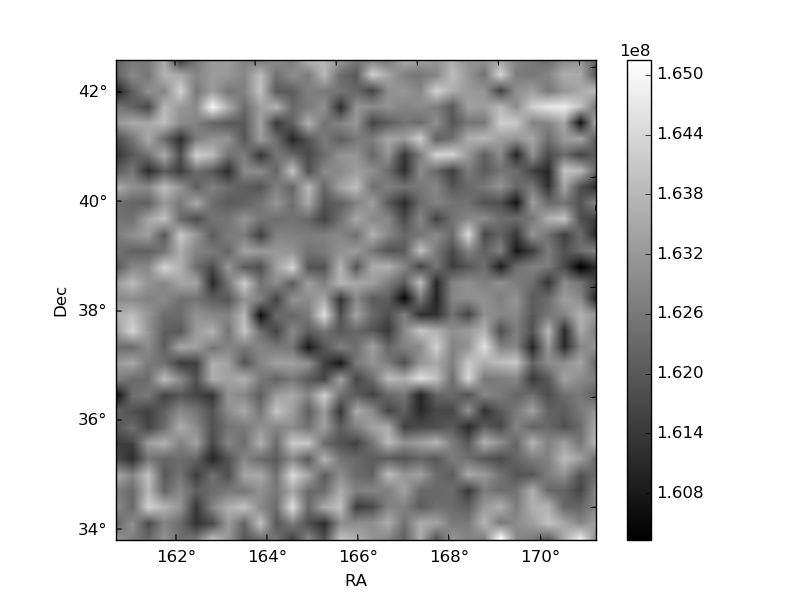
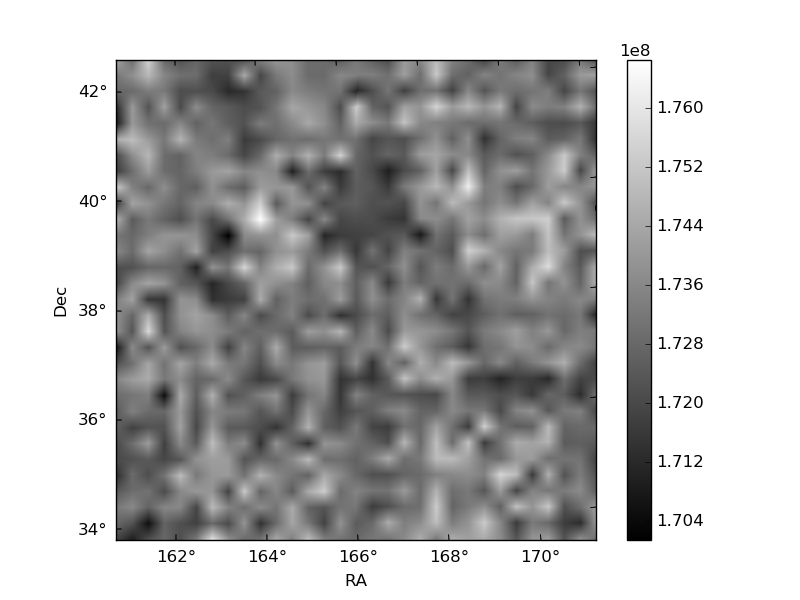
Histogram calculated using DETX and DETY for each event in the final _common_clean file
| Quadrant A | 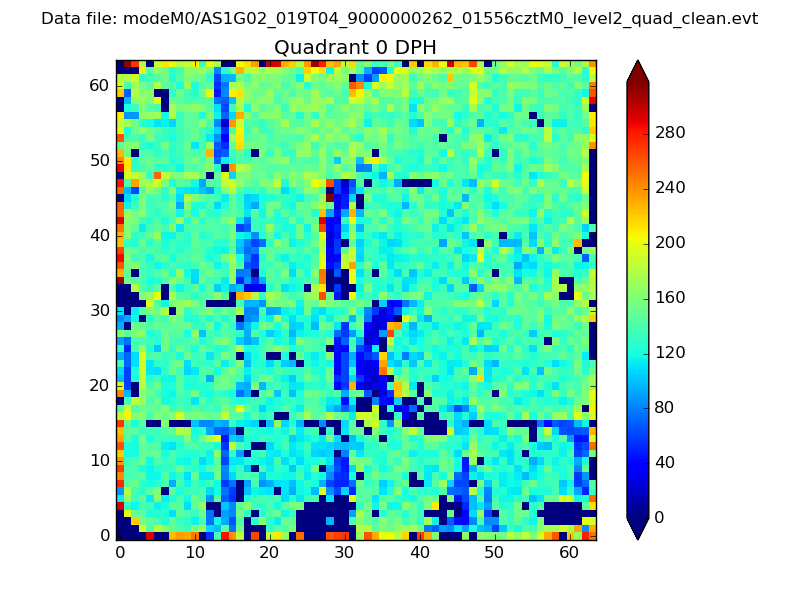 |
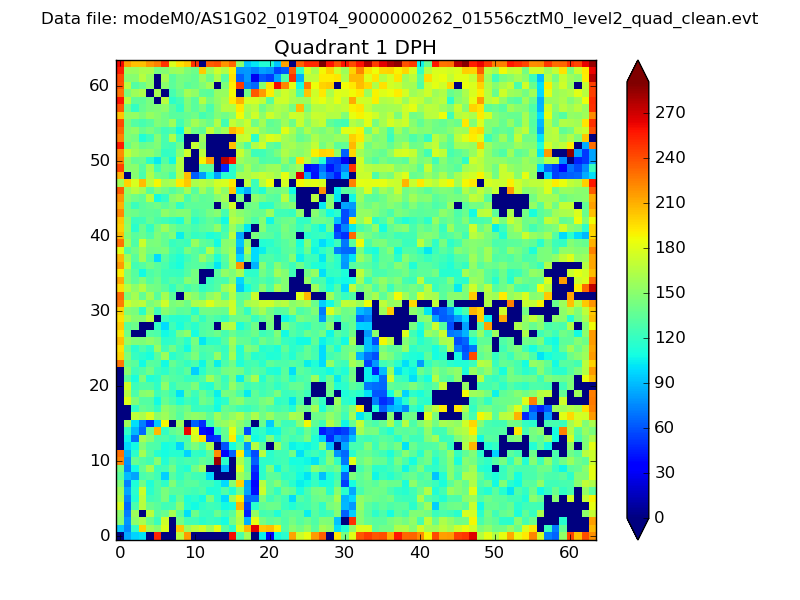 |
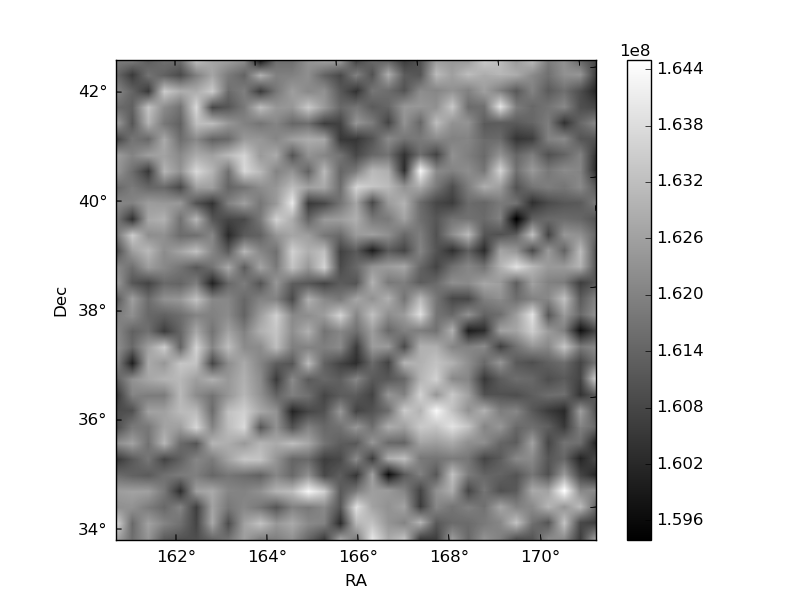
Quadrant B |
|---|---|---|---|
| Quadrant D | 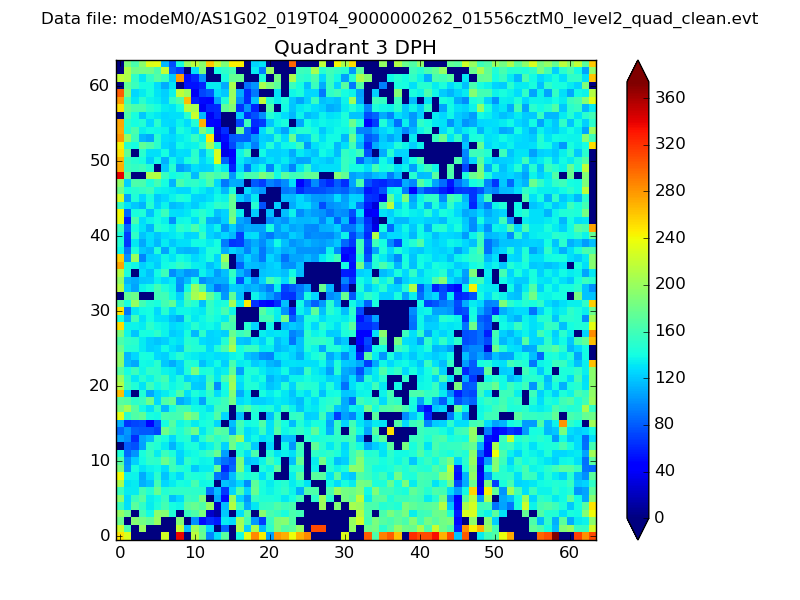 |
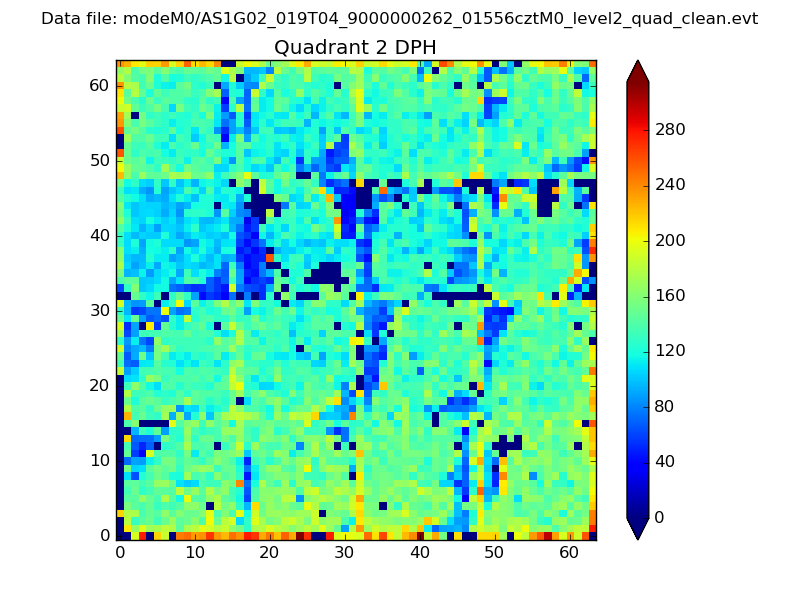 |
Quadrant C |
| Plot type | Count rate plots | Images |
|---|---|---|
| Comparison with Poisson distribution Blue bars denote a histogram of data divided into 1 sec bins. Red curve is a Poisson curve with rate = median count rate of data. |
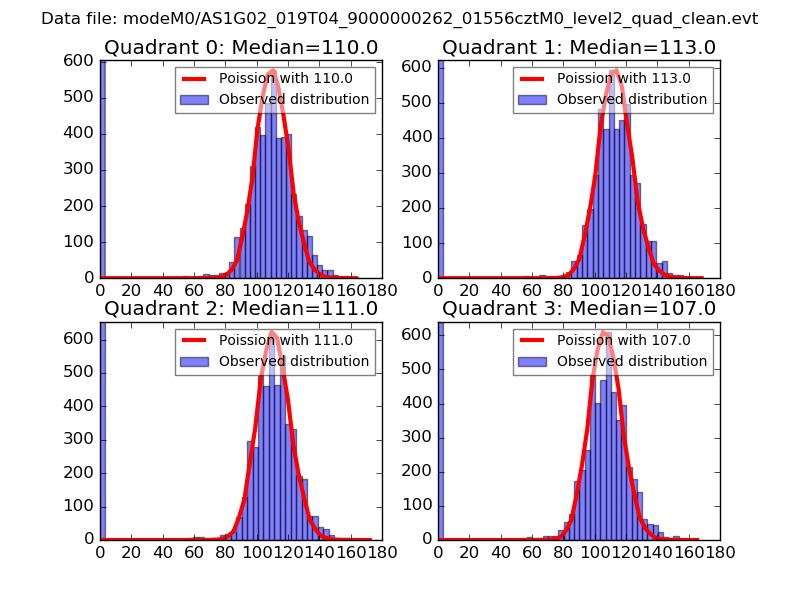 |
 |
| Quadrant-wise count rates Data is divided into 100 sec bins |
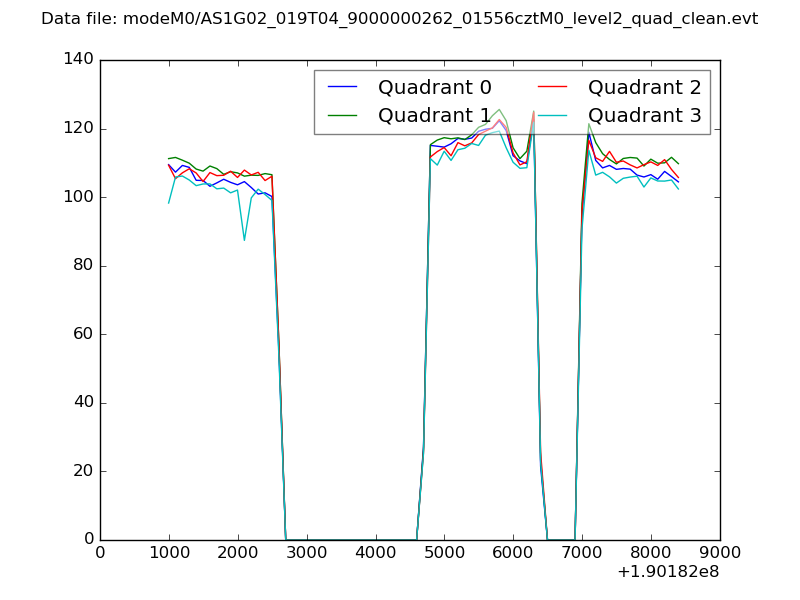 |
|
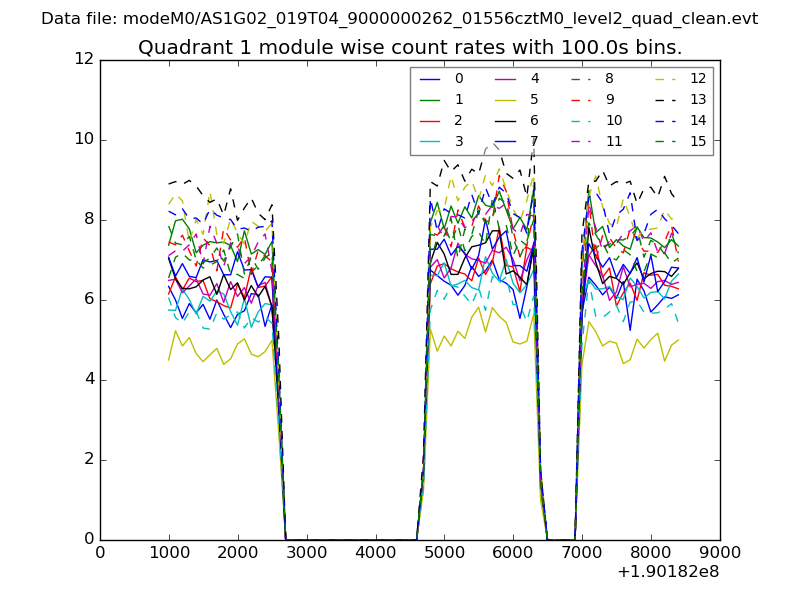
| Module-wise count rates for Quadrant A Data is divided into 100 sec bins |
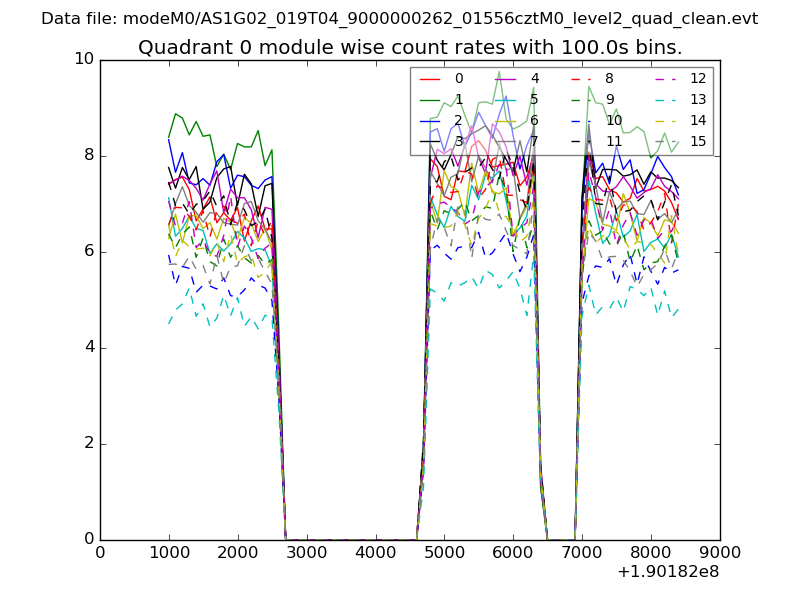 |
 |
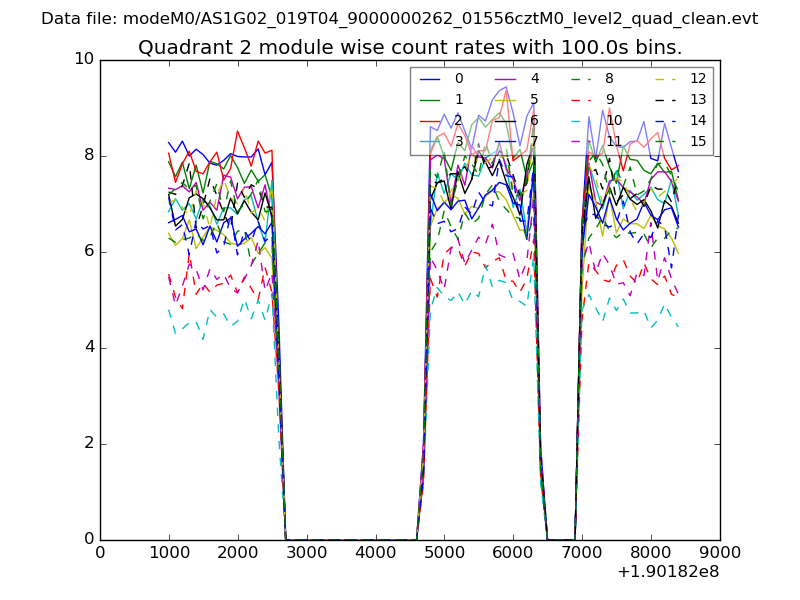
| Module-wise count rates for Quadrant B Data is divided into 100 sec bins |
 |
 |
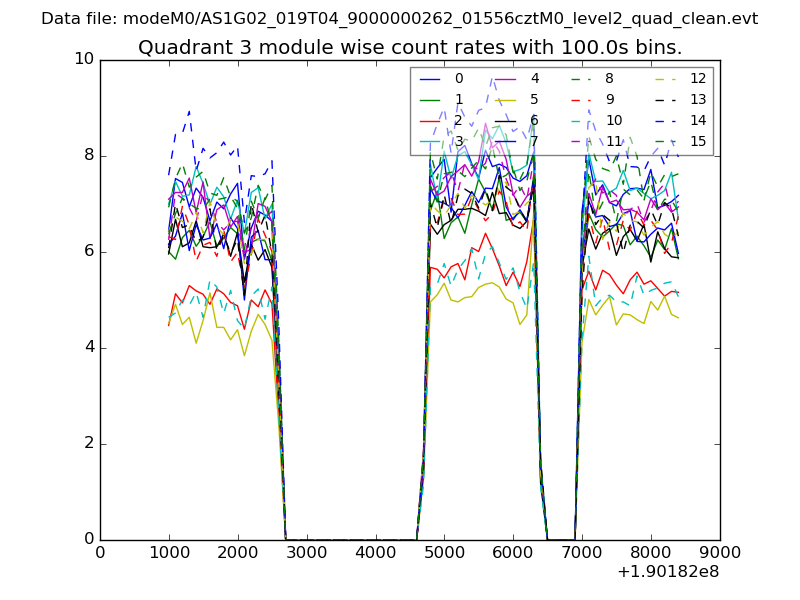
| Module-wise count rates for Quadrant C Data is divided into 100 sec bins |
 |
 |
| Module-wise count rates for Quadrant D Data is divided into 100 sec bins |
 |
 |
| Parameter | Plot |
|---|---|
| CZT HV Monitor | 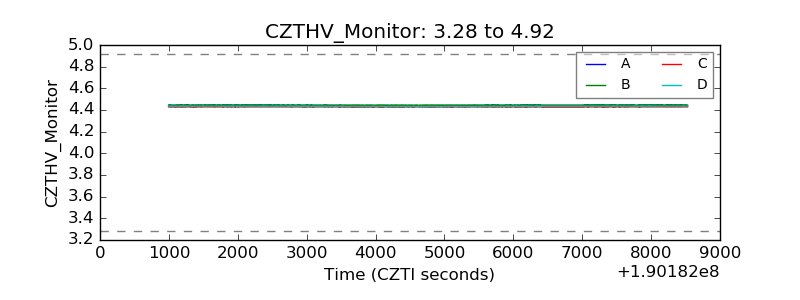 |
| D_VDD |  |
| Temperature 1 | 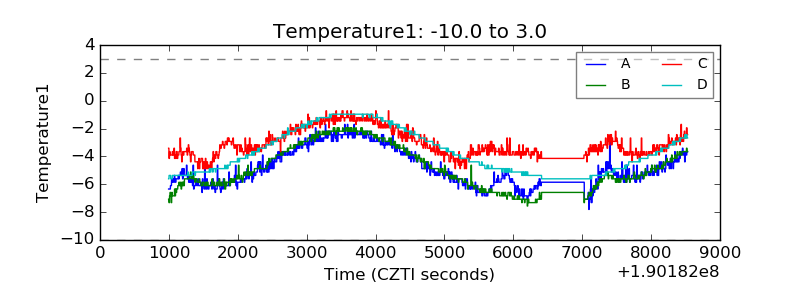 |
| Veto HV Monitor | 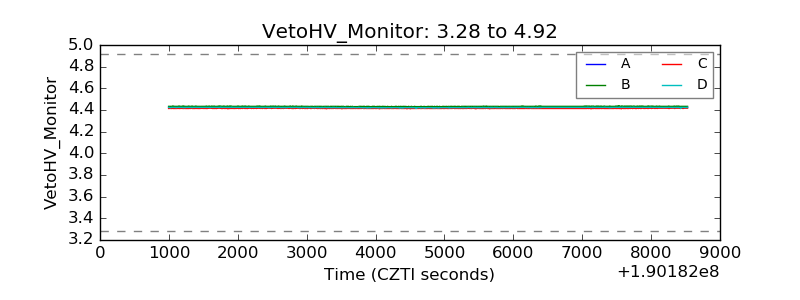 |
| Veto LLD | 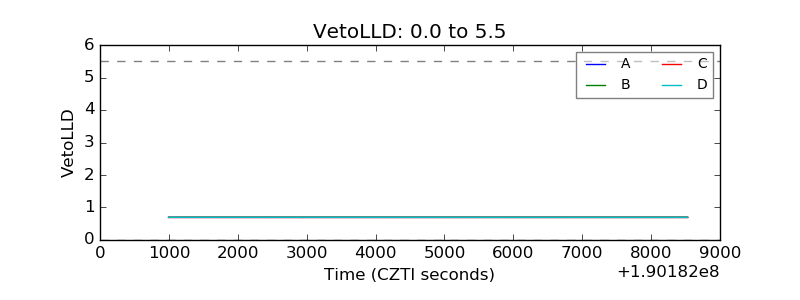 |
| Alpha Counter | 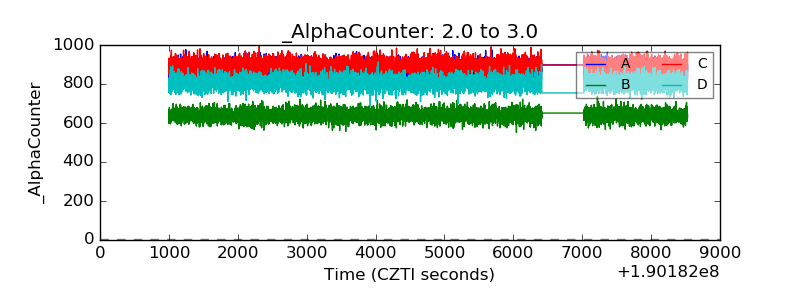 |
| _CPM_Rate | 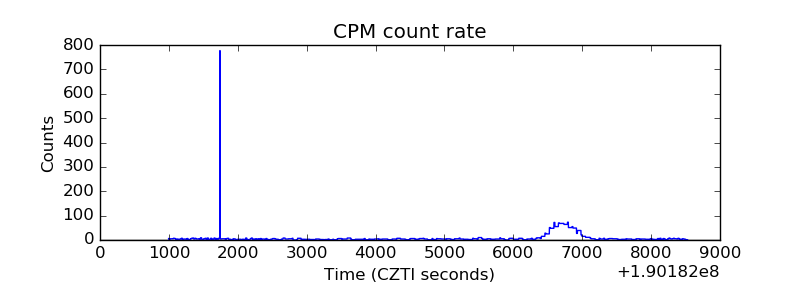 |
| CZT Counter | 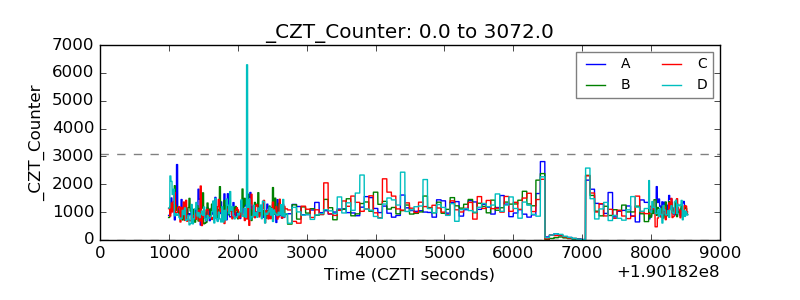 |
| +2.5 Volts monitor |  |
| +5 Volts monitor |  |
| _ROLL_ROT | 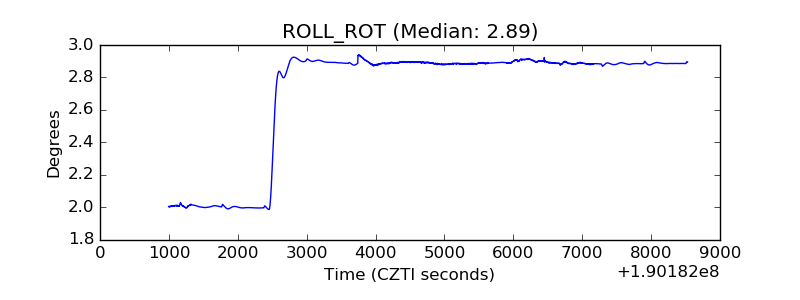 |
| _Roll_DEC | 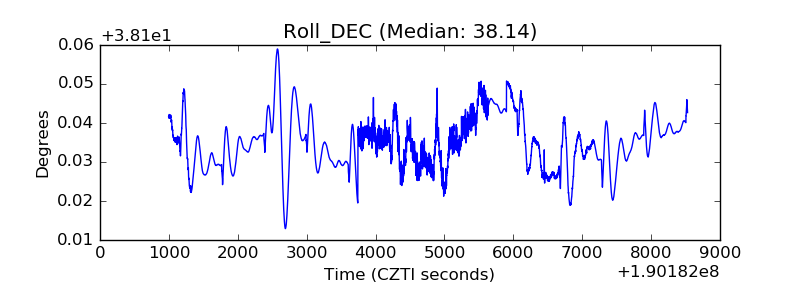 |
| _Roll_RA | 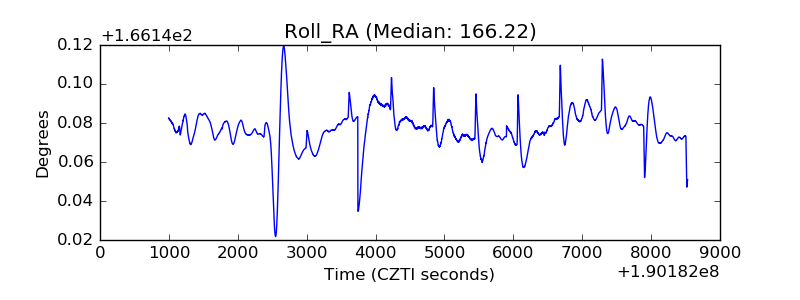 |
| Veto Counter | 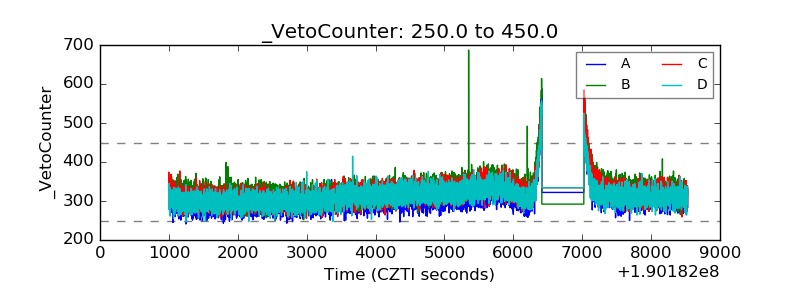 |