| Param | Original file | Final file |
|---|---|---|
| Filename | modeM0/AS1G02_019T04_9000000262_01557cztM0_level2.evt | modeM0/AS1G02_019T04_9000000262_01557cztM0_level2_quad_clean.evt |
| Size (bytes) | 1,043,982,720 | 75,741,120 |
| Size | 995.6 MB | 72.2 MB |
| Events in quadrant A | 7,882,051 | 458,701 |
| Events in quadrant B | 8,090,159 | 467,898 |
| Events in quadrant C | 7,626,695 | 461,270 |
| Events in quadrant D | 7,581,557 | 446,720 |
| Mode M9 | |||
|---|---|---|---|
| Quadrant | BADHDUFLAG | Total packets | Discarded packets |
| A | 0 | 9 | 0 |
| B | 0 | 9 | 0 |
| C | 0 | 9 | 0 |
| D | 0 | 9 | 0 |
| Mode SS | |||
|---|---|---|---|
| Quadrant | BADHDUFLAG | Total packets | Discarded packets |
| A | 0 | 132 | 0 |
| B | 0 | 132 | 0 |
| C | 0 | 132 | 0 |
| D | 0 | 132 | 0 |
| Mode M0 | |||
|---|---|---|---|
| Quadrant | BADHDUFLAG | Total packets | Discarded packets |
| A | 0 | 28099 | 2 |
| B | 0 | 28720 | 1 |
| C | 0 | 27334 | 1 |
| D | 0 | 27202 | 1 |
| Quadrant | Total seconds | Saturated seconds | Saturation percentage |
|---|---|---|---|
| A | 6586 | 30 | 0.455512% |
| B | 6586 | 23 | 0.349226% |
| C | 6586 | 63 | 0.956575% |
| D | 6586 | 114 | 1.730944% |
Noise dominated data is calculated using 1-second bins in cleaned event files. If a bin has >2000 counts, and if more than 50% of those come from <1% of pixels, then it is considered to be noise-dominated and hence unusable.
| Quadrant | # 1 sec bins | Bins with >0 counts | Bins with >2000 counts | High rate bins dominated by noise | Noise dominated (total time) | Noise dominated (detector-on time) | Marked lightcurve |
|---|---|---|---|---|---|---|---|
| A | 7401 | 6587 | 161 | 161 | 2.18% | 2.44% | 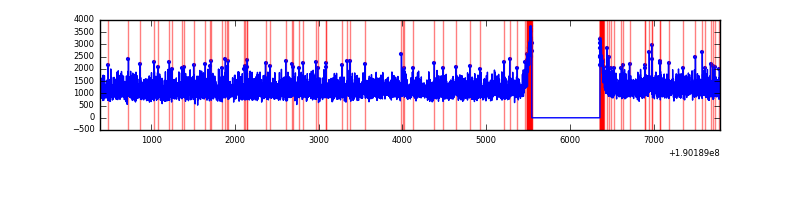 |
| B | 7401 | 6587 | 181 | 181 | 2.45% | 2.75% | 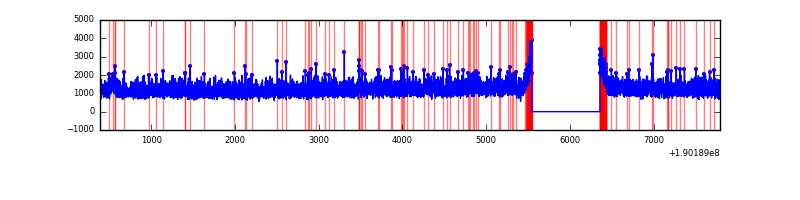 |
| C | 7401 | 6587 | 196 | 196 | 2.65% | 2.98% | 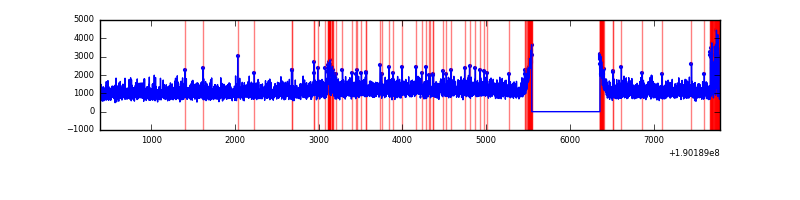 |
| D | 7401 | 6587 | 229 | 229 | 3.09% | 3.48% | 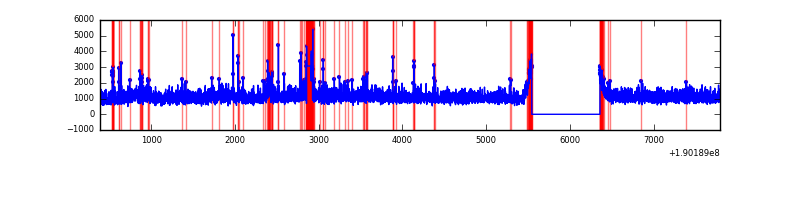 |
Top three noisy pixels from each quadrant. If the there are fewer than three noisy pixels in the level2.evt file, extra rows are filled as -1
| Pixel properties | Quadrant properties | ||||||
|---|---|---|---|---|---|---|---|
| Quadrant | DetID | PixID | Counts | Sigma | Mean | Median | Sigma |
| A | 10 | 2 | 7899 | 11.7 | 2059 | 2075 | 497.8 |
| A | 13 | 9 | 5058 | 5.99 | 2059 | 2075 | 497.8 |
| A | -1 | -1 | -1 | -1.0 | 2059 | 2075 | 497.8 |
| B | 0 | 220 | 26022 | 47.61 | 2123 | 2136 | 501.7 |
| B | 4 | 170 | 13611 | 22.87 | 2123 | 2136 | 501.7 |
| B | 0 | 234 | 8581 | 12.85 | 2123 | 2136 | 501.7 |
| C | 14 | 223 | 209586 | 390.14 | 1899 | 1970 | 532.2 |
| C | 8 | 208 | 5870 | 7.33 | 1899 | 1970 | 532.2 |
| C | 5 | 172 | 5187 | 6.04 | 1899 | 1970 | 532.2 |
| D | 13 | 105 | 365010 | 631.18 | 1850 | 1917 | 575.3 |
| D | 10 | 84 | 122413 | 209.46 | 1850 | 1917 | 575.3 |
| D | 13 | 53 | 81757 | 138.79 | 1850 | 1917 | 575.3 |
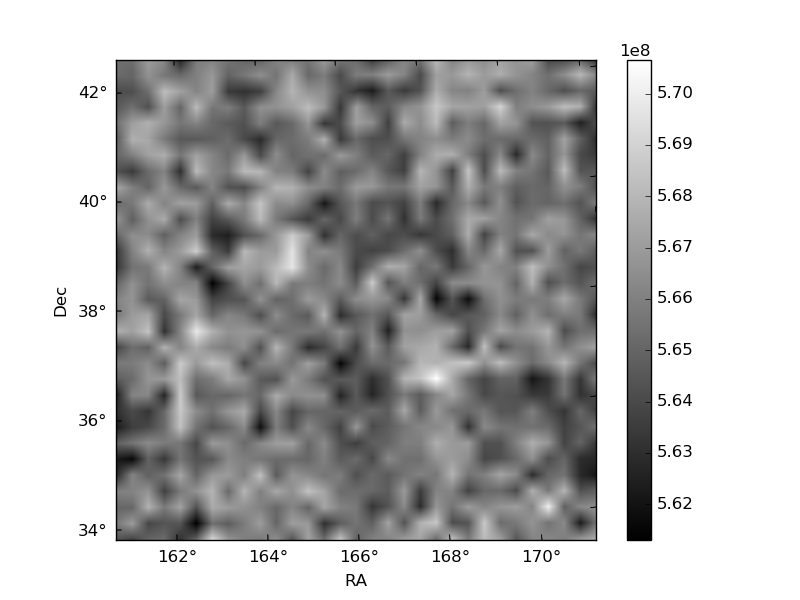
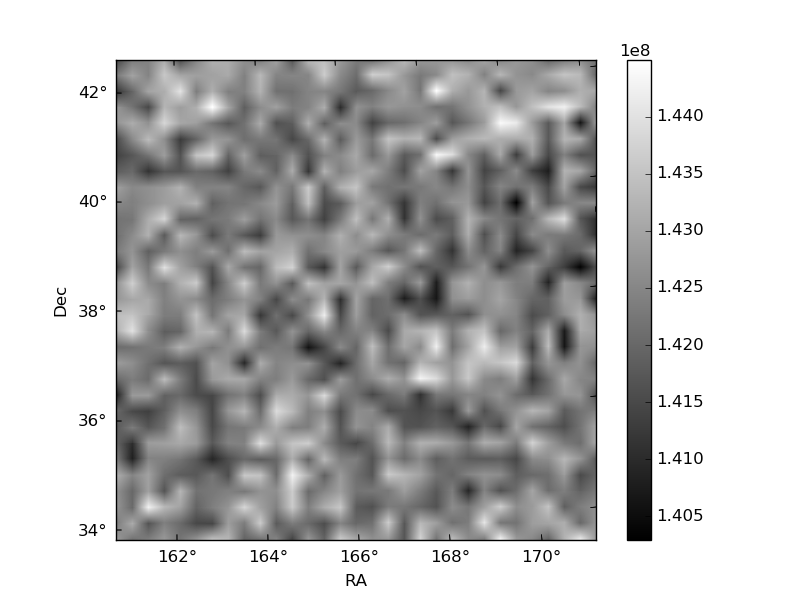
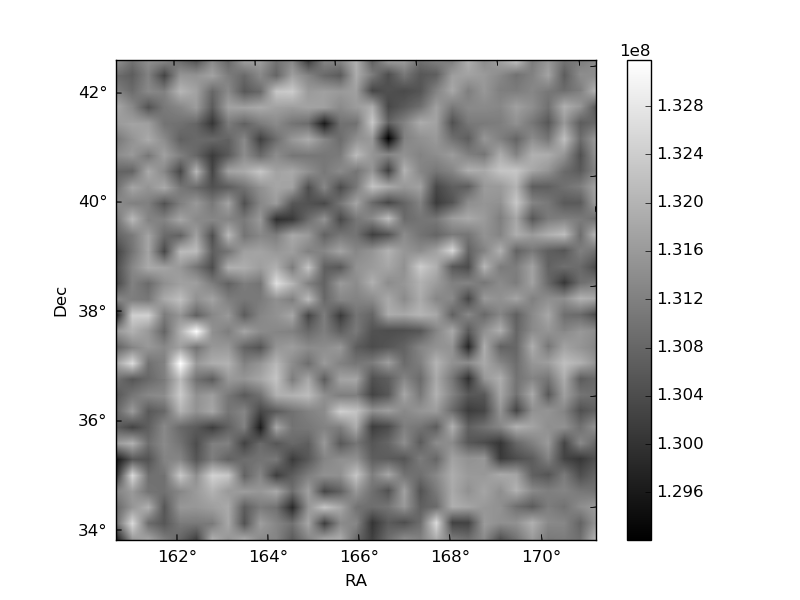
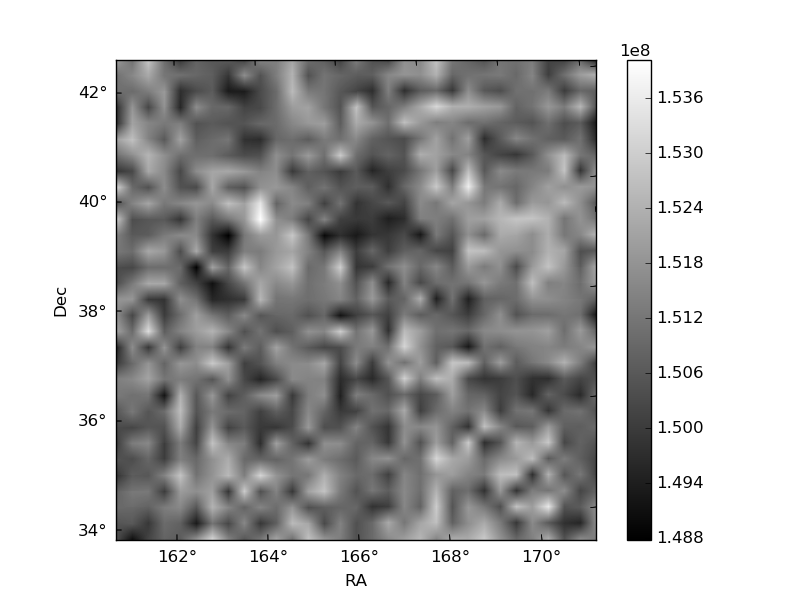
Histogram calculated using DETX and DETY for each event in the final _common_clean file
| Quadrant A | 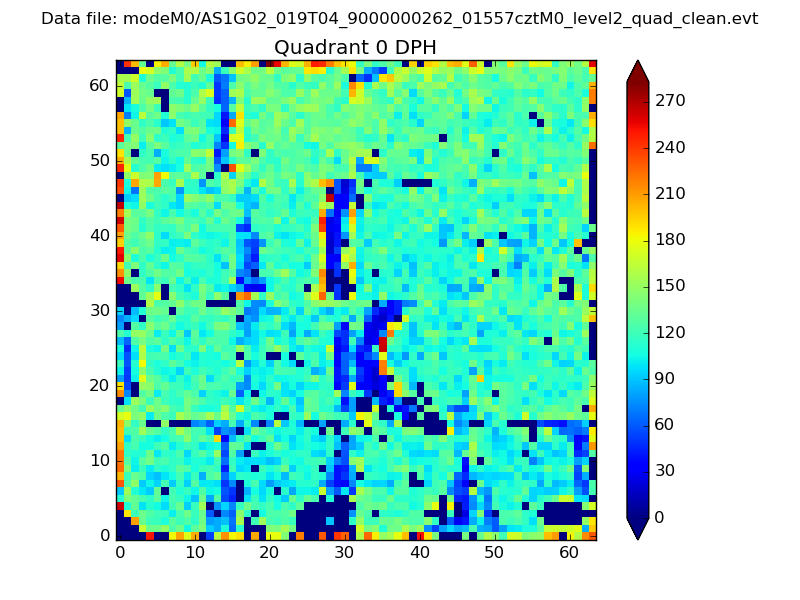 |
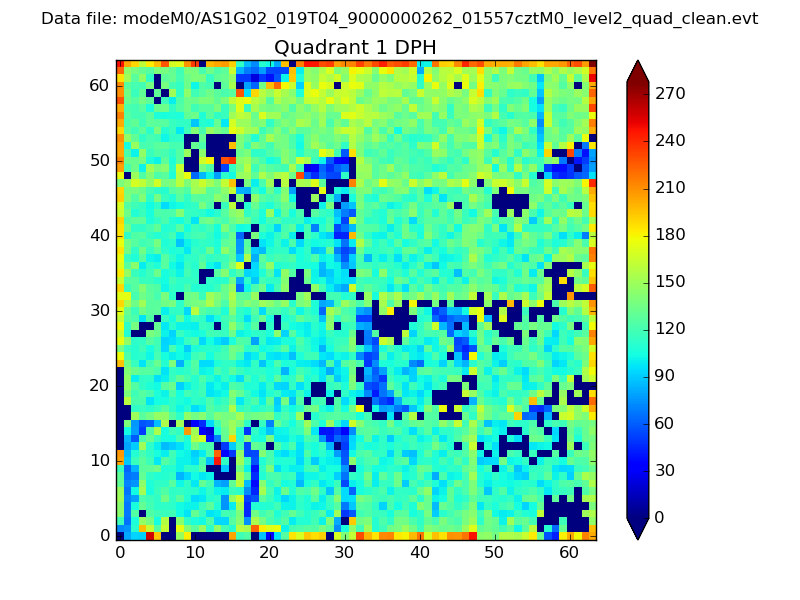 |
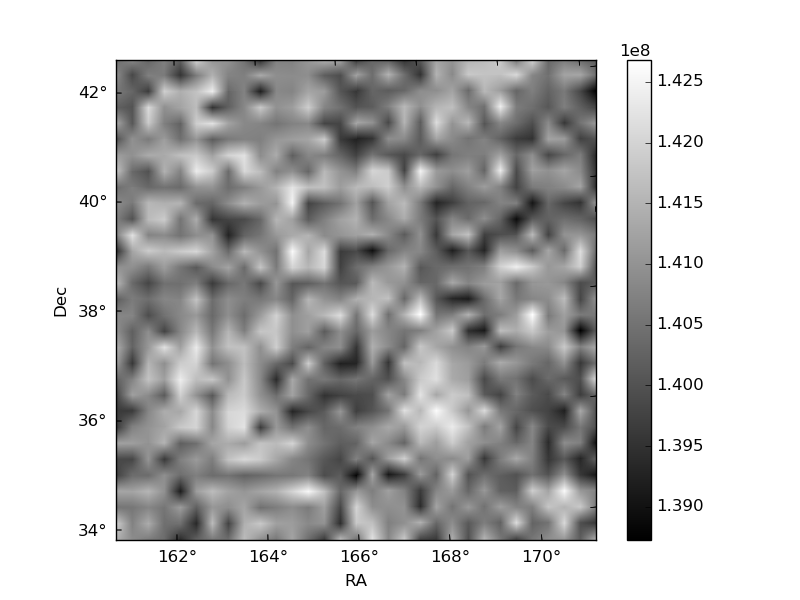
Quadrant B |
|---|---|---|---|
| Quadrant D | 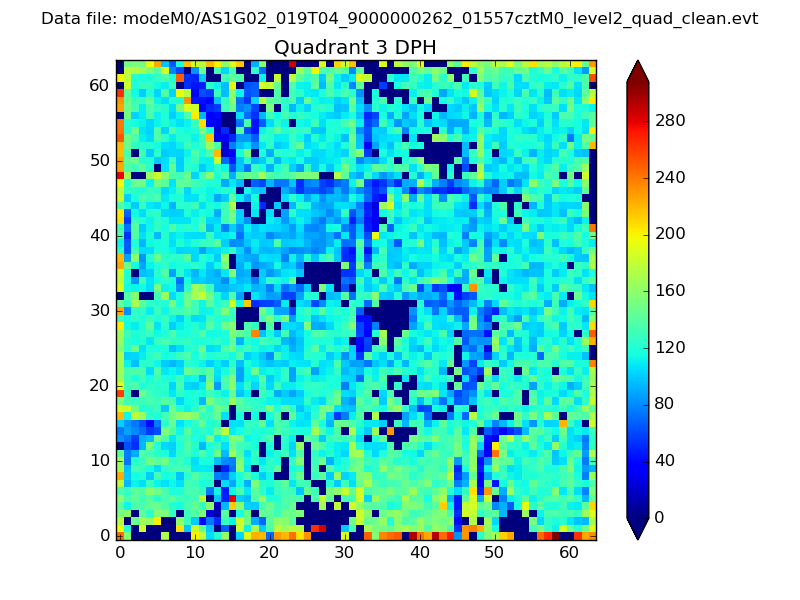 |
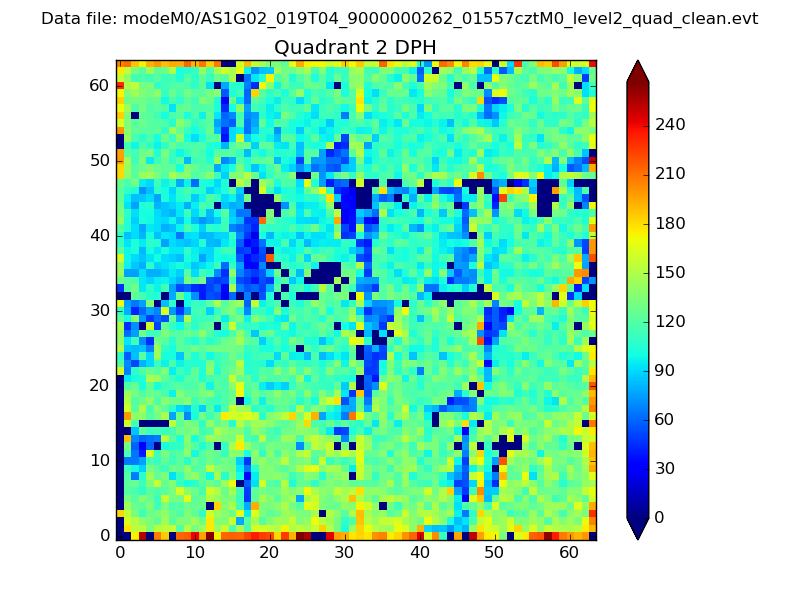 |
Quadrant C |
| Plot type | Count rate plots | Images |
|---|---|---|
| Comparison with Poisson distribution Blue bars denote a histogram of data divided into 1 sec bins. Red curve is a Poisson curve with rate = median count rate of data. |
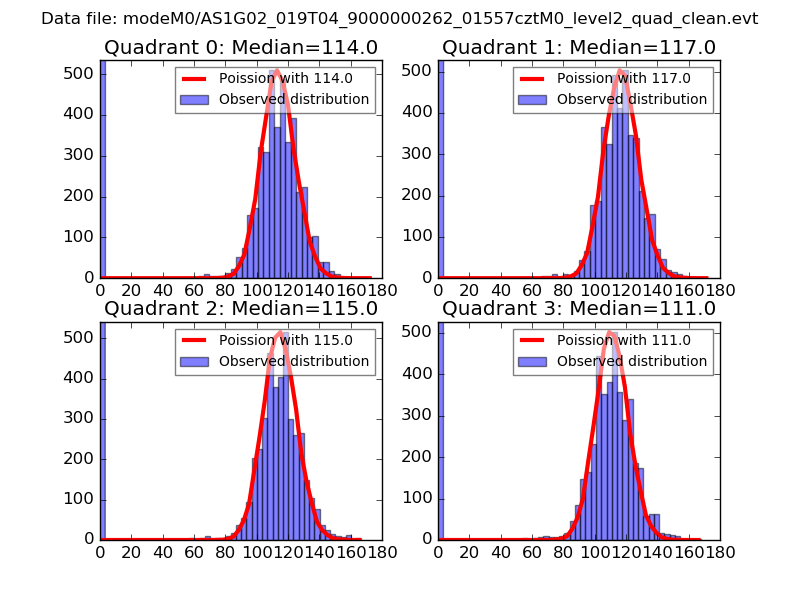 |
 |
| Quadrant-wise count rates Data is divided into 100 sec bins |
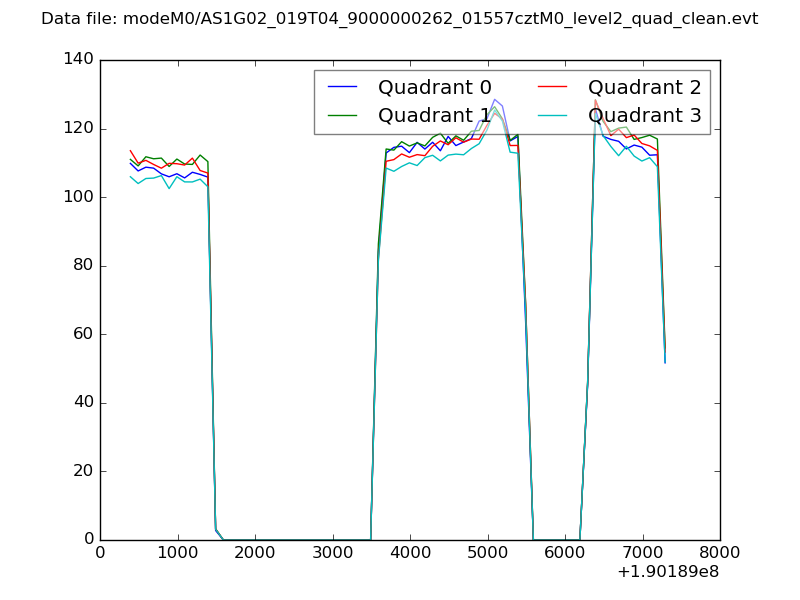 |
|
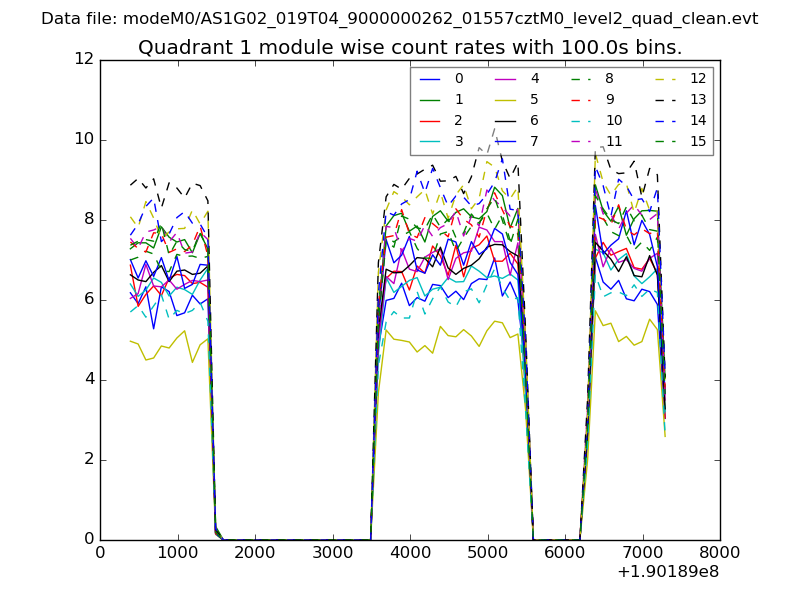
| Module-wise count rates for Quadrant A Data is divided into 100 sec bins |
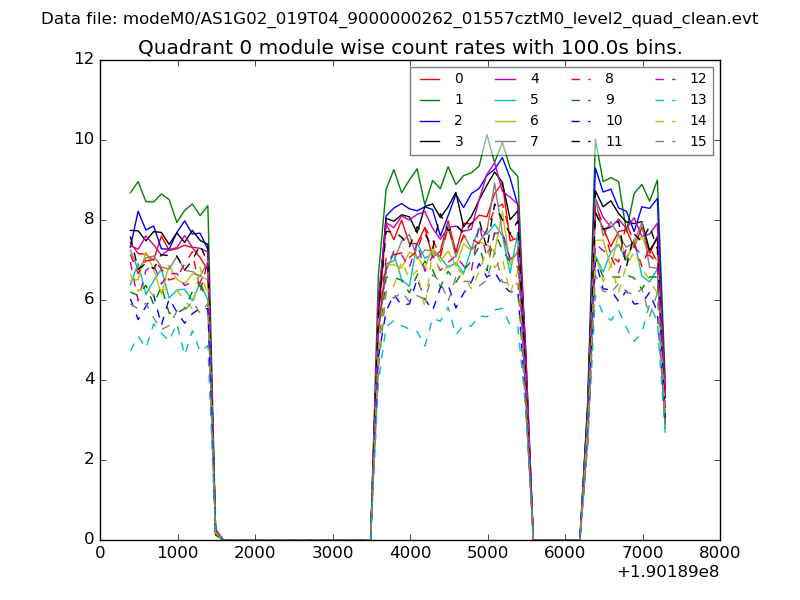 |
 |
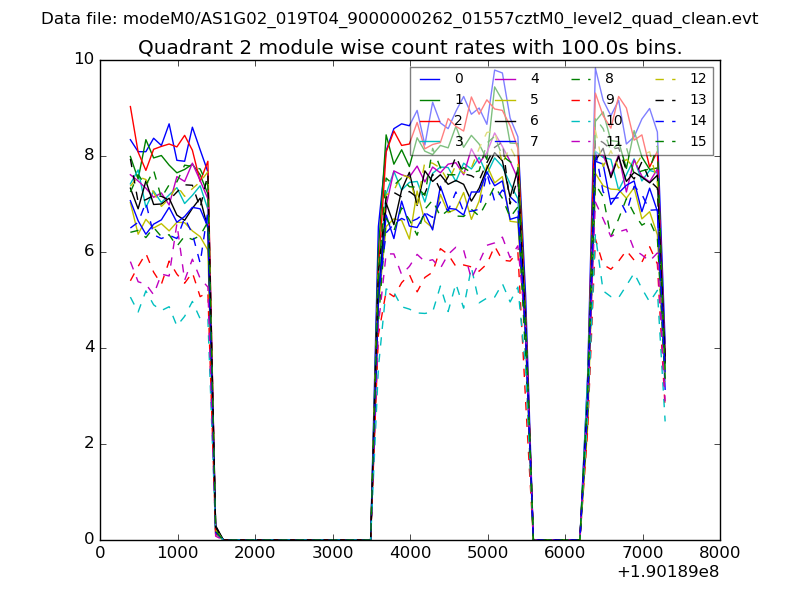
| Module-wise count rates for Quadrant B Data is divided into 100 sec bins |
 |
 |
| Module-wise count rates for Quadrant C Data is divided into 100 sec bins |
 |
 |
| Module-wise count rates for Quadrant D Data is divided into 100 sec bins |
 |
 |
| Parameter | Plot |
|---|---|
| CZT HV Monitor | 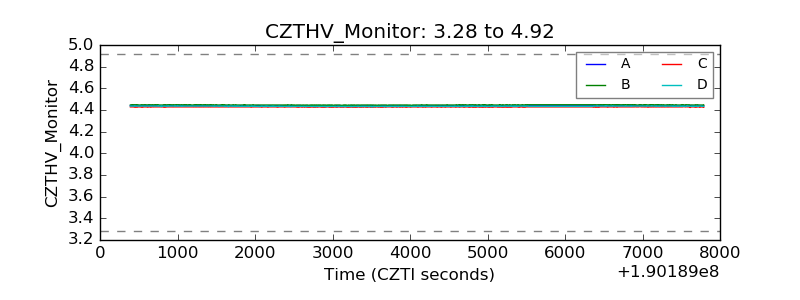 |
| D_VDD | 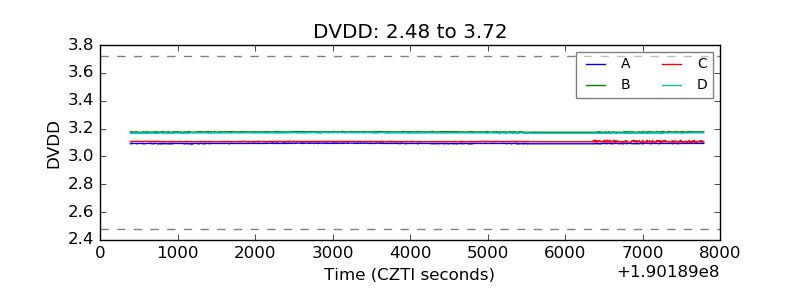 |
| Temperature 1 | 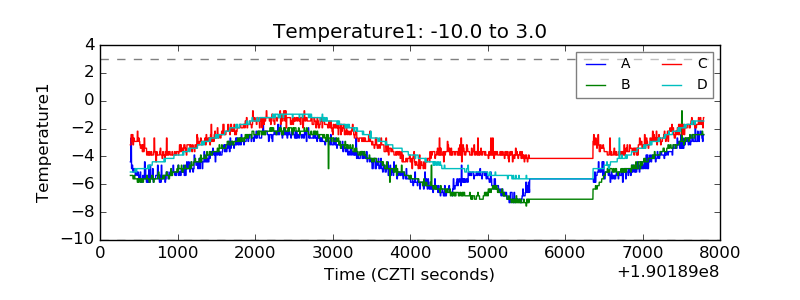 |
| Veto HV Monitor | 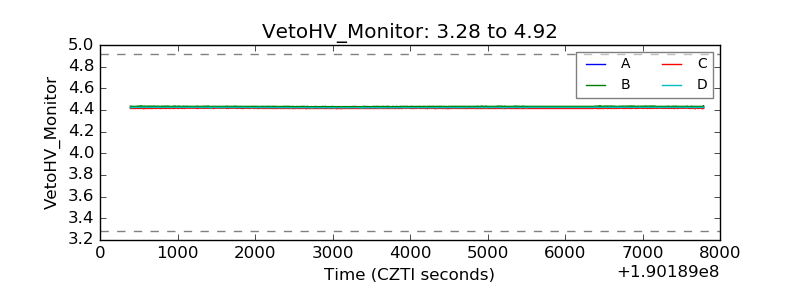 |
| Veto LLD | 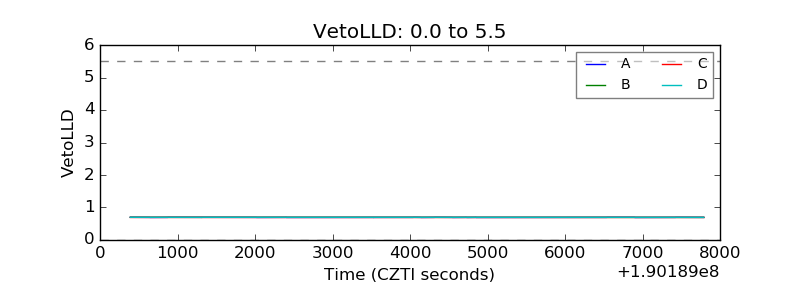 |
| Alpha Counter | 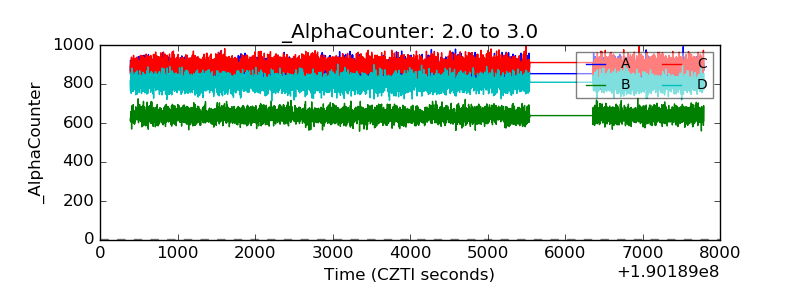 |
| _CPM_Rate | 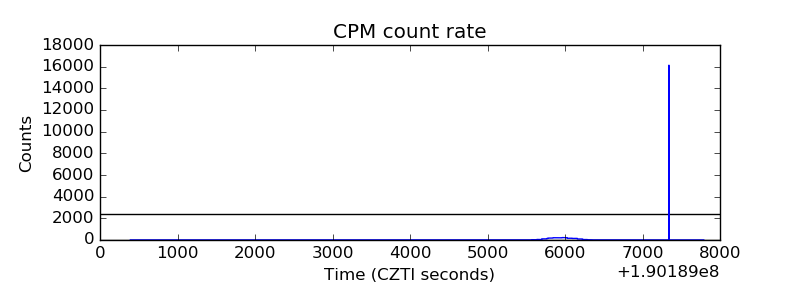 |
| CZT Counter | 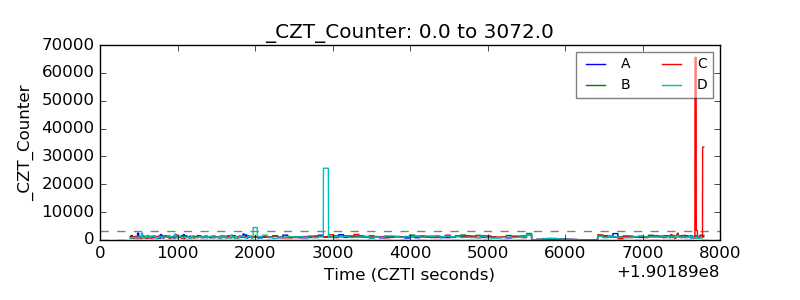 |
| +2.5 Volts monitor |  |
| +5 Volts monitor |  |
| _ROLL_ROT | 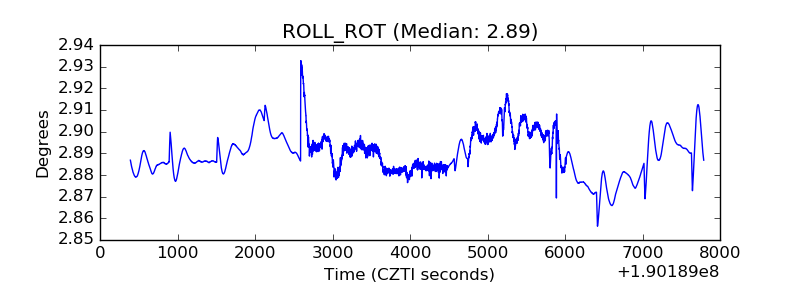 |
| _Roll_DEC | 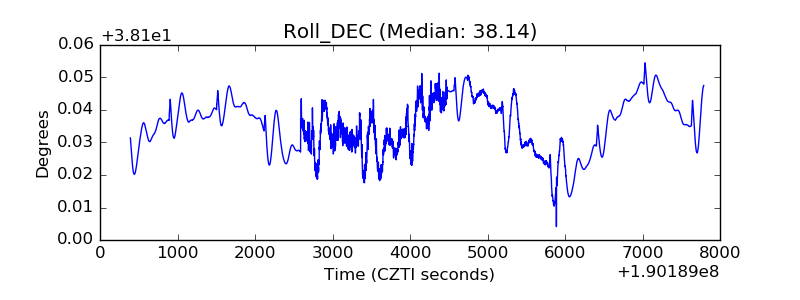 |
| _Roll_RA | 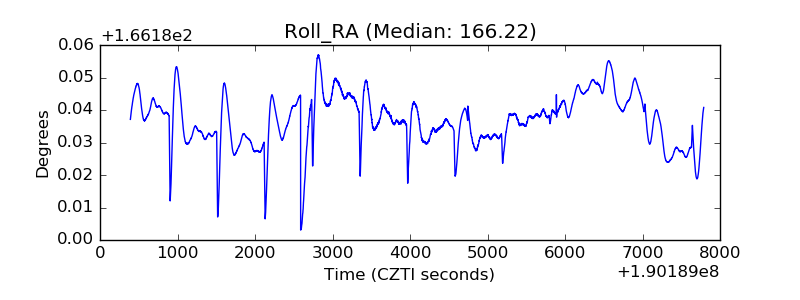 |
| Veto Counter | 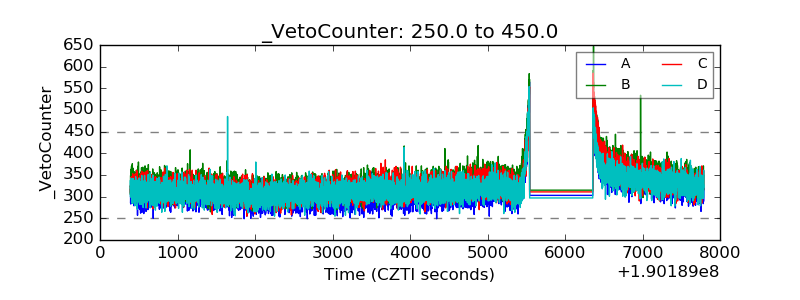 |