| Param | Original file | Final file |
|---|---|---|
| Filename | modeM0/AS1G02_019T04_9000000262_01560cztM0_level2.evt | modeM0/AS1G02_019T04_9000000262_01560cztM0_level2_quad_clean.evt |
| Size (bytes) | 13,593,600 | 855,360 |
| Size | 13.0 MB | 835.3 KB |
| Events in quadrant A | 93,784 | 2,277 |
| Events in quadrant B | 94,417 | 2,074 |
| Events in quadrant C | 118,265 | 3,453 |
| Events in quadrant D | 95,176 | 2,355 |
| Mode SS | |||
|---|---|---|---|
| Quadrant | BADHDUFLAG | Total packets | Discarded packets |
| A | 0 | 16 | 10 |
| B | 0 | 16 | 12 |
| C | 0 | 16 | 12 |
| D | 0 | 15 | 9 |
| Mode M0 | |||
|---|---|---|---|
| Quadrant | BADHDUFLAG | Total packets | Discarded packets |
| A | 0 | 3642 | 3315 |
| B | 0 | 3606 | 3274 |
| C | 0 | 3460 | 3047 |
| D | 0 | 3758 | 3418 |
| Quadrant | Total seconds | Saturated seconds | Saturation percentage |
|---|---|---|---|
| A | 75 | 0 | 0.000000% |
| B | 79 | 0 | 0.000000% |
| C | 96 | 0 | 0.000000% |
| D | 85 | 0 | 0.000000% |
Noise dominated data is calculated using 1-second bins in cleaned event files. If a bin has >2000 counts, and if more than 50% of those come from <1% of pixels, then it is considered to be noise-dominated and hence unusable.
| Quadrant | # 1 sec bins | Bins with >0 counts | Bins with >2000 counts | High rate bins dominated by noise | Noise dominated (total time) | Noise dominated (detector-on time) | Marked lightcurve |
|---|---|---|---|---|---|---|---|
| A | 706 | 133 | 0 | 0 | 0.00% | 0.00% | 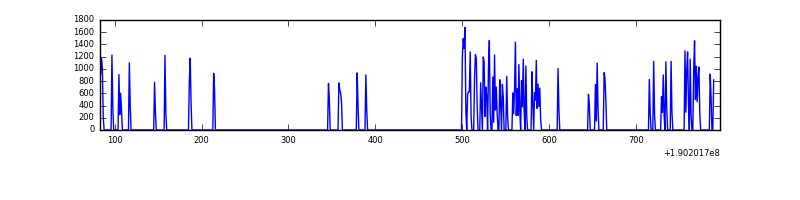 |
| B | 707 | 141 | 0 | 0 | 0.00% | 0.00% | 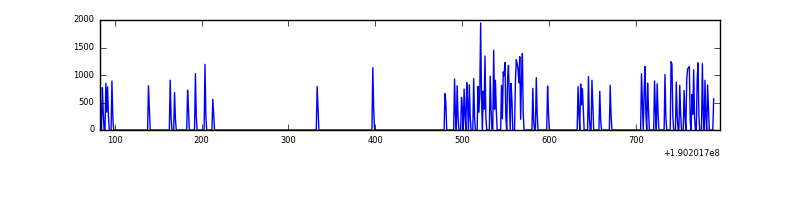 |
| C | 713 | 170 | 1 | 1 | 0.14% | 0.59% | 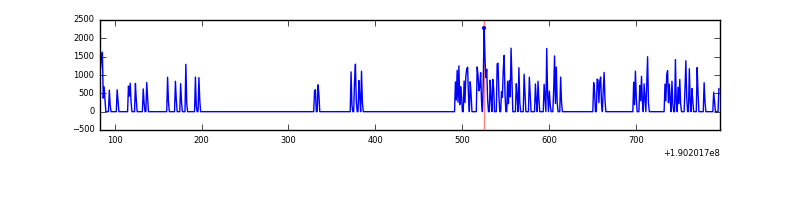 |
| D | 670 | 144 | 0 | 0 | 0.00% | 0.00% | 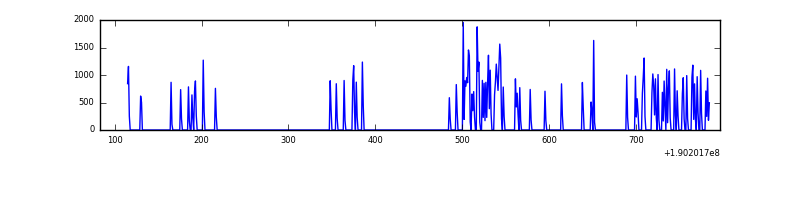 |
Top three noisy pixels from each quadrant. If the there are fewer than three noisy pixels in the level2.evt file, extra rows are filled as -1
| Pixel properties | Quadrant properties | ||||||
|---|---|---|---|---|---|---|---|
| Quadrant | DetID | PixID | Counts | Sigma | Mean | Median | Sigma |
| A | 5 | 203 | 124 | 12.88 | 24 | 24 | 7.8 |
| A | -1 | -1 | -1 | -1.0 | 24 | 24 | 7.8 |
| A | -1 | -1 | -1 | -1.0 | 24 | 24 | 7.8 |
| B | 0 | 220 | 694 | 91.18 | 24 | 24 | 7.3 |
| B | 4 | 200 | 312 | 39.19 | 24 | 24 | 7.3 |
| B | 0 | 190 | 132 | 14.7 | 24 | 24 | 7.3 |
| C | 8 | 229 | 7624 | 788.95 | 28 | 28 | 9.6 |
| C | 8 | 208 | 674 | 67.1 | 28 | 28 | 9.6 |
| C | -1 | -1 | -1 | -1.0 | 28 | 28 | 9.6 |
| D | 7 | 85 | 650 | 69.83 | 24 | 24 | 9.0 |
| D | 13 | 169 | 468 | 49.53 | 24 | 24 | 9.0 |
| D | 2 | 33 | 416 | 43.73 | 24 | 24 | 9.0 |
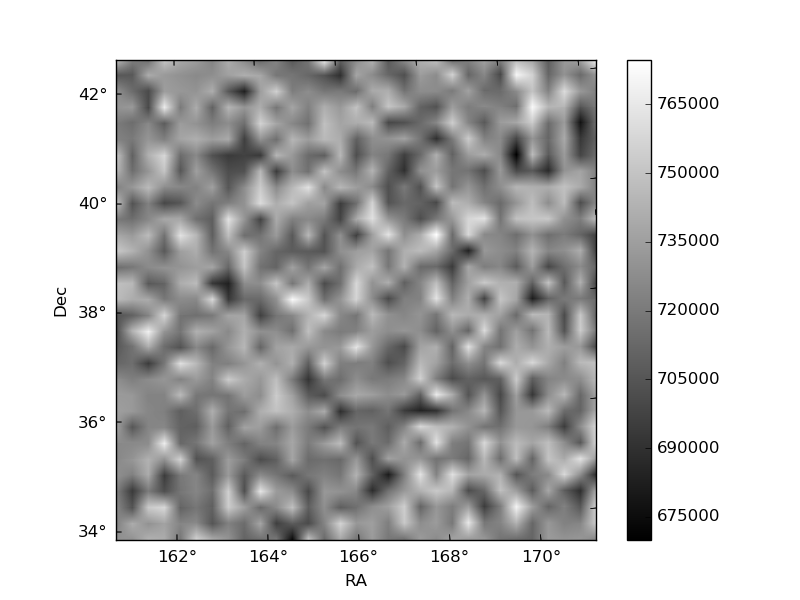
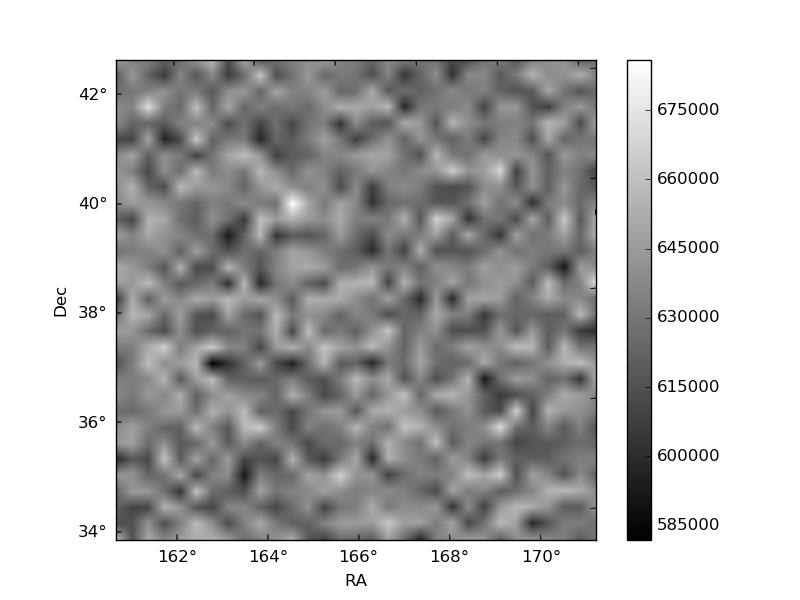
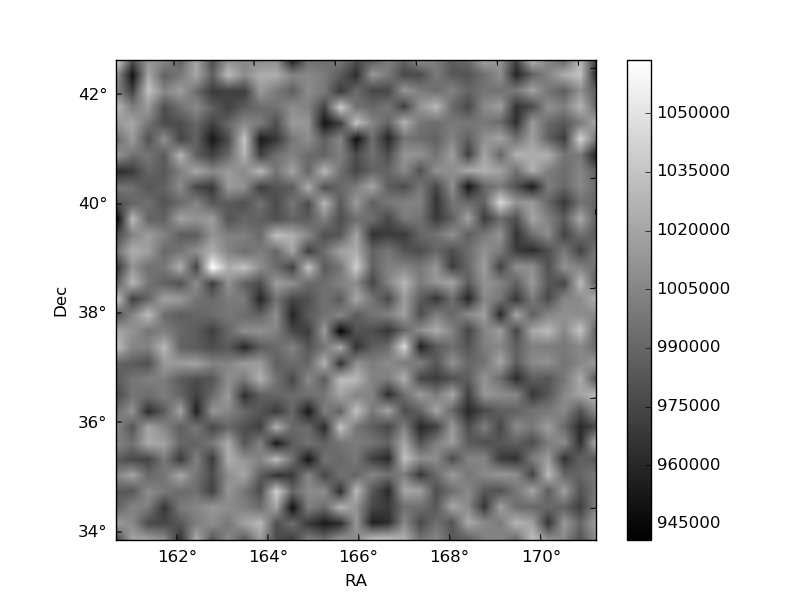
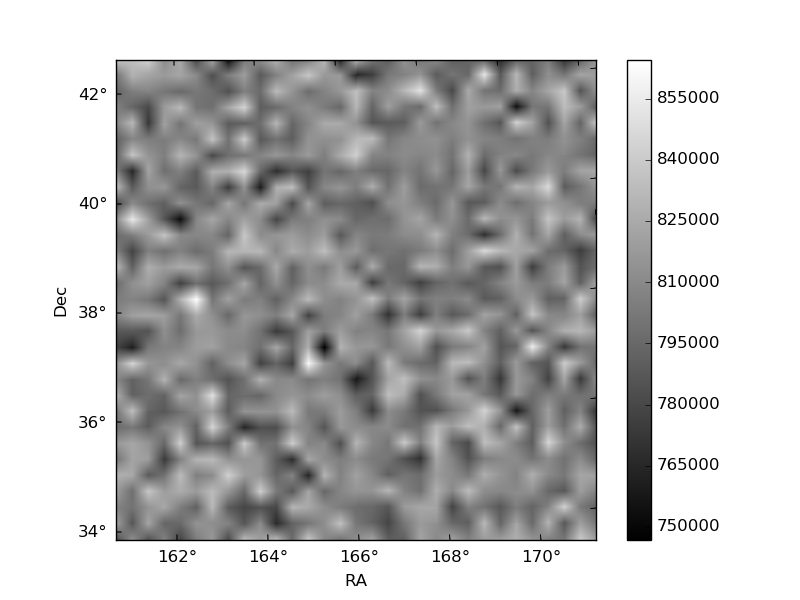
Histogram calculated using DETX and DETY for each event in the final _common_clean file
| Quadrant A | 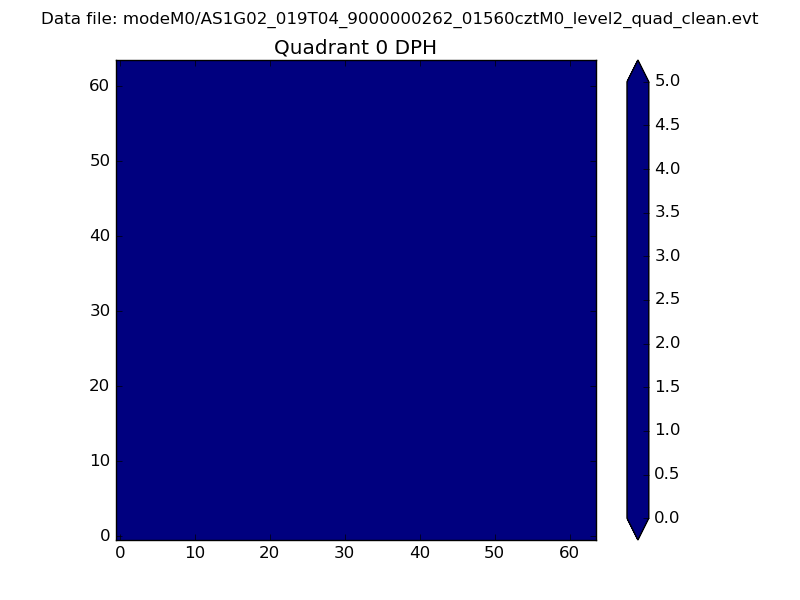 |
 |
Quadrant B |
|---|---|---|---|
| Quadrant D |  |
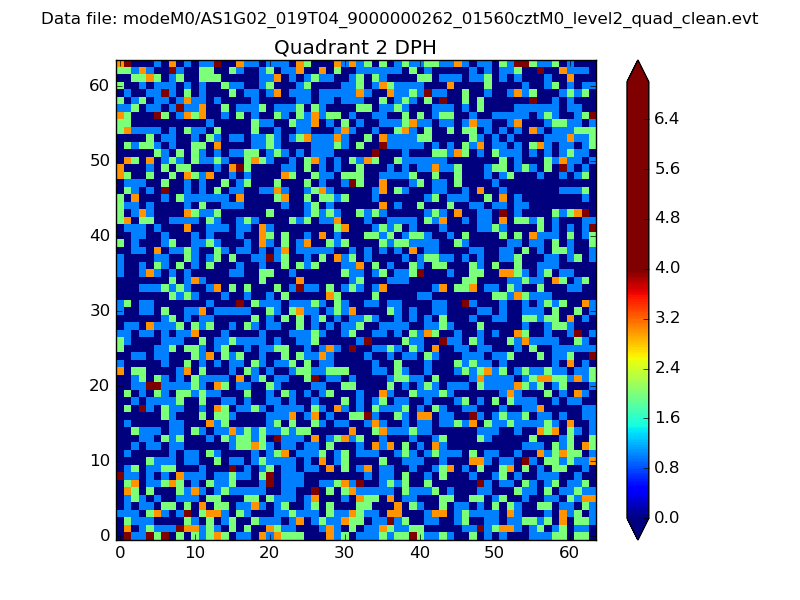 |
Quadrant C |
| Plot type | Count rate plots | Images |
|---|---|---|
| Comparison with Poisson distribution Blue bars denote a histogram of data divided into 1 sec bins. Red curve is a Poisson curve with rate = median count rate of data. |
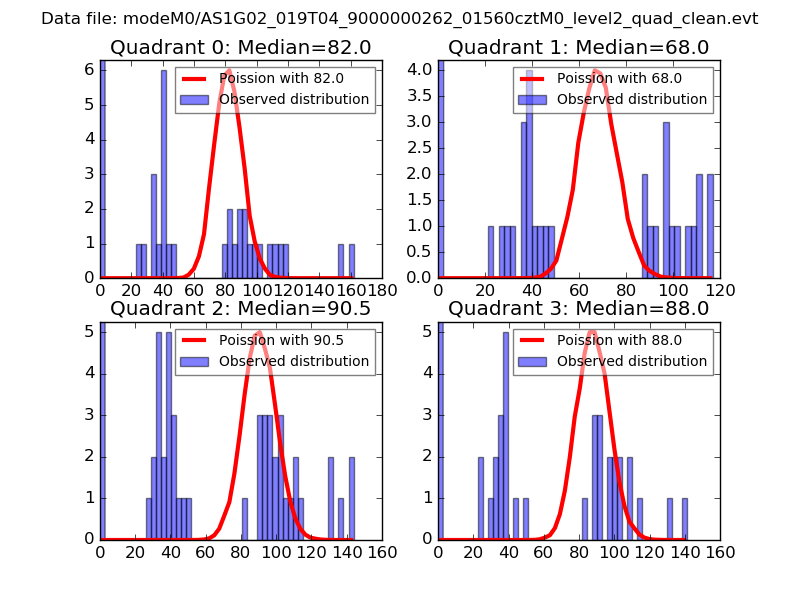 |
 |
| Quadrant-wise count rates Data is divided into 100 sec bins |
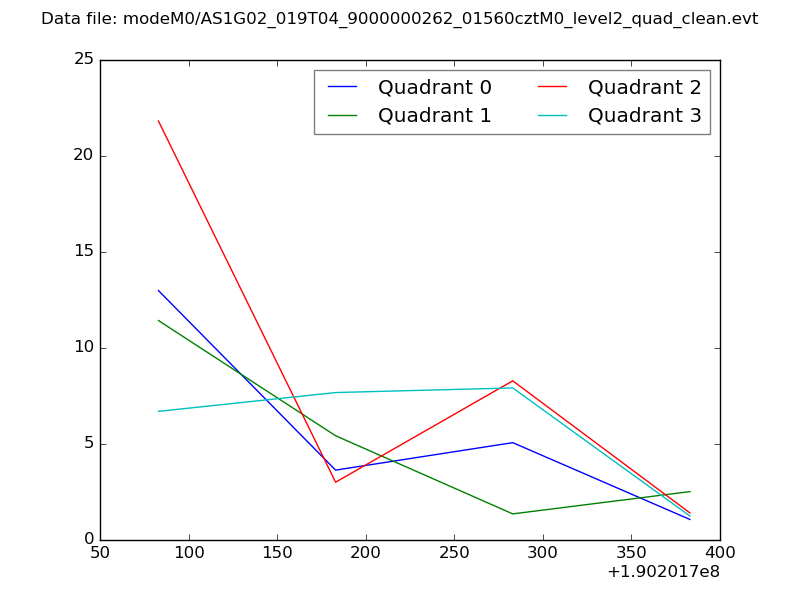 |
|
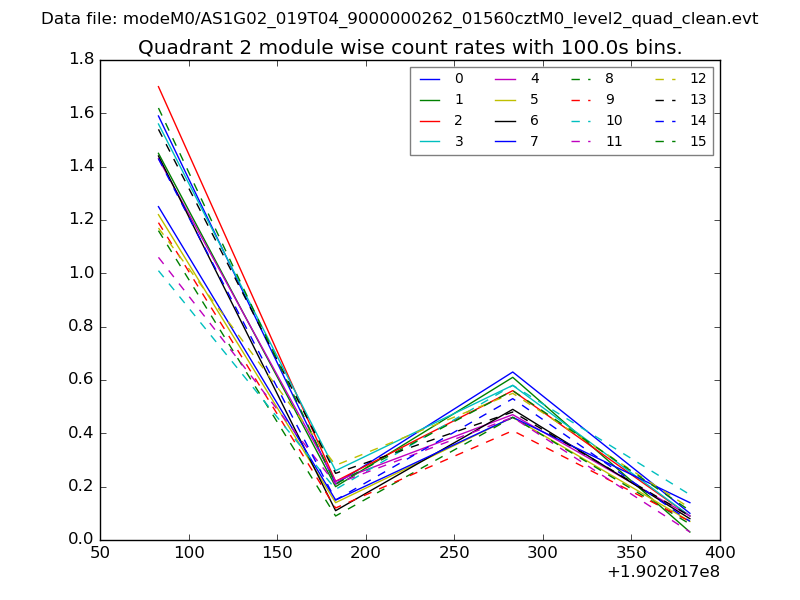
| Module-wise count rates for Quadrant A Data is divided into 100 sec bins |
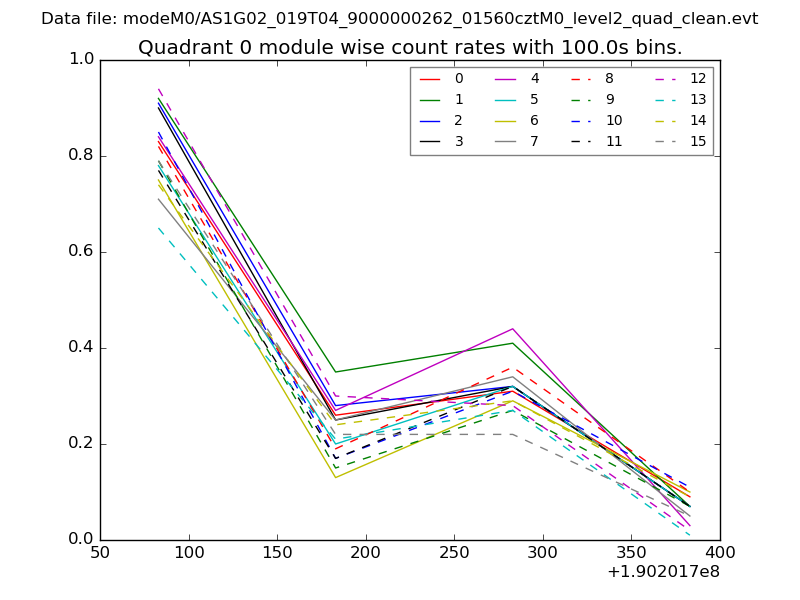 |
 |
| Module-wise count rates for Quadrant B Data is divided into 100 sec bins |
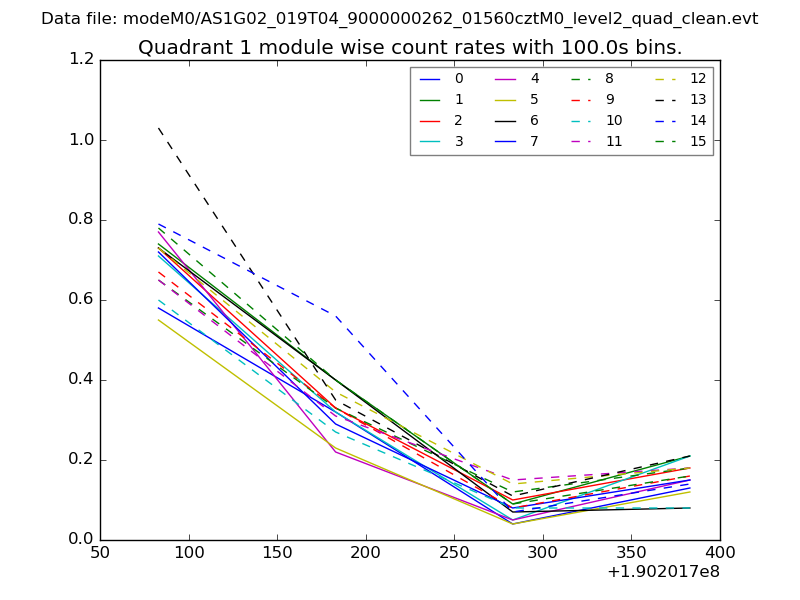 |
 |
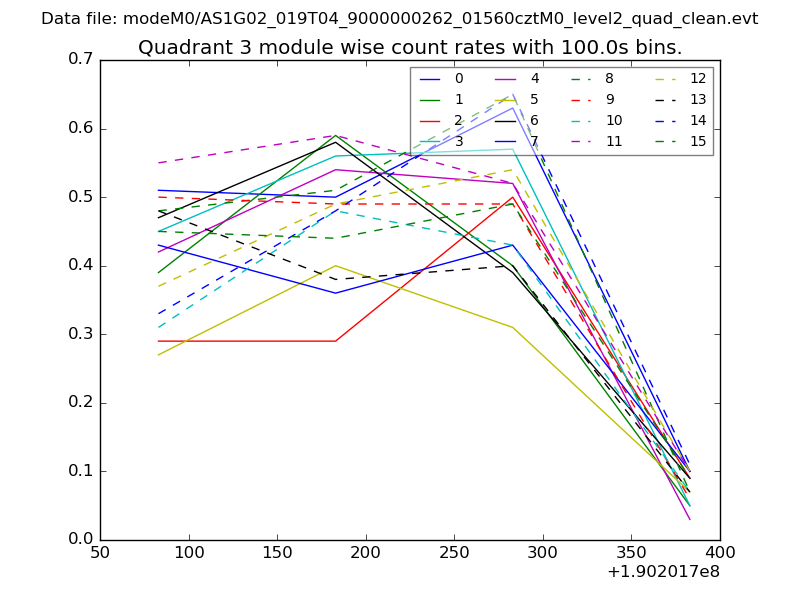
| Module-wise count rates for Quadrant C Data is divided into 100 sec bins |
 |
 |
| Module-wise count rates for Quadrant D Data is divided into 100 sec bins |
 |
 |
| Parameter | Plot |
|---|---|
| CZT HV Monitor | 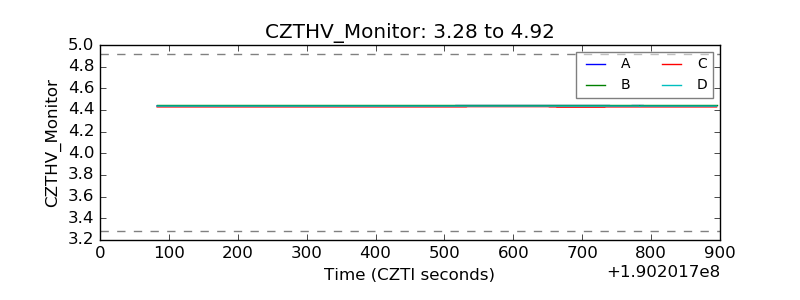 |
| D_VDD |  |
| Temperature 1 | 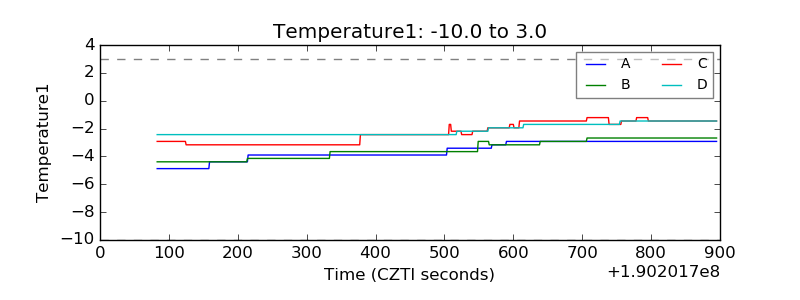 |
| Veto HV Monitor | 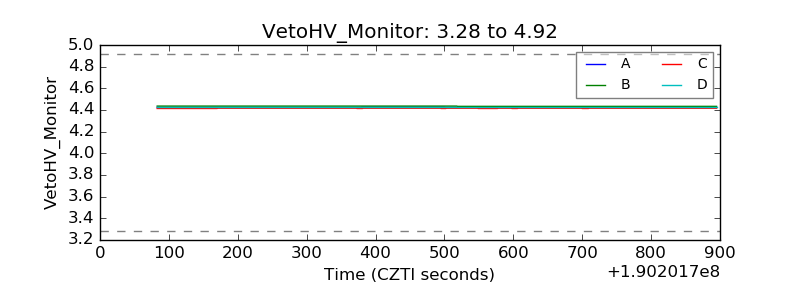 |
| Veto LLD | 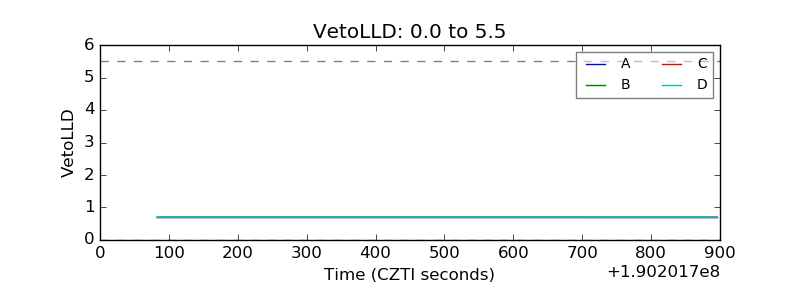 |
| Alpha Counter | 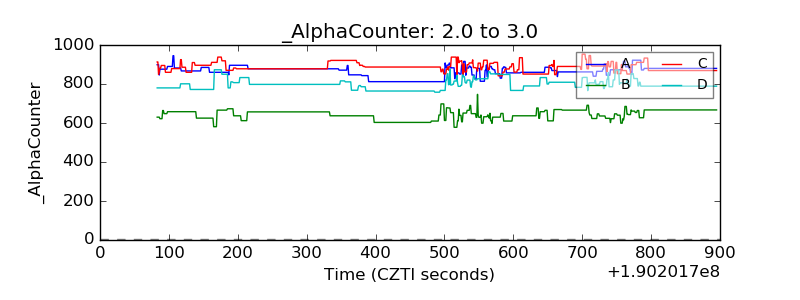 |
| _CPM_Rate | 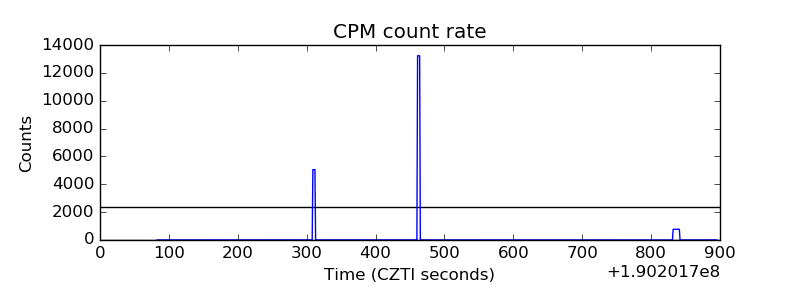 |
| CZT Counter | 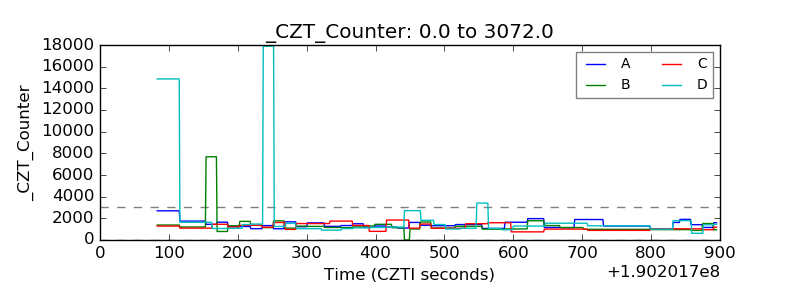 |
| +2.5 Volts monitor |  |
| +5 Volts monitor |  |
| _ROLL_ROT | 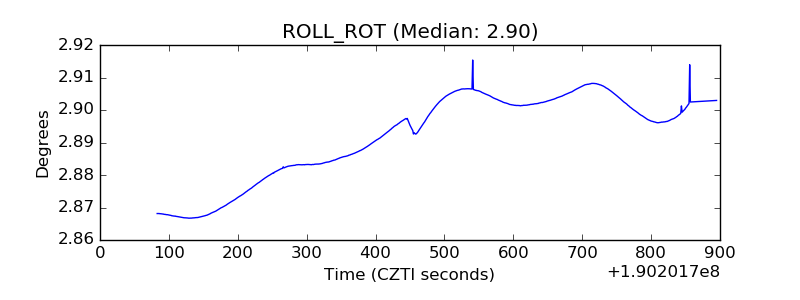 |
| _Roll_DEC | 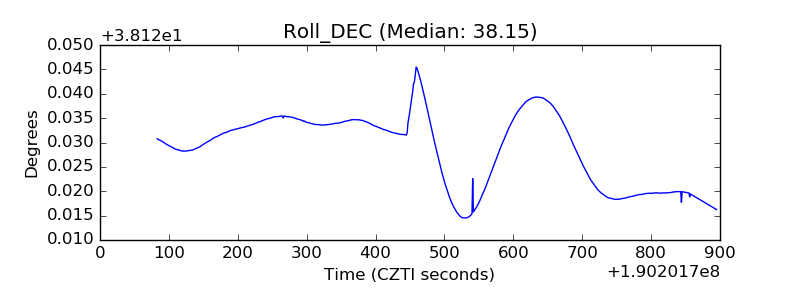 |
| _Roll_RA | 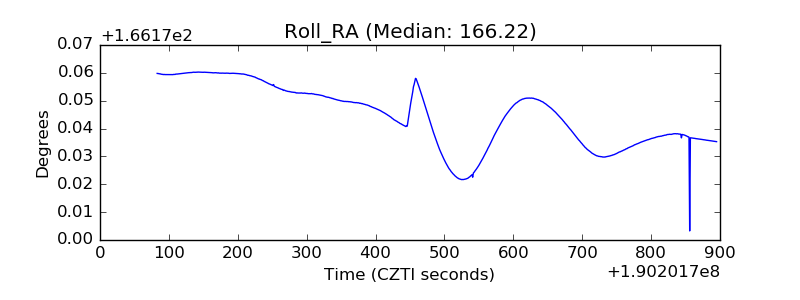 |
| Veto Counter | 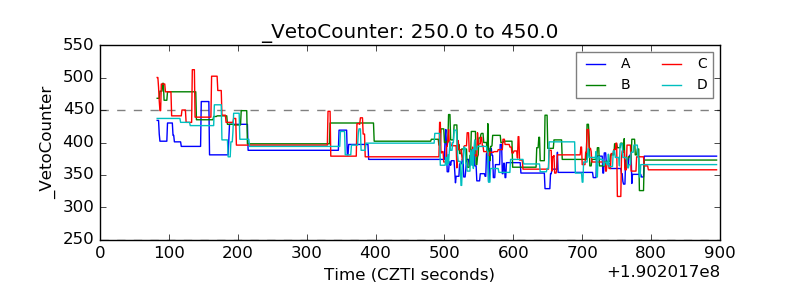 |