| Param | Original file | Final file |
|---|---|---|
| Filename | modeM0/AS1G02_019T04_9000000262_01561cztM0_level2.evt | modeM0/AS1G02_019T04_9000000262_01561cztM0_level2_quad_clean.evt |
| Size (bytes) | 382,651,200 | 16,035,840 |
| Size | 364.9 MB | 15.3 MB |
| Events in quadrant A | 2,901,436 | 79,923 |
| Events in quadrant B | 2,949,444 | 79,968 |
| Events in quadrant C | 2,780,298 | 77,810 |
| Events in quadrant D | 2,799,300 | 78,365 |
| Mode M9 | |||
|---|---|---|---|
| Quadrant | BADHDUFLAG | Total packets | Discarded packets |
| A | 0 | 11 | 4 |
| B | 0 | 10 | 3 |
| C | 0 | 9 | 2 |
| D | 0 | 9 | 2 |
| Mode SS | |||
|---|---|---|---|
| Quadrant | BADHDUFLAG | Total packets | Discarded packets |
| A | 0 | 81 | 25 |
| B | 0 | 79 | 25 |
| C | 0 | 79 | 19 |
| D | 0 | 80 | 30 |
| Mode M0 | |||
|---|---|---|---|
| Quadrant | BADHDUFLAG | Total packets | Discarded packets |
| A | 0 | 17656 | 7403 |
| B | 0 | 17903 | 7529 |
| C | 0 | 17212 | 7335 |
| D | 0 | 17252 | 7263 |
| Quadrant | Total seconds | Saturated seconds | Saturation percentage |
|---|---|---|---|
| A | 2308 | 2 | 0.086655% |
| B | 2305 | 2 | 0.086768% |
| C | 2302 | 3 | 0.130321% |
| D | 2337 | 17 | 0.727428% |
Noise dominated data is calculated using 1-second bins in cleaned event files. If a bin has >2000 counts, and if more than 50% of those come from <1% of pixels, then it is considered to be noise-dominated and hence unusable.
| Quadrant | # 1 sec bins | Bins with >0 counts | Bins with >2000 counts | High rate bins dominated by noise | Noise dominated (total time) | Noise dominated (detector-on time) | Marked lightcurve |
|---|---|---|---|---|---|---|---|
| A | 7344 | 2623 | 61 | 61 | 0.83% | 2.33% | 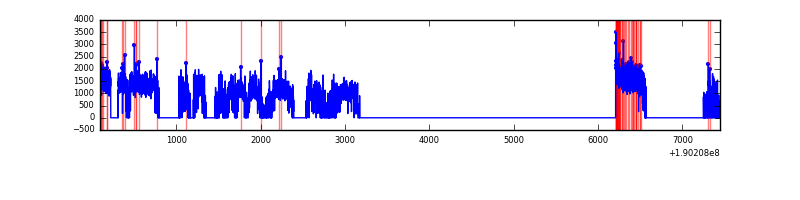 |
| B | 7344 | 2629 | 60 | 60 | 0.82% | 2.28% | 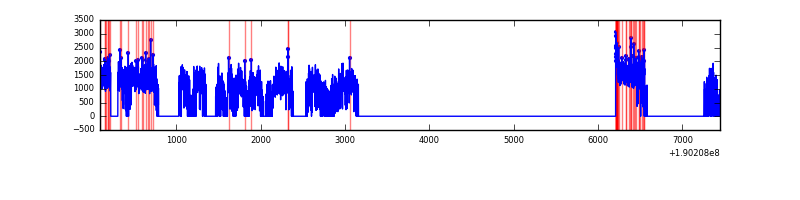 |
| C | 7336 | 2618 | 33 | 33 | 0.45% | 1.26% | 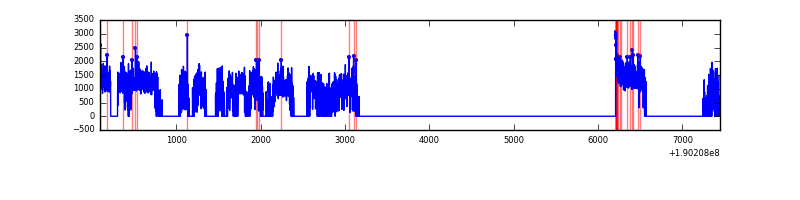 |
| D | 7347 | 2666 | 59 | 59 | 0.80% | 2.21% | 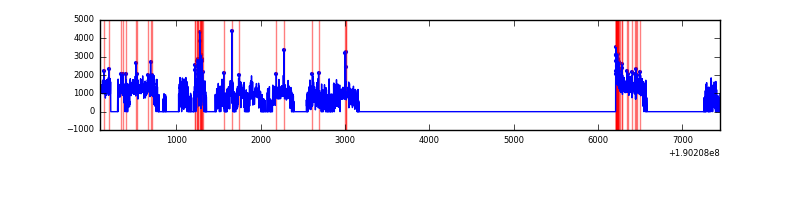 |
Top three noisy pixels from each quadrant. If the there are fewer than three noisy pixels in the level2.evt file, extra rows are filled as -1
| Pixel properties | Quadrant properties | ||||||
|---|---|---|---|---|---|---|---|
| Quadrant | DetID | PixID | Counts | Sigma | Mean | Median | Sigma |
| A | 15 | 236 | 3172 | 13.18 | 757 | 761 | 182.9 |
| A | 12 | 251 | 3065 | 12.6 | 757 | 761 | 182.9 |
| A | 10 | 2 | 2263 | 8.21 | 757 | 761 | 182.9 |
| B | 0 | 220 | 22102 | 117.93 | 771 | 775 | 180.8 |
| B | 4 | 200 | 2759 | 10.97 | 771 | 775 | 180.8 |
| B | 0 | 182 | 2305 | 8.46 | 771 | 775 | 180.8 |
| C | 8 | 208 | 14913 | 72.04 | 706 | 729 | 196.9 |
| C | 7 | 159 | 5535 | 24.41 | 706 | 729 | 196.9 |
| C | 8 | 229 | 3940 | 16.31 | 706 | 729 | 196.9 |
| D | 13 | 105 | 45617 | 215.48 | 721 | 739 | 208.3 |
| D | 13 | 169 | 35987 | 169.24 | 721 | 739 | 208.3 |
| D | 13 | 72 | 10380 | 46.29 | 721 | 739 | 208.3 |
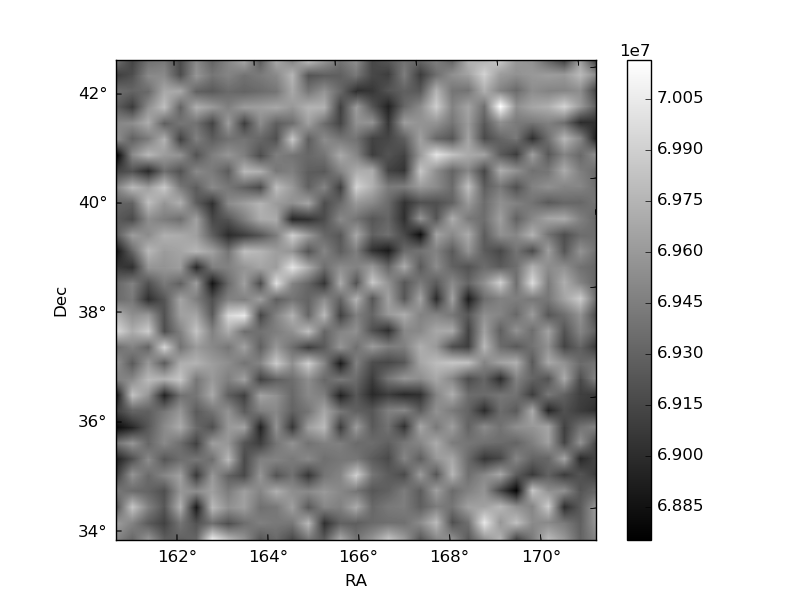
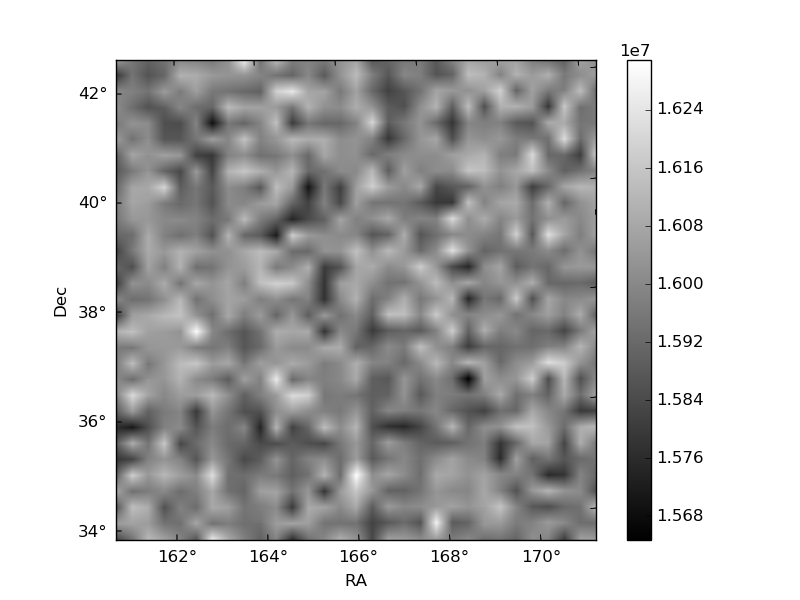
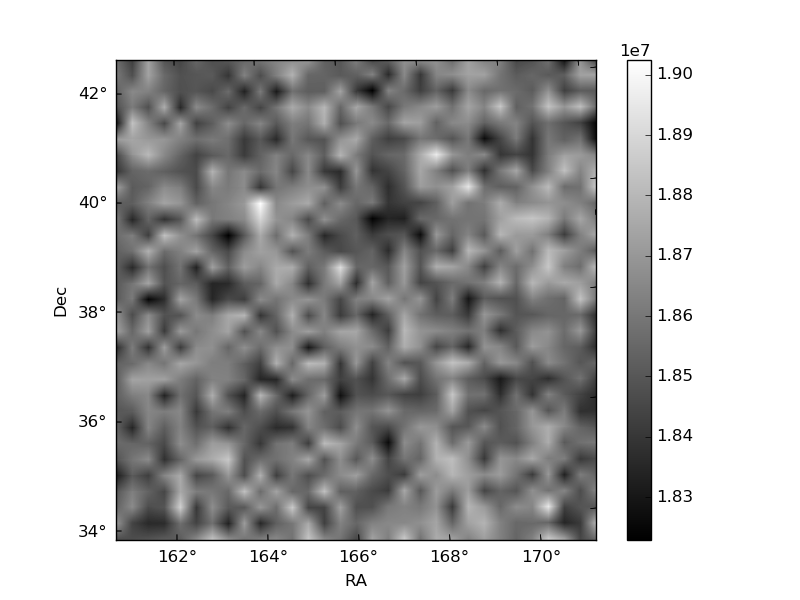
Histogram calculated using DETX and DETY for each event in the final _common_clean file
| Quadrant A | 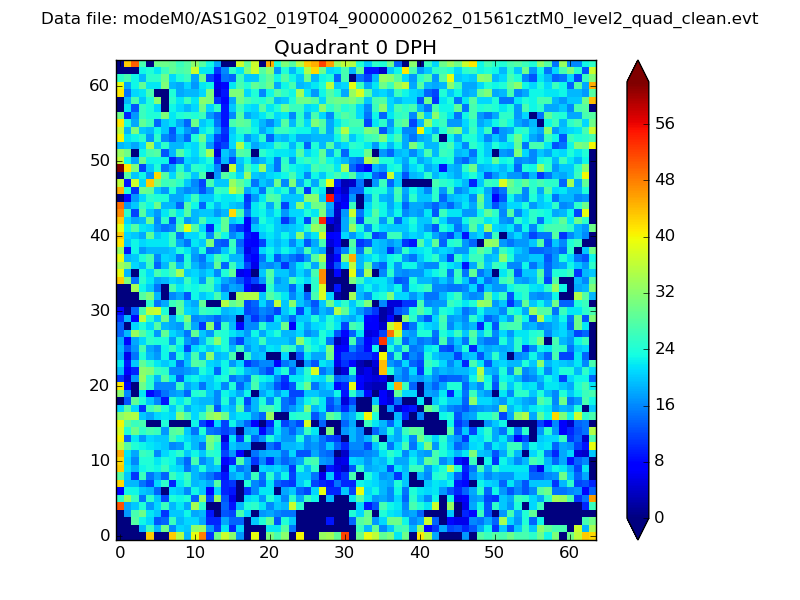 |
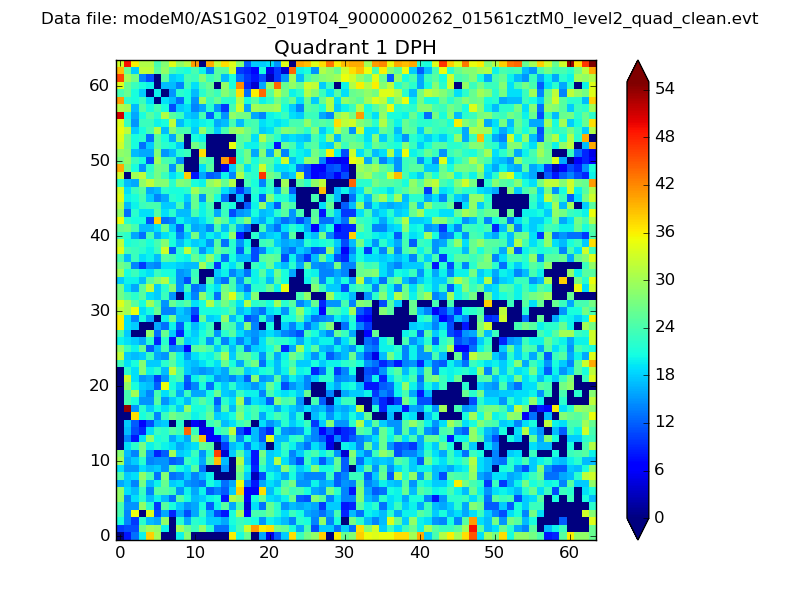 |
Quadrant B |
|---|---|---|---|
| Quadrant D | 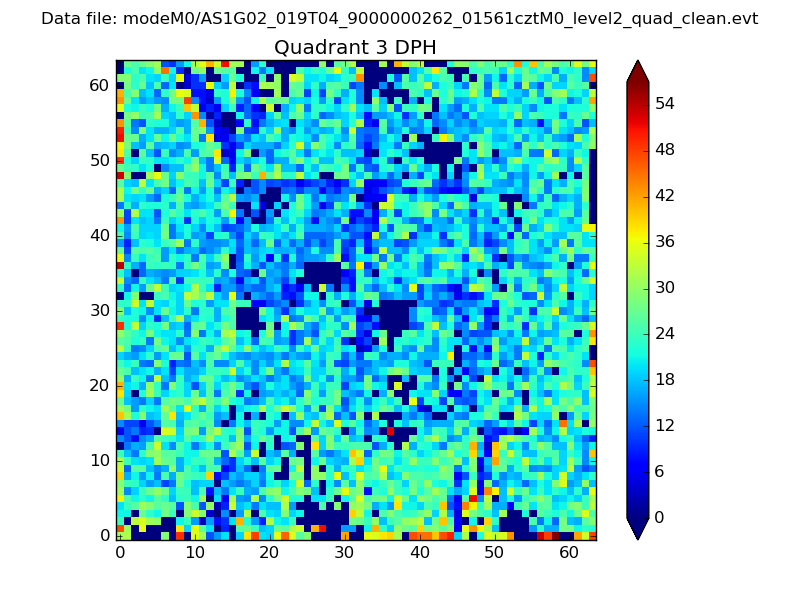 |
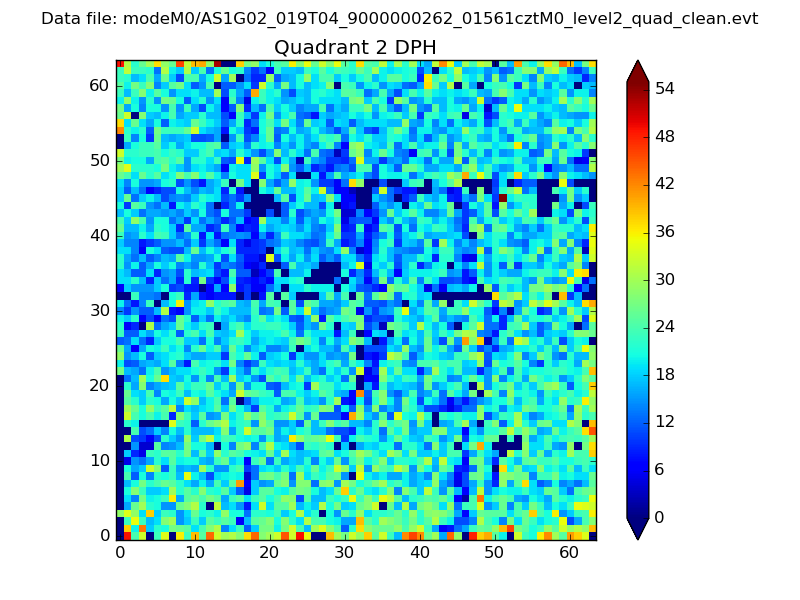 |
Quadrant C |
| Plot type | Count rate plots | Images |
|---|---|---|
| Comparison with Poisson distribution Blue bars denote a histogram of data divided into 1 sec bins. Red curve is a Poisson curve with rate = median count rate of data. |
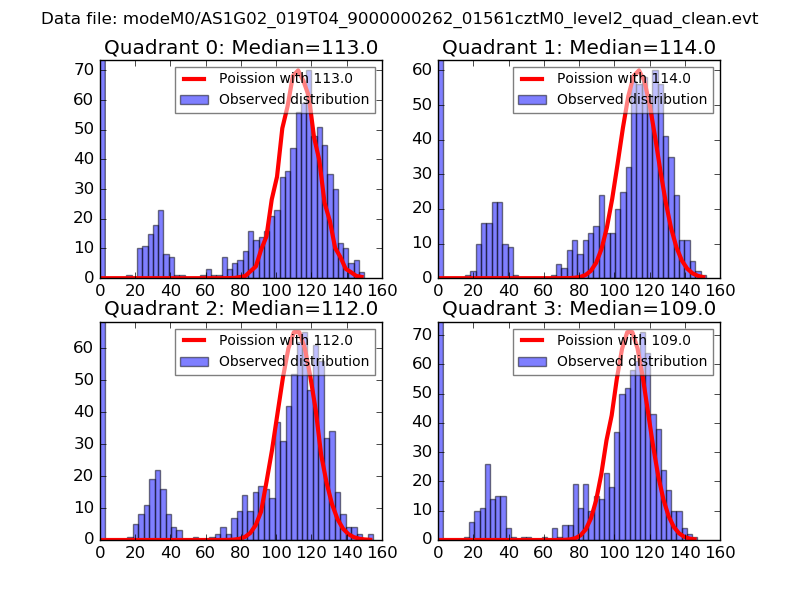 |
 |
| Quadrant-wise count rates Data is divided into 100 sec bins |
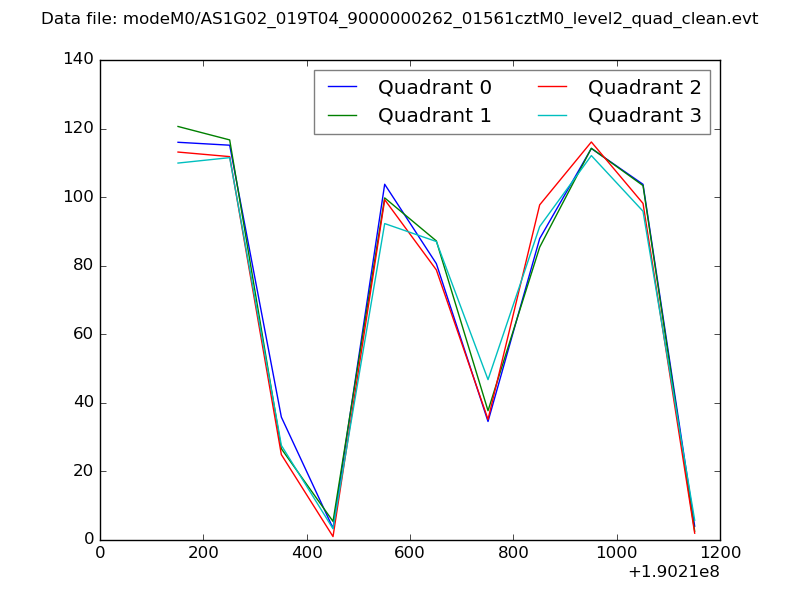 |
|
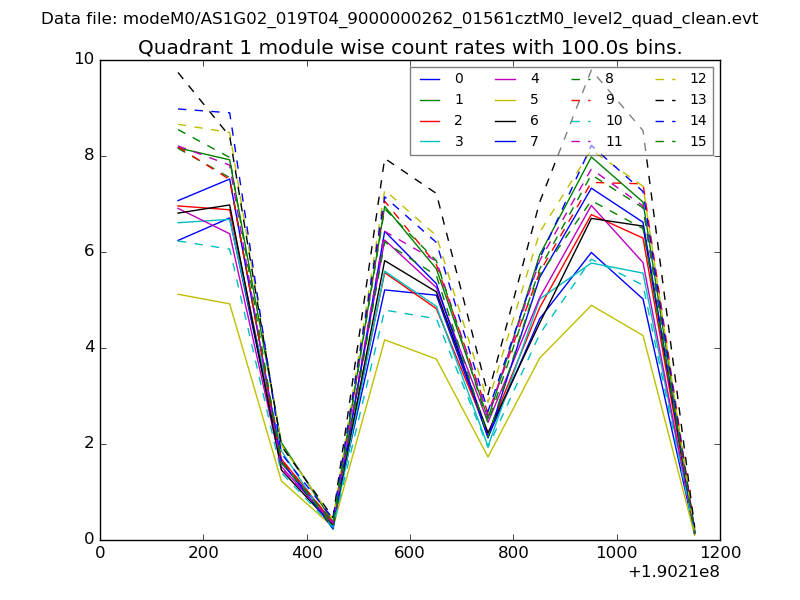
| Module-wise count rates for Quadrant A Data is divided into 100 sec bins |
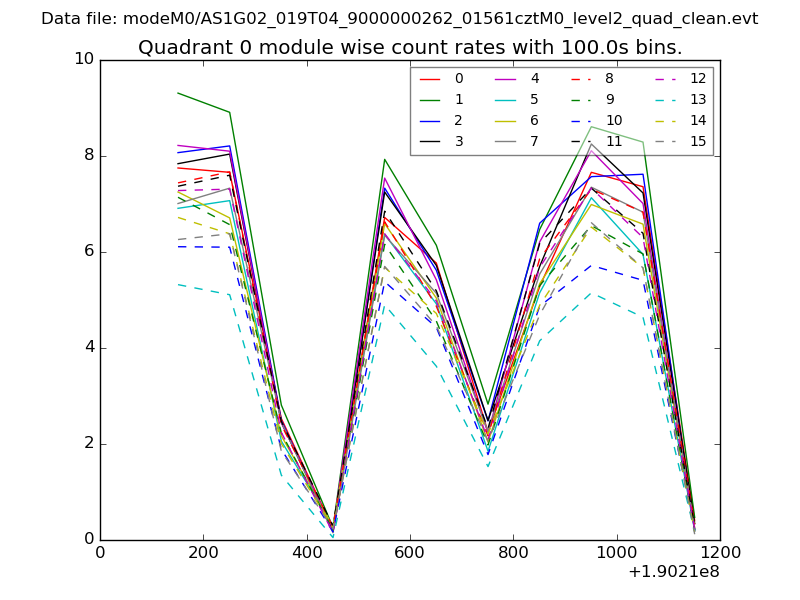 |
 |
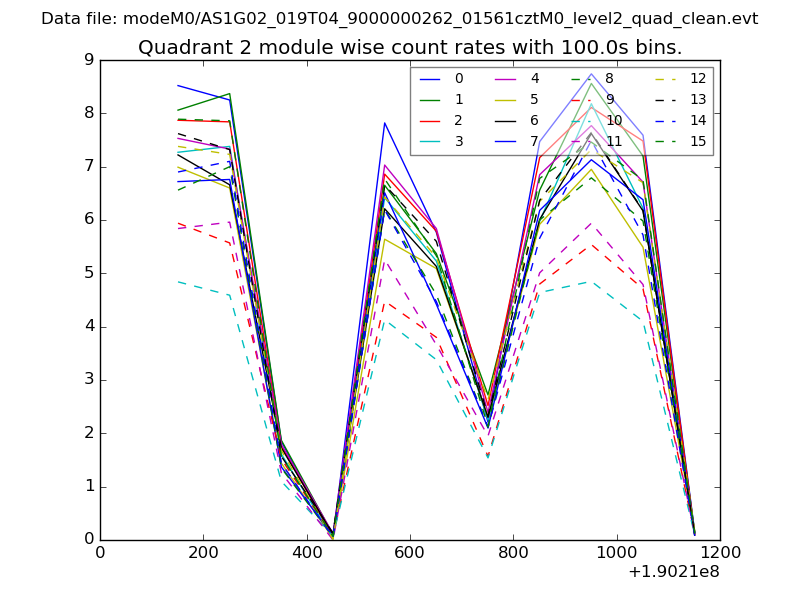
| Module-wise count rates for Quadrant B Data is divided into 100 sec bins |
 |
 |
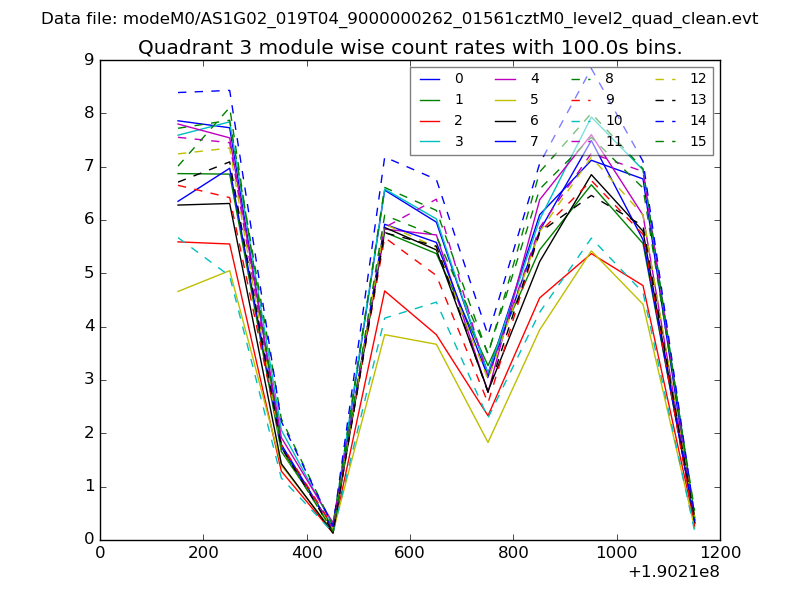
| Module-wise count rates for Quadrant C Data is divided into 100 sec bins |
 |
 |
| Module-wise count rates for Quadrant D Data is divided into 100 sec bins |
 |
 |
| Parameter | Plot |
|---|---|
| CZT HV Monitor | 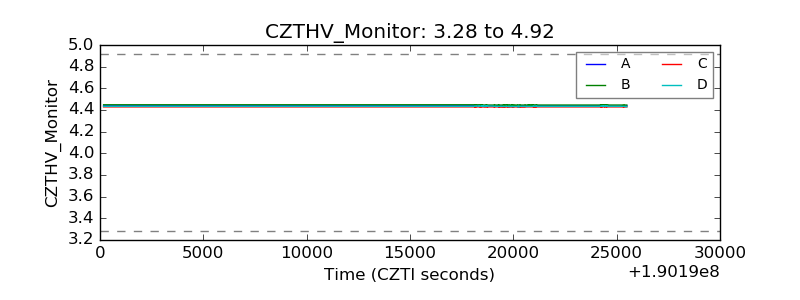 |
| D_VDD | 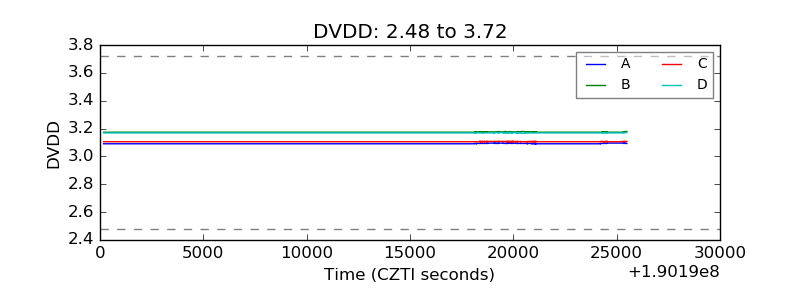 |
| Temperature 1 | 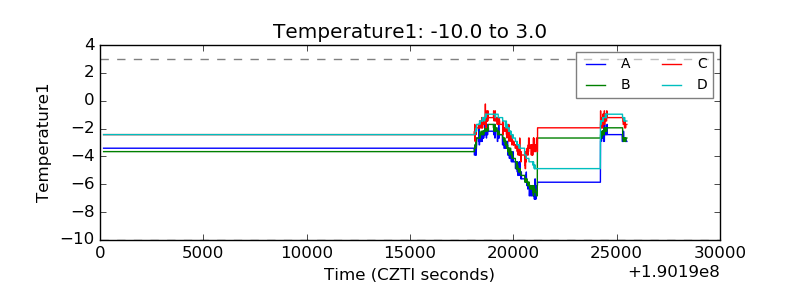 |
| Veto HV Monitor | 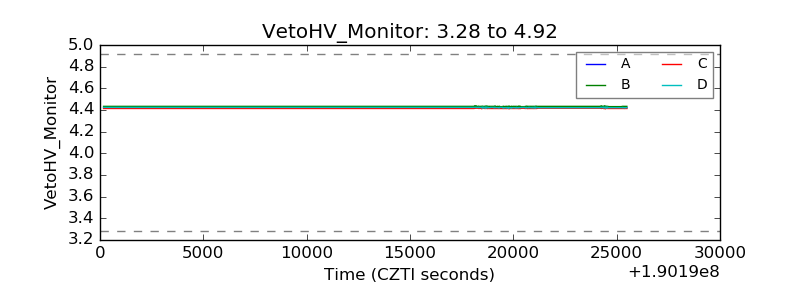 |
| Veto LLD | 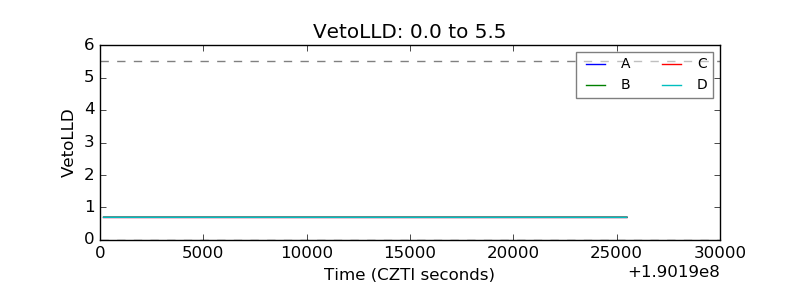 |
| Alpha Counter | 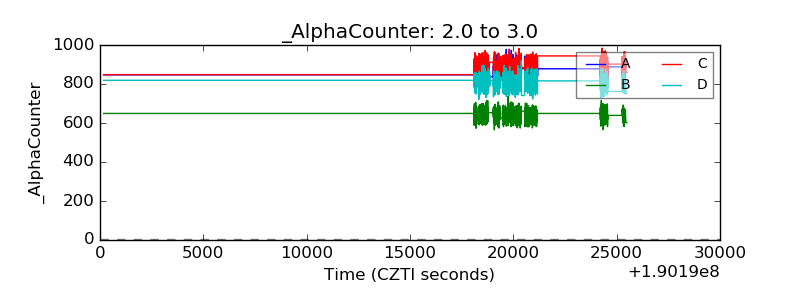 |
| _CPM_Rate | 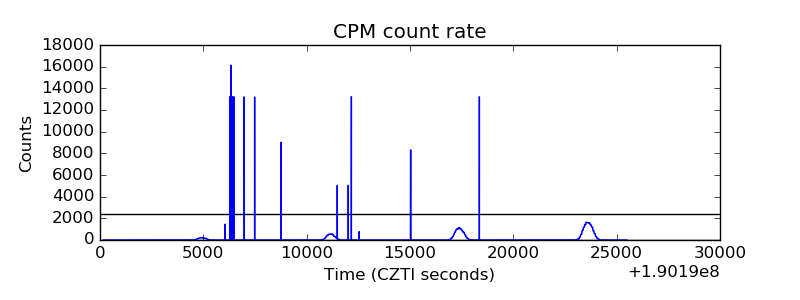 |
| CZT Counter | 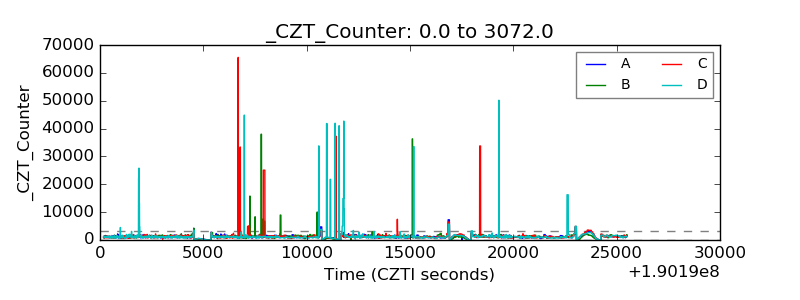 |
| +2.5 Volts monitor |  |
| +5 Volts monitor | 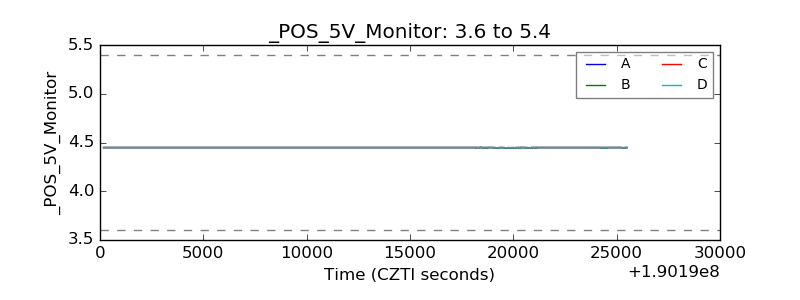 |
| _ROLL_ROT | 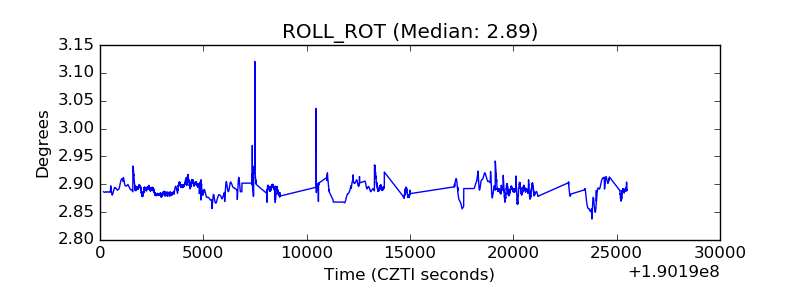 |
| _Roll_DEC | 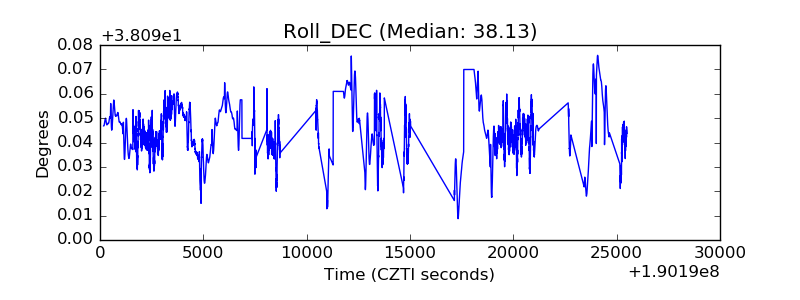 |
| _Roll_RA | 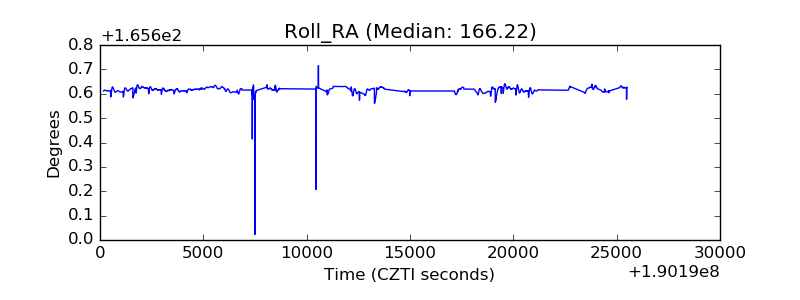 |
| Veto Counter | 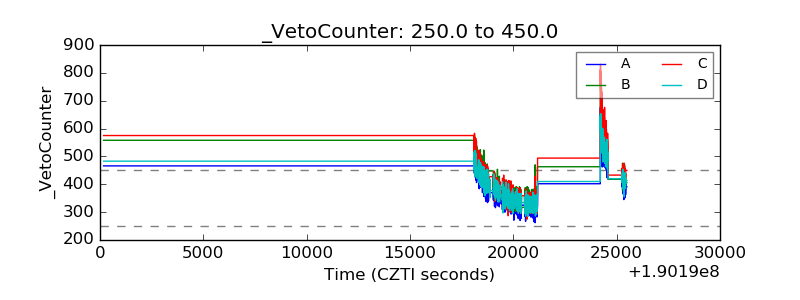 |