| Param | Original file | Final file |
|---|---|---|
| Filename | modeM0/AS1G02_019T04_9000000262_01562cztM0_level2.evt | modeM0/AS1G02_019T04_9000000262_01562cztM0_level2_quad_clean.evt |
| Size (bytes) | 304,300,800 | 15,304,320 |
| Size | 290.2 MB | 14.6 MB |
| Events in quadrant A | 2,293,457 | 82,071 |
| Events in quadrant B | 2,332,583 | 83,034 |
| Events in quadrant C | 2,251,941 | 80,382 |
| Events in quadrant D | 2,209,598 | 79,176 |
| Mode SS | |||
|---|---|---|---|
| Quadrant | BADHDUFLAG | Total packets | Discarded packets |
| A | 0 | 38 | 0 |
| B | 0 | 38 | 0 |
| C | 0 | 38 | 0 |
| D | 0 | 38 | 0 |
| Mode M0 | |||
|---|---|---|---|
| Quadrant | BADHDUFLAG | Total packets | Discarded packets |
| A | 0 | 8162 | 0 |
| B | 0 | 8268 | 0 |
| C | 0 | 8028 | 0 |
| D | 0 | 7904 | 0 |
| Quadrant | Total seconds | Saturated seconds | Saturation percentage |
|---|---|---|---|
| A | 1890 | 0 | 0.000000% |
| B | 1890 | 0 | 0.000000% |
| C | 1890 | 0 | 0.000000% |
| D | 1890 | 12 | 0.634921% |
Noise dominated data is calculated using 1-second bins in cleaned event files. If a bin has >2000 counts, and if more than 50% of those come from <1% of pixels, then it is considered to be noise-dominated and hence unusable.
| Quadrant | # 1 sec bins | Bins with >0 counts | Bins with >2000 counts | High rate bins dominated by noise | Noise dominated (total time) | Noise dominated (detector-on time) | Marked lightcurve |
|---|---|---|---|---|---|---|---|
| A | 1890 | 1890 | 22 | 22 | 1.16% | 1.16% | 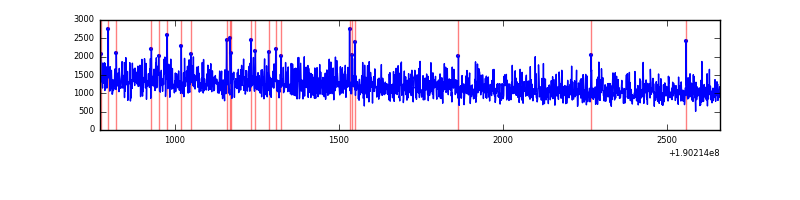 |
| B | 1890 | 1890 | 38 | 38 | 2.01% | 2.01% | 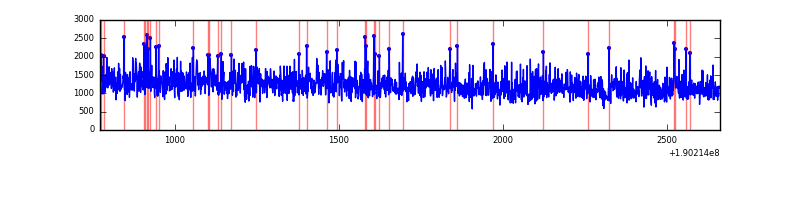 |
| C | 1890 | 1890 | 14 | 14 | 0.74% | 0.74% | 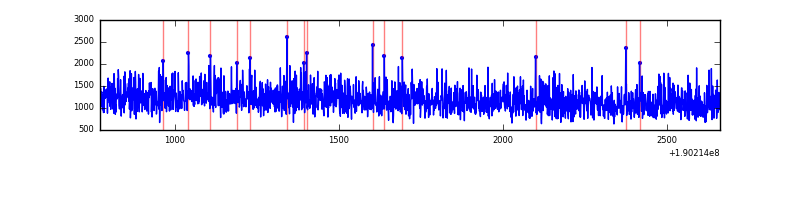 |
| D | 1890 | 1890 | 32 | 32 | 1.69% | 1.69% | 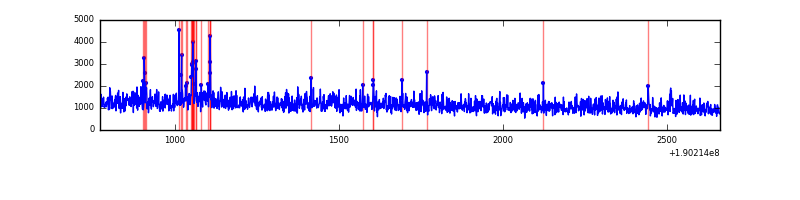 |
Top three noisy pixels from each quadrant. If the there are fewer than three noisy pixels in the level2.evt file, extra rows are filled as -1
| Pixel properties | Quadrant properties | ||||||
|---|---|---|---|---|---|---|---|
| Quadrant | DetID | PixID | Counts | Sigma | Mean | Median | Sigma |
| A | 10 | 2 | 2752 | 15.11 | 598 | 600 | 142.4 |
| A | 13 | 9 | 1966 | 9.59 | 598 | 600 | 142.4 |
| A | 14 | 188 | 1348 | 5.25 | 598 | 600 | 142.4 |
| B | 4 | 170 | 5392 | 33.44 | 612 | 616 | 142.8 |
| B | 4 | 200 | 5007 | 30.74 | 612 | 616 | 142.8 |
| B | 0 | 220 | 2959 | 16.4 | 612 | 616 | 142.8 |
| D | 13 | 169 | 29797 | 173.71 | 570 | 585 | 168.2 |
| D | 13 | 53 | 20864 | 120.59 | 570 | 585 | 168.2 |
| D | 7 | 85 | 13406 | 76.24 | 570 | 585 | 168.2 |
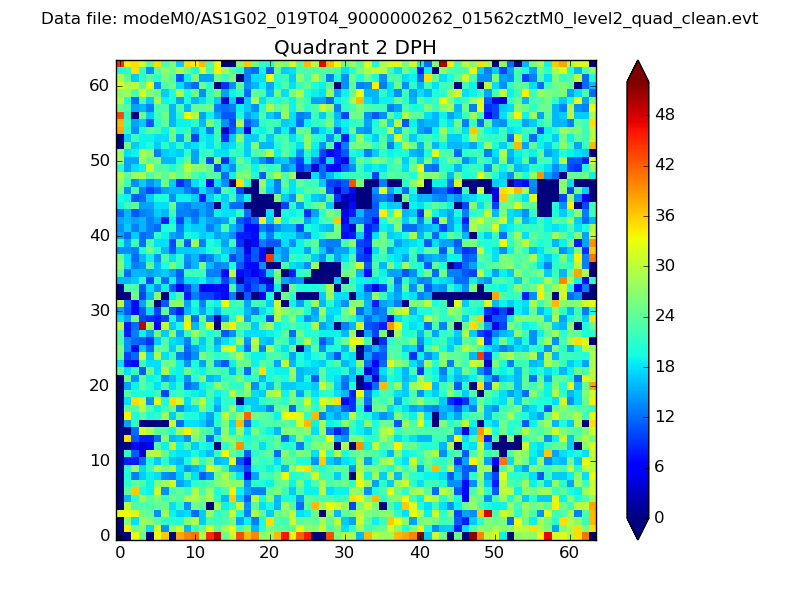
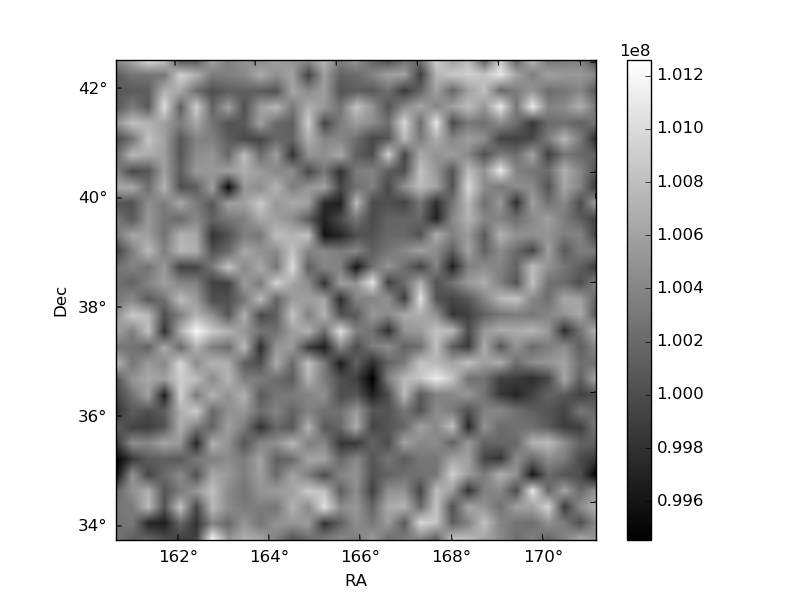
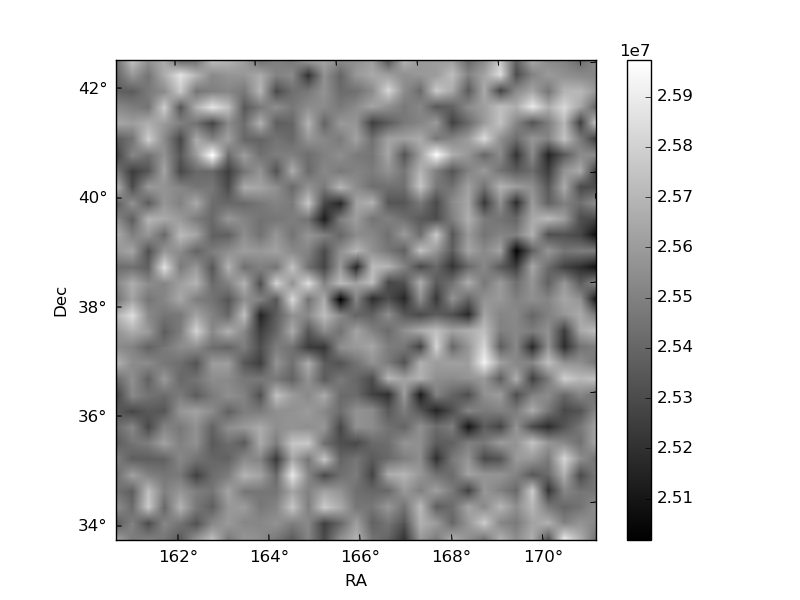
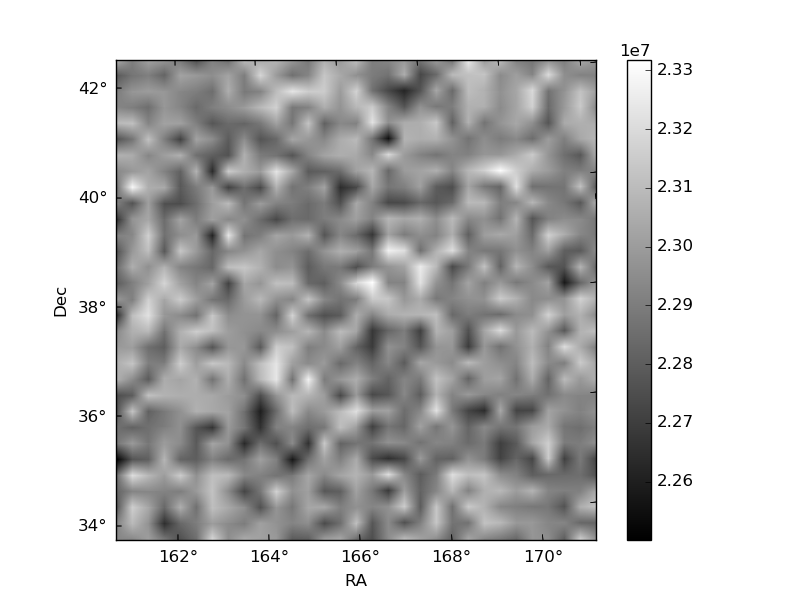
Histogram calculated using DETX and DETY for each event in the final _common_clean file
| Quadrant A | 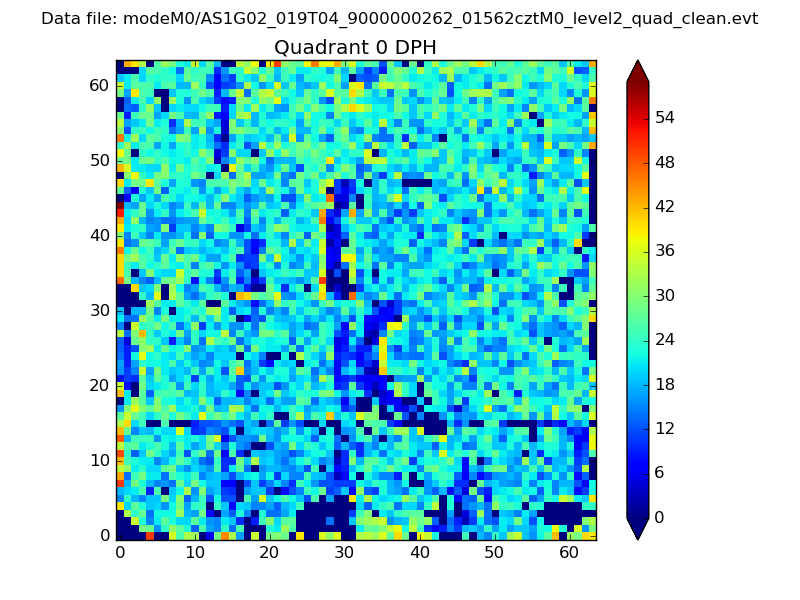 |
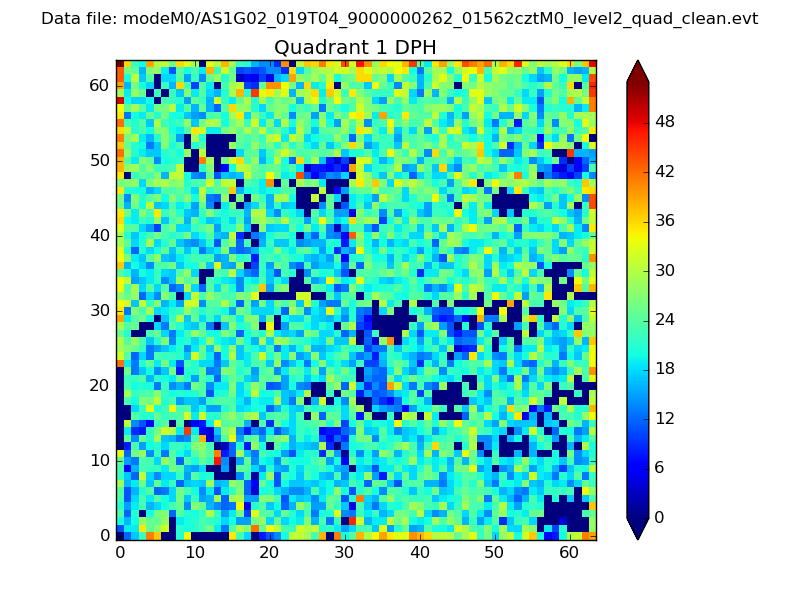 |
Quadrant B |
|---|---|---|---|
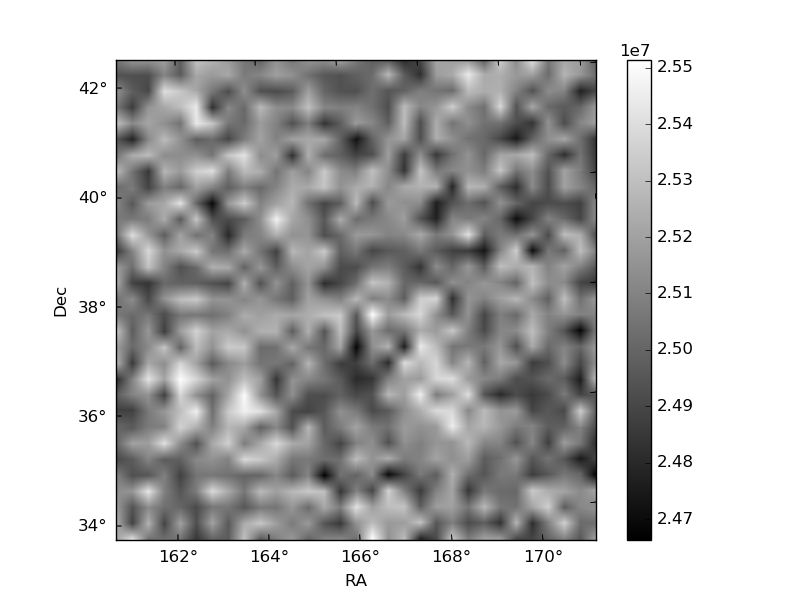
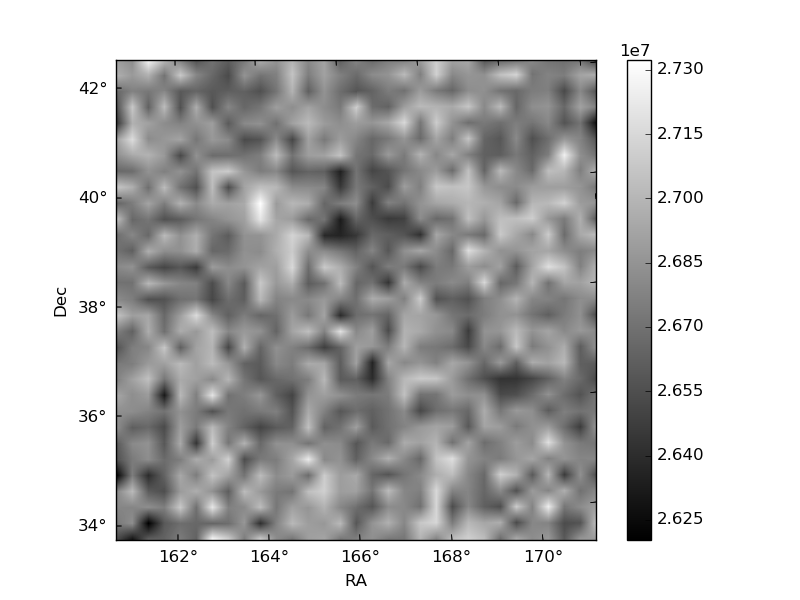
| Quadrant D | 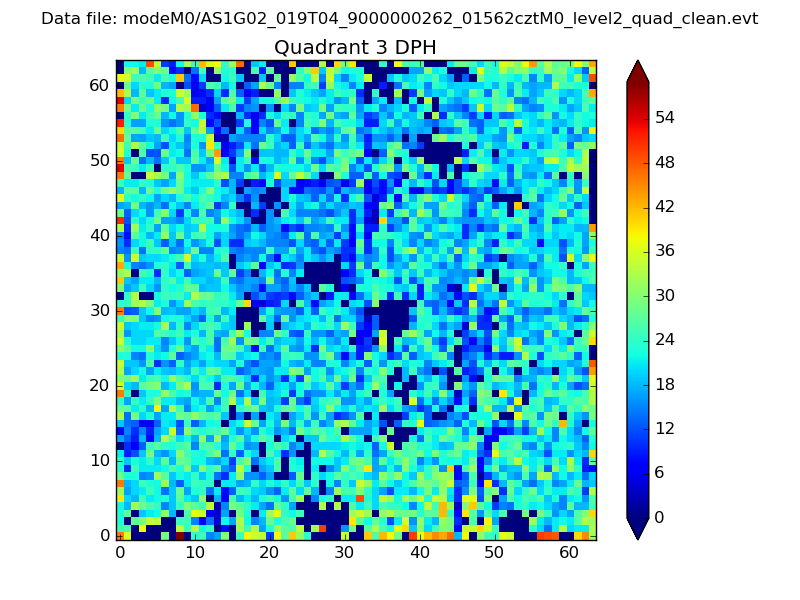 |
 |
Quadrant C |
| Plot type | Count rate plots | Images |
|---|---|---|
| Comparison with Poisson distribution Blue bars denote a histogram of data divided into 1 sec bins. Red curve is a Poisson curve with rate = median count rate of data. |
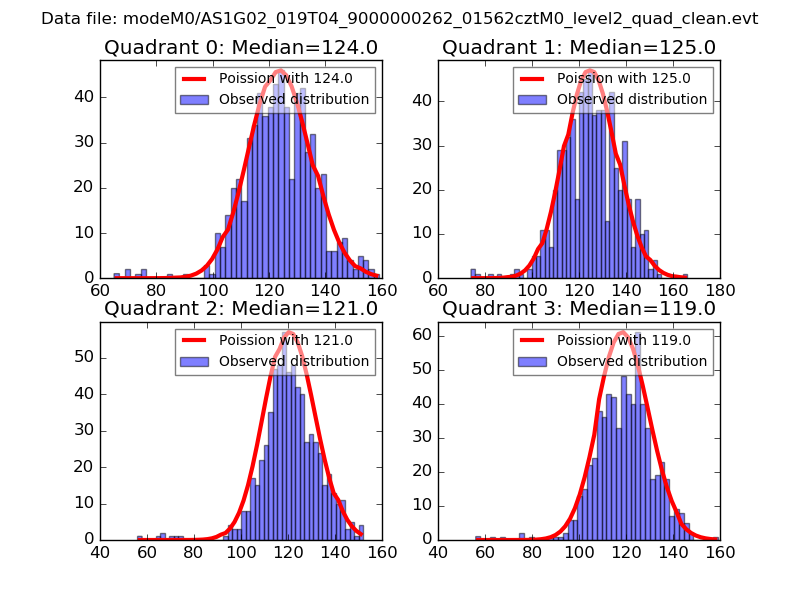 |
 |
| Quadrant-wise count rates Data is divided into 100 sec bins |
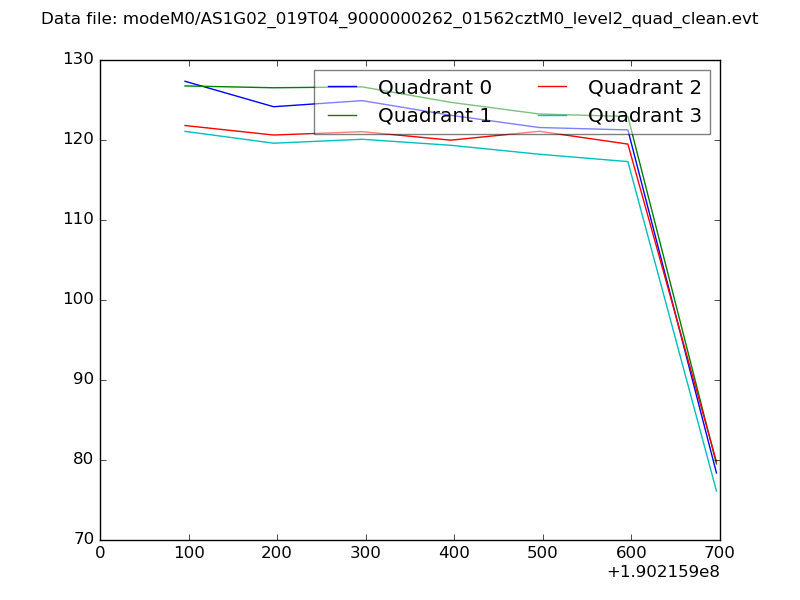 |
|
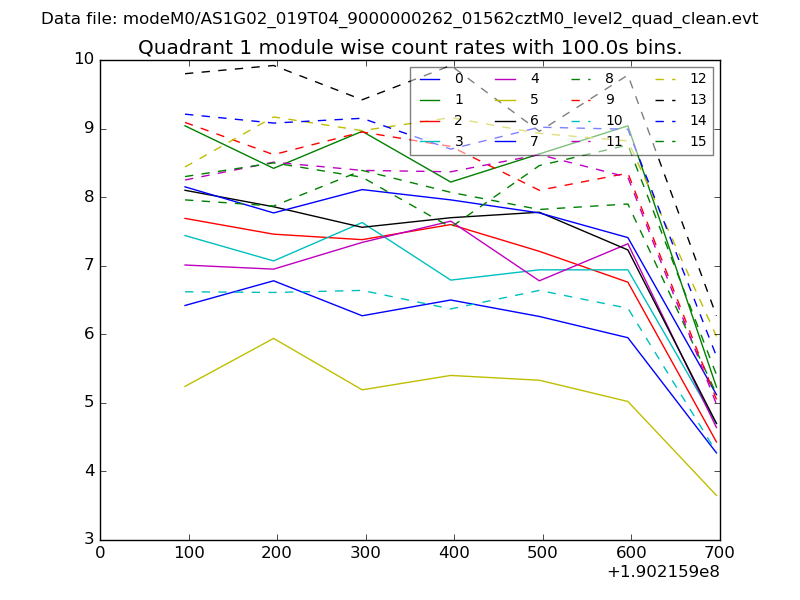
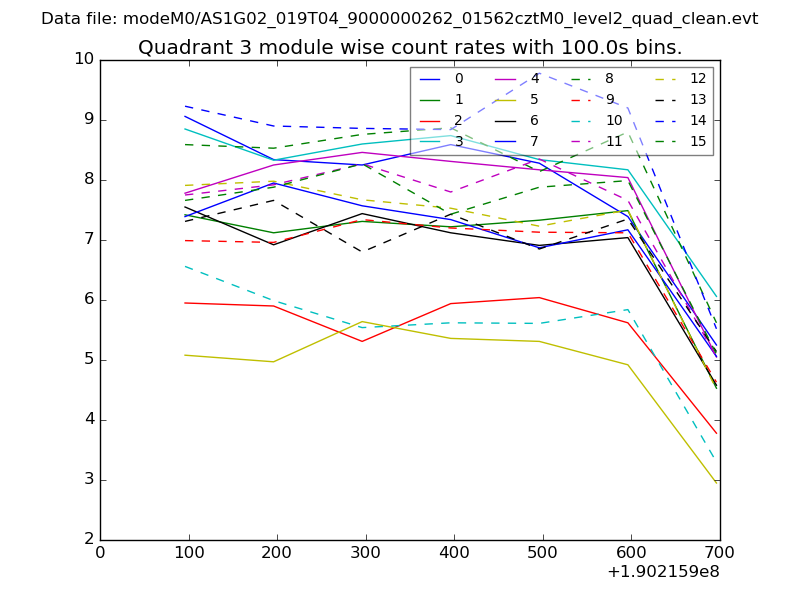
| Module-wise count rates for Quadrant A Data is divided into 100 sec bins |
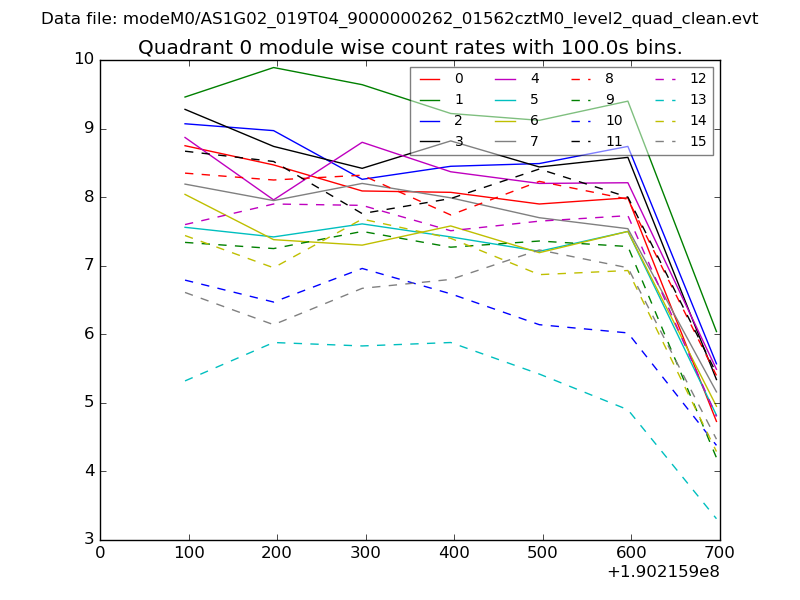 |
 |
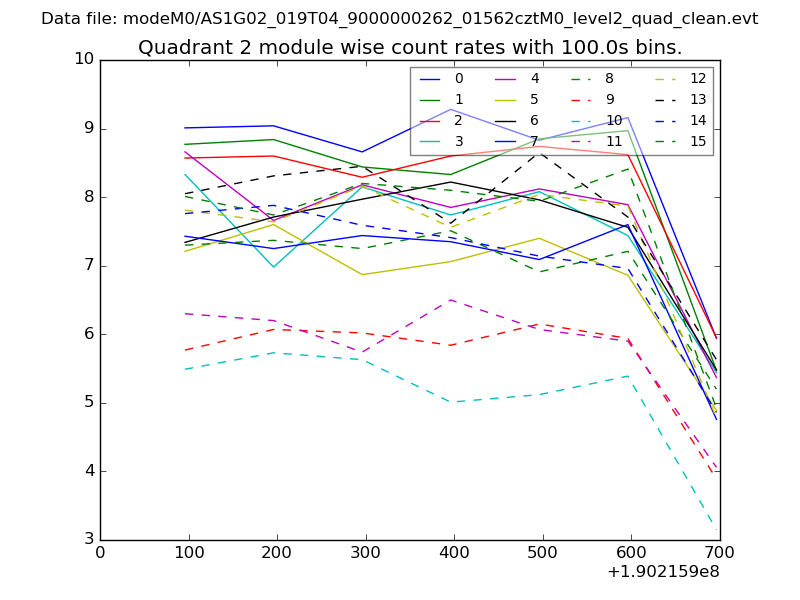
| Module-wise count rates for Quadrant B Data is divided into 100 sec bins |
 |
 |
| Module-wise count rates for Quadrant C Data is divided into 100 sec bins |
 |
 |
| Module-wise count rates for Quadrant D Data is divided into 100 sec bins |
 |
 |
| Parameter | Plot |
|---|---|
| CZT HV Monitor | 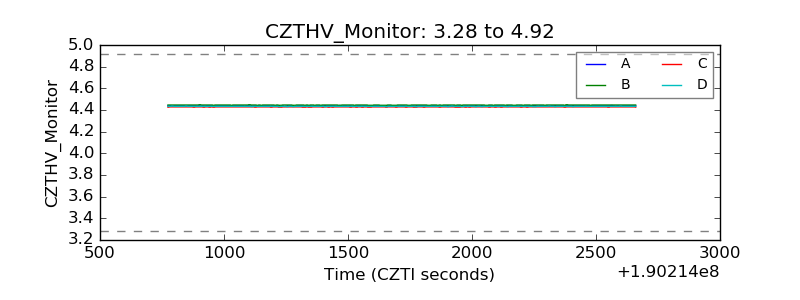 |
| D_VDD | 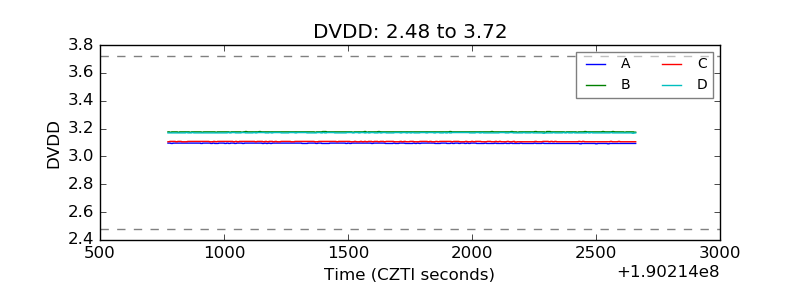 |
| Temperature 1 | 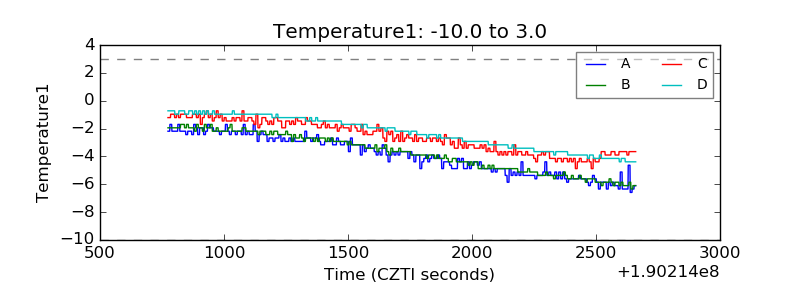 |
| Veto HV Monitor | 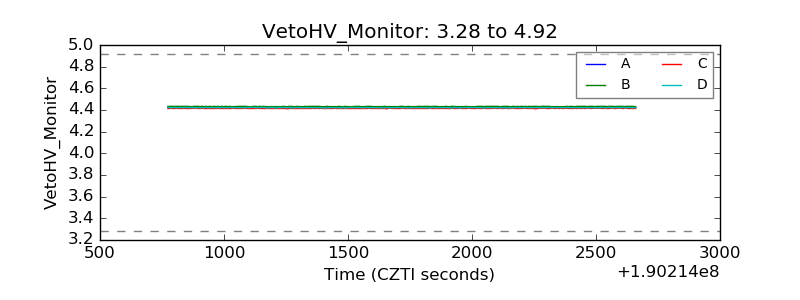 |
| Veto LLD | 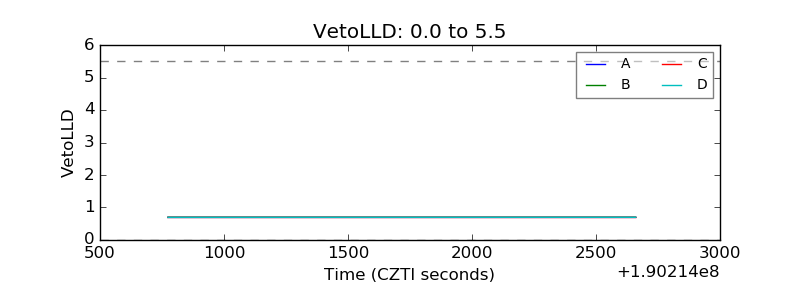 |
| Alpha Counter | 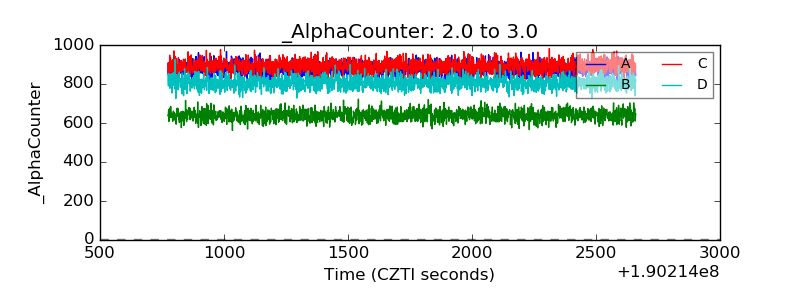 |
| _CPM_Rate | 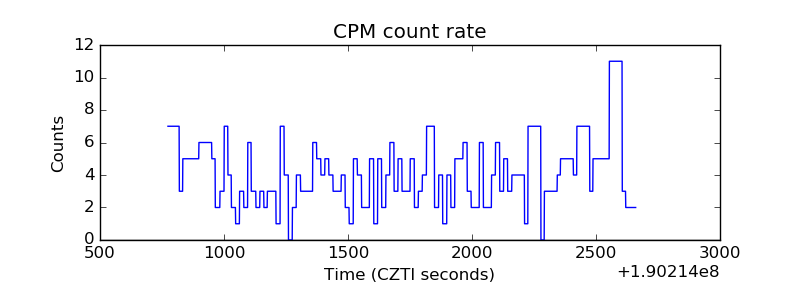 |
| CZT Counter | 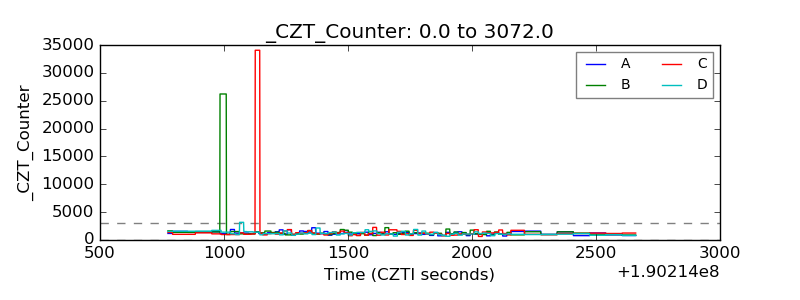 |
| +2.5 Volts monitor | 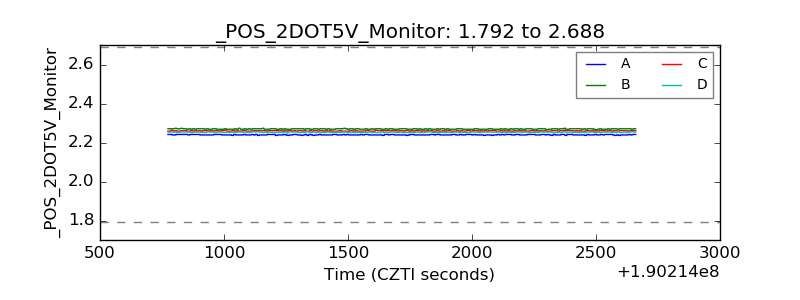 |
| +5 Volts monitor | 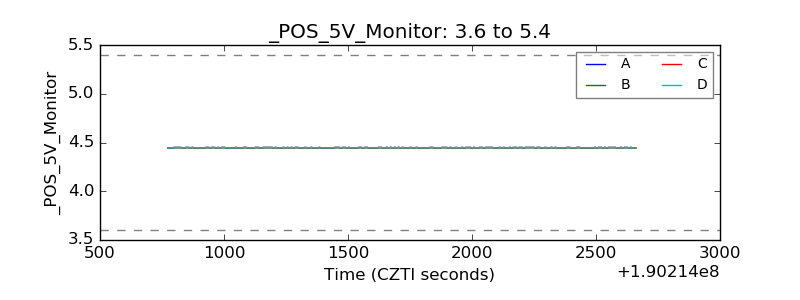 |
| _ROLL_ROT | 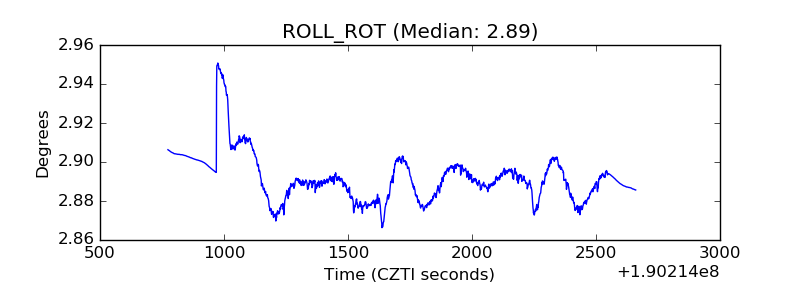 |
| _Roll_DEC | 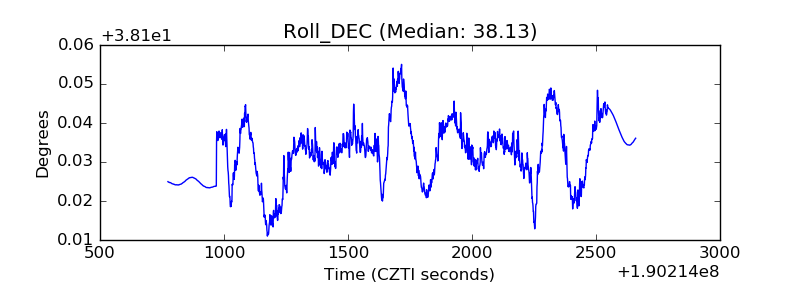 |
| _Roll_RA | 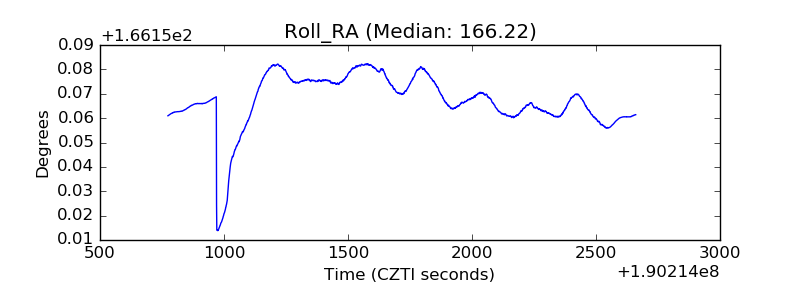 |
| Veto Counter | 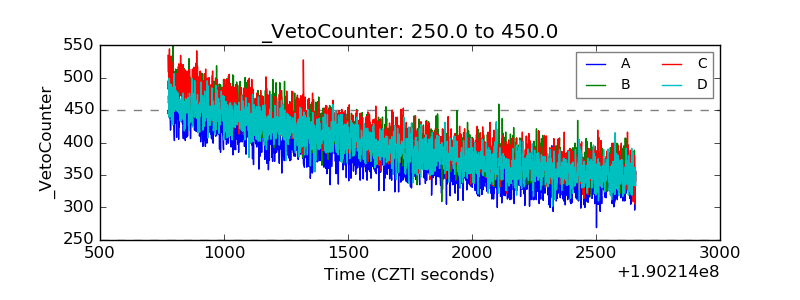 |