| Param | Original file | Final file |
|---|---|---|
| Filename | modeM0/AS1G02_020T02_9000000268cztM0_level2.fits | modeM0/AS1G02_020T02_9000000268cztM0_level2_quad_clean.evt |
| Size (bytes) | 181,713,600 | 140,673,600 |
| Size | 173.3 MB | 134.2 MB |
| Events in quadrant A | 1,071,530 | 738,849 |
| Events in quadrant B | 1,050,214 | 738,887 |
| Events in quadrant C | 1,036,080 | 703,418 |
| Events in quadrant D | 892,482 | 625,075 |
| Mode M0 | |||
|---|---|---|---|
| Quadrant | BADHDUFLAG | Total packets | Discarded packets |
| A | 0 | 89913 | 0 |
| B | 0 | 91450 | 0 |
| C | 0 | 86107 | 0 |
| D | 0 | 87502 | 0 |
| Mode M9 | |||
|---|---|---|---|
| Quadrant | BADHDUFLAG | Total packets | Discarded packets |
| A | 0 | 31 | 0 |
| B | 0 | 31 | 0 |
| C | 0 | 31 | 0 |
| D | 0 | 31 | 0 |
| Mode SS | |||
|---|---|---|---|
| Quadrant | BADHDUFLAG | Total packets | Discarded packets |
| A | 0 | 428 | 0 |
| B | 0 | 428 | 0 |
| C | 0 | 430 | 0 |
| D | 0 | 430 | 0 |
| Quadrant | Total seconds | Saturated seconds | Saturation percentage |
|---|---|---|---|
| A | 21089 | 57 | 0.270283% |
| B | 21105 | 29 | 0.137408% |
| C | 21095 | 68 | 0.322351% |
| D | 21103 | 609 | 2.885846% |
Noise dominated data is calculated using 1-second bins in cleaned event files. If a bin has >2000 counts, and if more than 50% of those come from <1% of pixels, then it is considered to be noise-dominated and hence unusable.
| Quadrant | # 1 sec bins | Bins with >0 counts | Bins with >2000 counts | High rate bins dominated by noise | Noise dominated (total time) | Noise dominated (detector-on time) | Marked lightcurve |
|---|---|---|---|---|---|---|---|
| A | 30397 | 21170 | 0 | 0 | 0.00% | 0.00% |  |
| B | 30397 | 21176 | 0 | 0 | 0.00% | 0.00% |  |
| C | 30397 | 21186 | 0 | 0 | 0.00% | 0.00% |  |
| D | 30397 | 21144 | 0 | 0 | 0.00% | 0.00% |  |
Top three noisy pixels from each quadrant. If the there are fewer than three noisy pixels in the level2.evt file, extra rows are filled as -1
| Pixel properties | Quadrant properties | ||||||
|---|---|---|---|---|---|---|---|
| Quadrant | DetID | PixID | Counts | Sigma | Mean | Median | Sigma |
| A | 0 | 29 | 1000 | 11.16 | 278 | 261 | 66.2 |
| A | 7 | 110 | 956 | 10.49 | 278 | 261 | 66.2 |
| A | 0 | 30 | 765 | 7.61 | 278 | 261 | 66.2 |
| B | 2 | 9 | 832 | 11.16 | 277 | 265 | 50.8 |
| B | 5 | 128 | 685 | 8.27 | 277 | 265 | 50.8 |
| B | 14 | 254 | 683 | 8.23 | 277 | 265 | 50.8 |
| C | 12 | 241 | 740 | 7.1 | 273 | 254 | 68.4 |
| C | 2 | 191 | 693 | 6.41 | 273 | 254 | 68.4 |
| C | 9 | 242 | 667 | 6.03 | 273 | 254 | 68.4 |
| D | 6 | 231 | 685 | 7.45 | 253 | 233 | 60.7 |
| D | 10 | 189 | 619 | 6.36 | 253 | 233 | 60.7 |
| D | 6 | 44 | 616 | 6.31 | 253 | 233 | 60.7 |
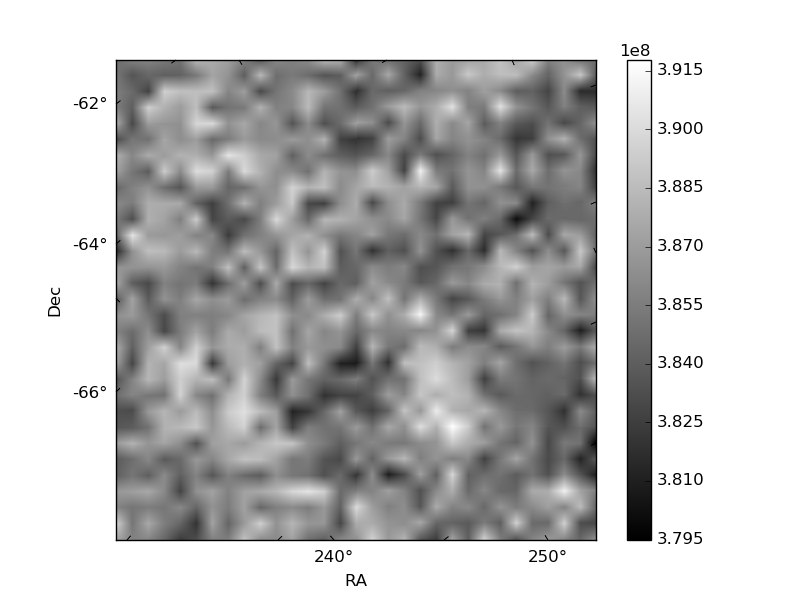
Histogram calculated using DETX and DETY for each event in the final _common_clean file
| Quadrant A | 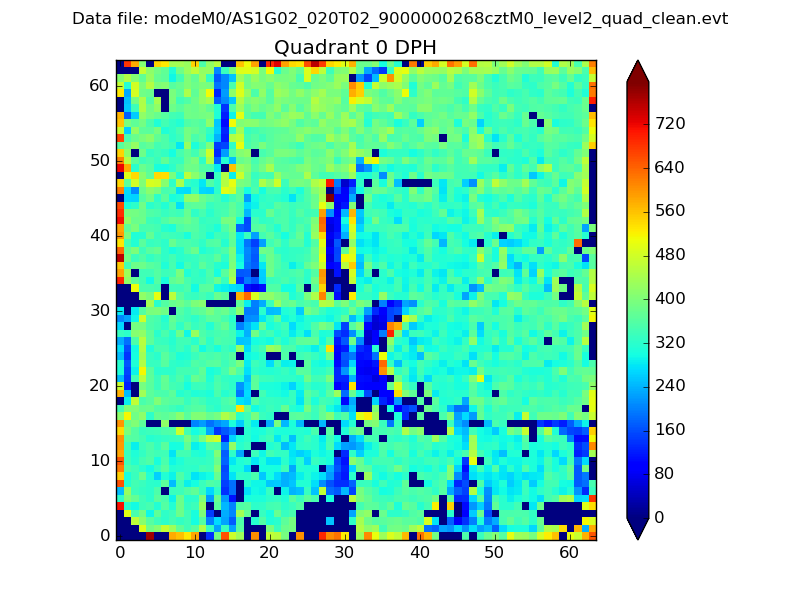 |
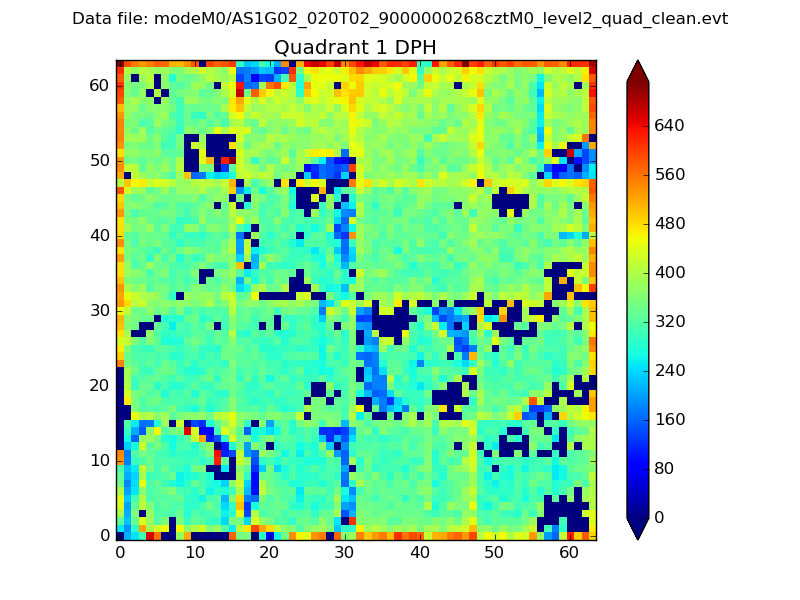 |
Quadrant B |
|---|---|---|---|
| Quadrant D | 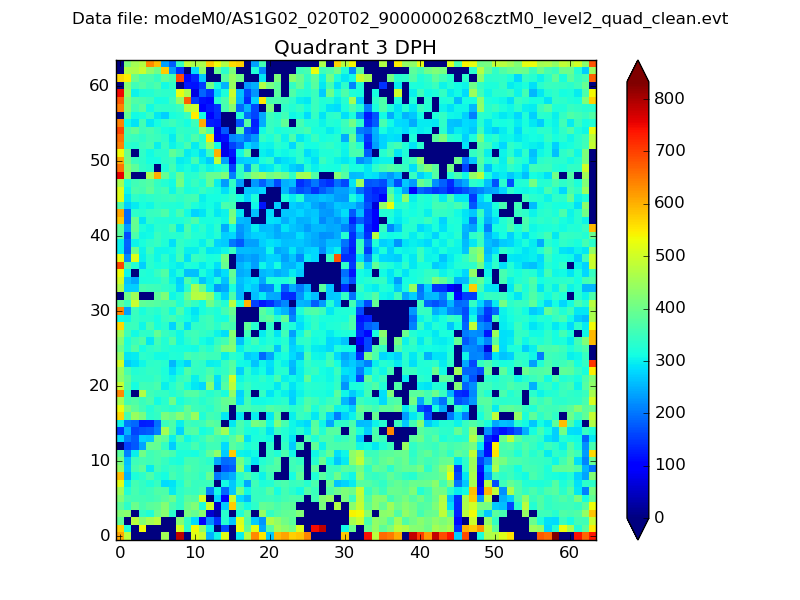 |
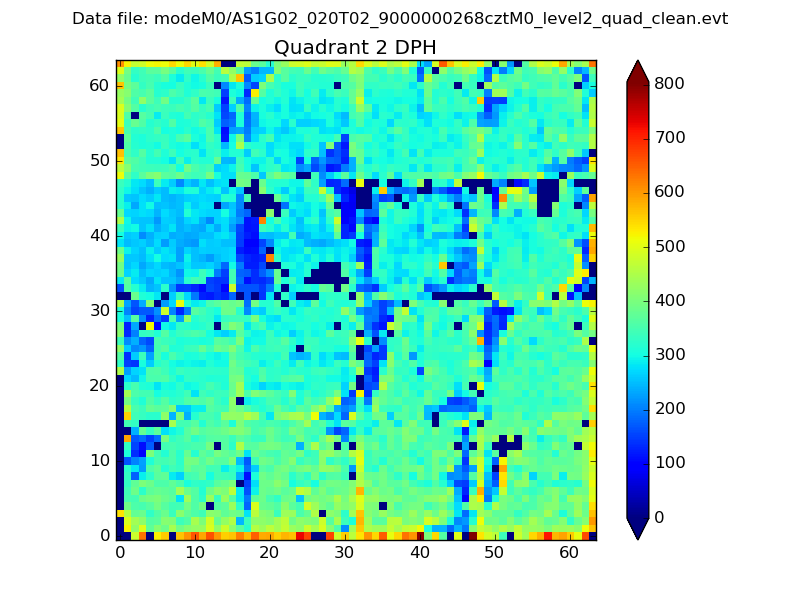 |
Quadrant C |
| Plot type | Count rate plots | Images |
|---|---|---|
| Comparison with Poisson distribution Blue bars denote a histogram of data divided into 1 sec bins. Red curve is a Poisson curve with rate = median count rate of data. |
 |
 |
| Quadrant-wise count rates Data is divided into 100 sec bins |
 |
|
| Module-wise count rates for Quadrant A Data is divided into 100 sec bins |
 |
 |
| Module-wise count rates for Quadrant B Data is divided into 100 sec bins |
 |
 |
| Module-wise count rates for Quadrant C Data is divided into 100 sec bins |
 |
 |
| Module-wise count rates for Quadrant D Data is divided into 100 sec bins |
 |
 |
| Parameter | Plot |
|---|---|
| CZT HV Monitor |  |
| D_VDD |  |
| Temperature 1 |  |
| Veto HV Monitor | 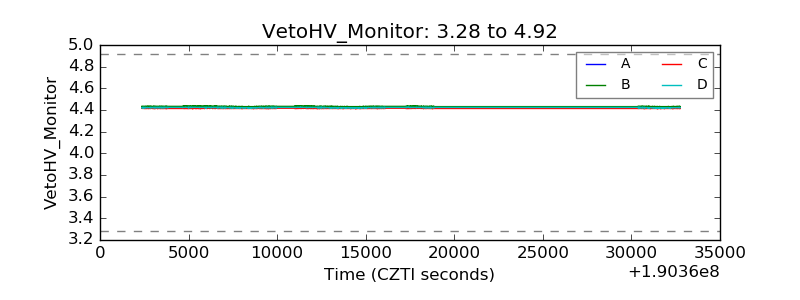 |
| Veto LLD |  |
| Alpha Counter |  |
| _CPM_Rate |  |
| CZT Counter |  |
| +2.5 Volts monitor |  |
| +5 Volts monitor |  |
| _ROLL_ROT |  |
| _Roll_DEC |  |
| _Roll_RA |  |
| Veto Counter |  |