| Param | Original file | Final file |
|---|---|---|
| Filename | modeM0/AS1G02_025T02_9000000270cztM0_level2.fits | modeM0/AS1G02_025T02_9000000270cztM0_level2_quad_clean.evt |
| Size (bytes) | 761,970,240 | 853,804,800 |
| Size | 726.7 MB | 814.3 MB |
| Events in quadrant A | 4,433,202 | 5,171,899 |
| Events in quadrant B | 4,433,410 | 5,161,831 |
| Events in quadrant C | 4,383,666 | 4,915,138 |
| Events in quadrant D | 3,728,124 | 4,513,912 |
| Mode M0 | |||
|---|---|---|---|
| Quadrant | BADHDUFLAG | Total packets | Discarded packets |
| A | 0 | 376347 | 0 |
| B | 0 | 389273 | 0 |
| C | 0 | 366208 | 0 |
| D | 0 | 369525 | 0 |
| Mode SS | |||
|---|---|---|---|
| Quadrant | BADHDUFLAG | Total packets | Discarded packets |
| A | 0 | 1816 | 0 |
| B | 0 | 1818 | 0 |
| C | 0 | 1816 | 0 |
| D | 0 | 1816 | 0 |
| Mode M9 | |||
|---|---|---|---|
| Quadrant | BADHDUFLAG | Total packets | Discarded packets |
| A | 0 | 127 | 0 |
| B | 0 | 127 | 0 |
| C | 0 | 127 | 0 |
| D | 0 | 127 | 0 |
| Quadrant | Total seconds | Saturated seconds | Saturation percentage |
|---|---|---|---|
| A | 88907 | 599 | 0.673738% |
| B | 88893 | 580 | 0.652470% |
| C | 88915 | 499 | 0.561210% |
| D | 88914 | 2464 | 2.771217% |
Noise dominated data is calculated using 1-second bins in cleaned event files. If a bin has >2000 counts, and if more than 50% of those come from <1% of pixels, then it is considered to be noise-dominated and hence unusable.
| Quadrant | # 1 sec bins | Bins with >0 counts | Bins with >2000 counts | High rate bins dominated by noise | Noise dominated (total time) | Noise dominated (detector-on time) | Marked lightcurve |
|---|---|---|---|---|---|---|---|
| A | 104275 | 88966 | 0 | 0 | 0.00% | 0.00% |  |
| B | 104275 | 88938 | 0 | 0 | 0.00% | 0.00% |  |
| C | 104275 | 88958 | 0 | 0 | 0.00% | 0.00% |  |
| D | 104275 | 88775 | 0 | 0 | 0.00% | 0.00% |  |
Top three noisy pixels from each quadrant. If the there are fewer than three noisy pixels in the level2.evt file, extra rows are filled as -1
| Pixel properties | Quadrant properties | ||||||
|---|---|---|---|---|---|---|---|
| Quadrant | DetID | PixID | Counts | Sigma | Mean | Median | Sigma |
| A | 7 | 110 | 3926 | 10.74 | 1149 | 1071 | 265.7 |
| A | 0 | 29 | 3886 | 10.59 | 1149 | 1071 | 265.7 |
| A | 14 | 79 | 3202 | 8.02 | 1149 | 1071 | 265.7 |
| B | 2 | 9 | 3568 | 11.4 | 1169 | 1106 | 215.9 |
| B | 14 | 254 | 2932 | 8.46 | 1169 | 1106 | 215.9 |
| B | 5 | 128 | 2894 | 8.28 | 1169 | 1106 | 215.9 |
| C | 12 | 241 | 2988 | 6.74 | 1156 | 1068 | 285.1 |
| C | 2 | 127 | 2932 | 6.54 | 1156 | 1068 | 285.1 |
| C | 2 | 191 | 2786 | 6.03 | 1156 | 1068 | 285.1 |
| D | 6 | 231 | 2658 | 6.7 | 1063 | 970 | 252.0 |
| D | 11 | 82 | 2629 | 6.58 | 1063 | 970 | 252.0 |
| D | 3 | 30 | 2616 | 6.53 | 1063 | 970 | 252.0 |
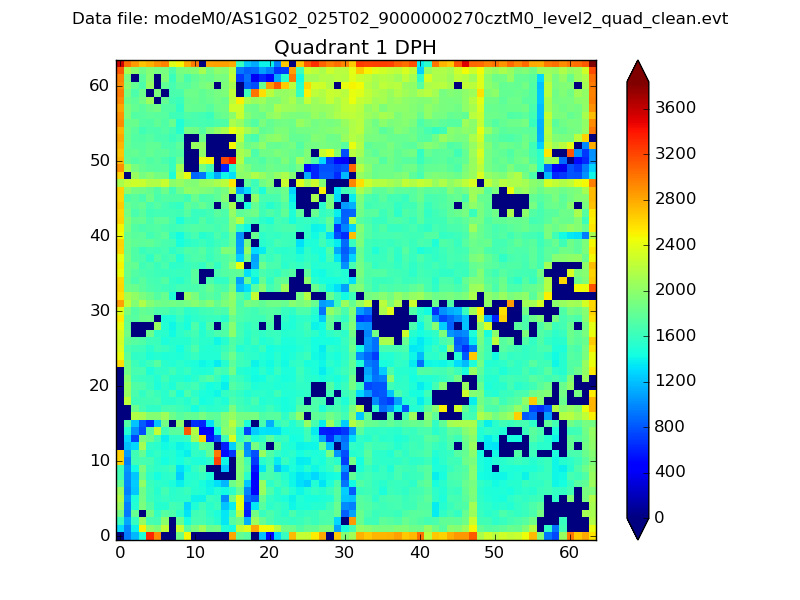
Histogram calculated using DETX and DETY for each event in the final _common_clean file
| Quadrant A |  |
 |
Quadrant B |
|---|---|---|---|
| Quadrant D |  |
 |
Quadrant C |
| Plot type | Count rate plots | Images |
|---|---|---|
| Comparison with Poisson distribution Blue bars denote a histogram of data divided into 1 sec bins. Red curve is a Poisson curve with rate = median count rate of data. |
 |
 |
| Quadrant-wise count rates Data is divided into 100 sec bins |
 |
|
| Module-wise count rates for Quadrant A Data is divided into 100 sec bins |
 |
 |
| Module-wise count rates for Quadrant B Data is divided into 100 sec bins |
 |
 |
| Module-wise count rates for Quadrant C Data is divided into 100 sec bins |
 |
 |
| Module-wise count rates for Quadrant D Data is divided into 100 sec bins |
 |
 |
| Parameter | Plot |
|---|---|
| CZT HV Monitor |  |
| D_VDD |  |
| Temperature 1 |  |
| Veto HV Monitor |  |
| Veto LLD |  |
| Alpha Counter |  |
| _CPM_Rate |  |
| CZT Counter |  |
| +2.5 Volts monitor |  |
| +5 Volts monitor |  |
| _ROLL_ROT |  |
| _Roll_DEC |  |
| _Roll_RA |  |
| Veto Counter |  |