| Param | Original file | Final file |
|---|---|---|
| Filename | modeM0/AS1G02_052T02_9000000276cztM0_level2.fits | modeM0/AS1G02_052T02_9000000276cztM0_level2_quad_clean.evt |
| Size (bytes) | 962,818,560 | 942,220,800 |
| Size | 918.2 MB | 898.6 MB |
| Events in quadrant A | 5,660,432 | 5,464,469 |
| Events in quadrant B | 5,543,121 | 5,463,681 |
| Events in quadrant C | 5,610,948 | 5,283,653 |
| Events in quadrant D | 4,794,570 | 4,777,158 |
| Mode M9 | |||
|---|---|---|---|
| Quadrant | BADHDUFLAG | Total packets | Discarded packets |
| A | 0 | 204 | 0 |
| B | 0 | 204 | 0 |
| C | 0 | 204 | 0 |
| D | 0 | 204 | 0 |
| Mode M0 | |||
|---|---|---|---|
| Quadrant | BADHDUFLAG | Total packets | Discarded packets |
| A | 0 | 475596 | 0 |
| B | 0 | 521026 | 0 |
| C | 0 | 464652 | 0 |
| D | 0 | 468931 | 0 |
| Mode SS | |||
|---|---|---|---|
| Quadrant | BADHDUFLAG | Total packets | Discarded packets |
| A | 0 | 2276 | 0 |
| B | 0 | 2271 | 0 |
| C | 0 | 2276 | 0 |
| D | 0 | 2274 | 0 |
| Quadrant | Total seconds | Saturated seconds | Saturation percentage |
|---|---|---|---|
| A | 110003 | 731 | 0.664527% |
| B | 109915 | 2378 | 2.163490% |
| C | 110065 | 609 | 0.553309% |
| D | 109994 | 2580 | 2.345582% |
Noise dominated data is calculated using 1-second bins in cleaned event files. If a bin has >2000 counts, and if more than 50% of those come from <1% of pixels, then it is considered to be noise-dominated and hence unusable.
| Quadrant | # 1 sec bins | Bins with >0 counts | Bins with >2000 counts | High rate bins dominated by noise | Noise dominated (total time) | Noise dominated (detector-on time) | Marked lightcurve |
|---|---|---|---|---|---|---|---|
| A | 161575 | 111290 | 0 | 0 | 0.00% | 0.00% |  |
| B | 161575 | 111155 | 0 | 0 | 0.00% | 0.00% |  |
| C | 161575 | 111361 | 0 | 0 | 0.00% | 0.00% |  |
| D | 161575 | 111113 | 0 | 0 | 0.00% | 0.00% |  |
Top three noisy pixels from each quadrant. If the there are fewer than three noisy pixels in the level2.evt file, extra rows are filled as -1
| Pixel properties | Quadrant properties | ||||||
|---|---|---|---|---|---|---|---|
| Quadrant | DetID | PixID | Counts | Sigma | Mean | Median | Sigma |
| A | 0 | 29 | 5220 | 11.25 | 1466 | 1363 | 342.8 |
| A | 7 | 110 | 5012 | 10.64 | 1466 | 1363 | 342.8 |
| A | 9 | 19 | 4109 | 8.01 | 1466 | 1363 | 342.8 |
| B | 2 | 9 | 4486 | 11.82 | 1461 | 1389 | 261.9 |
| B | 14 | 254 | 3615 | 8.5 | 1461 | 1389 | 261.9 |
| B | 5 | 128 | 3602 | 8.45 | 1461 | 1389 | 261.9 |
| C | 9 | 242 | 3746 | 6.66 | 1480 | 1370 | 356.8 |
| C | 12 | 241 | 3735 | 6.63 | 1480 | 1370 | 356.8 |
| C | 1 | 81 | 3471 | 5.89 | 1480 | 1370 | 356.8 |
| D | 1 | 19 | 3525 | 7.18 | 1371 | 1254 | 316.2 |
| D | 6 | 231 | 3405 | 6.8 | 1371 | 1254 | 316.2 |
| D | 11 | 82 | 3336 | 6.58 | 1371 | 1254 | 316.2 |
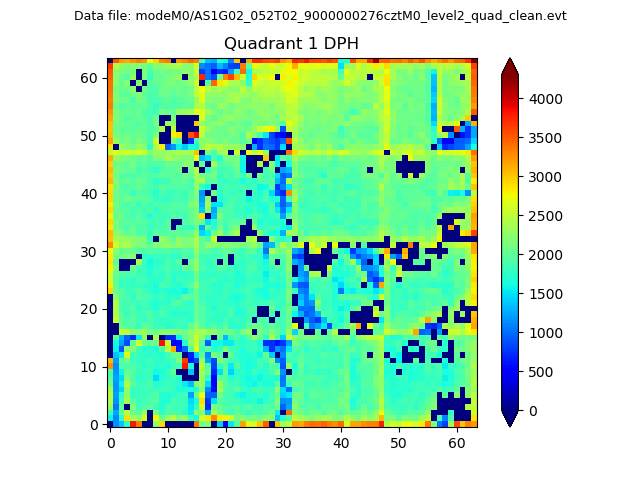
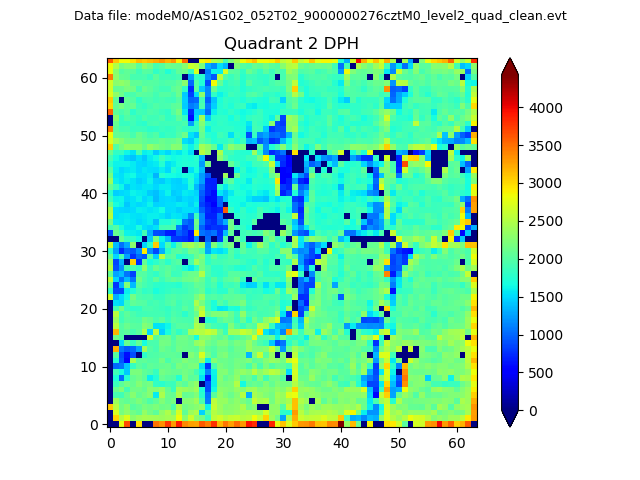
Histogram calculated using DETX and DETY for each event in the final _common_clean file
| Quadrant A |  |
 |
Quadrant B |
|---|---|---|---|
| Quadrant D |  |
 |
Quadrant C |
| Plot type | Count rate plots | Images |
|---|---|---|
| Comparison with Poisson distribution Blue bars denote a histogram of data divided into 1 sec bins. Red curve is a Poisson curve with rate = median count rate of data. |
 |
 |
| Quadrant-wise count rates Data is divided into 100 sec bins |
 |
|
| Module-wise count rates for Quadrant A Data is divided into 100 sec bins |
 |
 |
| Module-wise count rates for Quadrant B Data is divided into 100 sec bins |
 |
 |
| Module-wise count rates for Quadrant C Data is divided into 100 sec bins |
 |
 |
| Module-wise count rates for Quadrant D Data is divided into 100 sec bins |
 |
 |
| Parameter | Plot |
|---|---|
| CZT HV Monitor |  |
| D_VDD |  |
| Temperature 1 |  |
| Veto HV Monitor |  |
| Veto LLD |  |
| Alpha Counter |  |
| _CPM_Rate |  |
| CZT Counter |  |
| +2.5 Volts monitor |  |
| +5 Volts monitor |  |
| _ROLL_ROT |  |
| _Roll_DEC |  |
| _Roll_RA |  |
| Veto Counter |  |