| Param | Original file | Final file |
|---|---|---|
| Filename | modeM0/AS1G02_049T01_9000000280cztM0_level2.fits | modeM0/AS1G02_049T01_9000000280cztM0_level2_quad_clean.evt |
| Size (bytes) | 1,242,213,120 | 1,797,615,360 |
| Size | 1.2 GB | 1.7 GB |
| Events in quadrant A | 7,197,658 | 11,581,397 |
| Events in quadrant B | 7,042,688 | 11,551,206 |
| Events in quadrant C | 7,065,758 | 10,986,989 |
| Events in quadrant D | 6,145,334 | 10,162,545 |
| Mode M0 | |||
|---|---|---|---|
| Quadrant | BADHDUFLAG | Total packets | Discarded packets |
| A | 0 | 634593 | 0 |
| B | 0 | 706416 | 0 |
| C | 0 | 616752 | 0 |
| D | 0 | 602135 | 0 |
| Mode M9 | |||
|---|---|---|---|
| Quadrant | BADHDUFLAG | Total packets | Discarded packets |
| A | 0 | 216 | 0 |
| B | 0 | 209 | 0 |
| C | 0 | 216 | 0 |
| D | 0 | 210 | 0 |
| Mode SS | |||
|---|---|---|---|
| Quadrant | BADHDUFLAG | Total packets | Discarded packets |
| A | 0 | 2714 | 0 |
| B | 0 | 2708 | 0 |
| C | 0 | 2702 | 0 |
| D | 0 | 2706 | 0 |
| Quadrant | Total seconds | Saturated seconds | Saturation percentage |
|---|---|---|---|
| A | 149470 | 584 | 0.390714% |
| B | 149470 | 1613 | 1.079146% |
| C | 149509 | 418 | 0.279582% |
| D | 149487 | 962 | 0.643534% |
Noise dominated data is calculated using 1-second bins in cleaned event files. If a bin has >2000 counts, and if more than 50% of those come from <1% of pixels, then it is considered to be noise-dominated and hence unusable.
| Quadrant | # 1 sec bins | Bins with >0 counts | Bins with >2000 counts | High rate bins dominated by noise | Noise dominated (total time) | Noise dominated (detector-on time) | Marked lightcurve |
|---|---|---|---|---|---|---|---|
| A | 183671 | 149600 | 0 | 0 | 0.00% | 0.00% |  |
| B | 183670 | 149600 | 0 | 0 | 0.00% | 0.00% |  |
| C | 183671 | 149646 | 0 | 0 | 0.00% | 0.00% |  |
| D | 183671 | 149602 | 0 | 0 | 0.00% | 0.00% |  |
Top three noisy pixels from each quadrant. If the there are fewer than three noisy pixels in the level2.evt file, extra rows are filled as -1
| Pixel properties | Quadrant properties | ||||||
|---|---|---|---|---|---|---|---|
| Quadrant | DetID | PixID | Counts | Sigma | Mean | Median | Sigma |
| A | 0 | 29 | 6796 | 11.62 | 1864 | 1736 | 435.5 |
| A | 7 | 110 | 6258 | 10.38 | 1864 | 1736 | 435.5 |
| A | 9 | 19 | 5198 | 7.95 | 1864 | 1736 | 435.5 |
| B | 2 | 9 | 5685 | 11.77 | 1862 | 1772 | 332.5 |
| B | 5 | 128 | 4543 | 8.33 | 1862 | 1772 | 332.5 |
| B | 14 | 254 | 4479 | 8.14 | 1862 | 1772 | 332.5 |
| C | 12 | 241 | 4867 | 7.03 | 1863 | 1719 | 447.7 |
| C | 9 | 242 | 4560 | 6.34 | 1863 | 1719 | 447.7 |
| C | 2 | 191 | 4552 | 6.33 | 1863 | 1719 | 447.7 |
| D | 1 | 19 | 4570 | 7.19 | 1752 | 1604 | 412.3 |
| D | 11 | 82 | 4366 | 6.7 | 1752 | 1604 | 412.3 |
| D | 6 | 44 | 4320 | 6.59 | 1752 | 1604 | 412.3 |
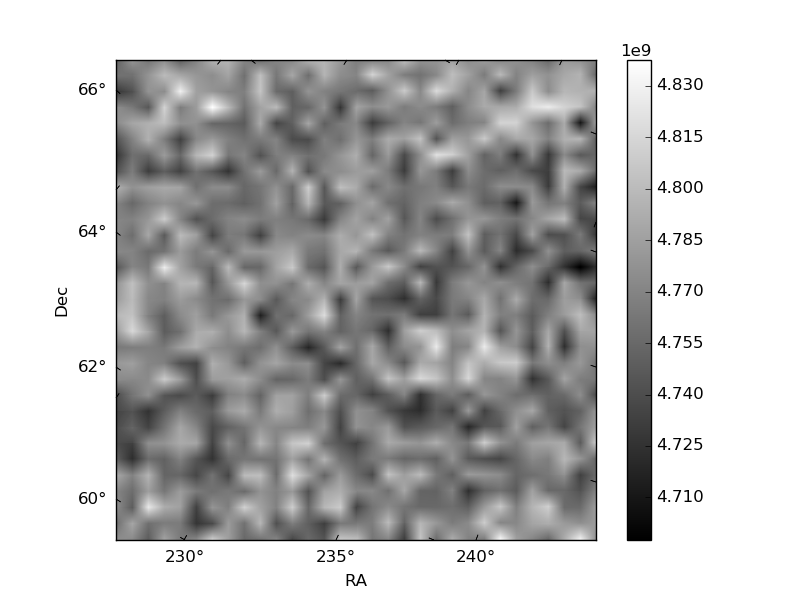
Histogram calculated using DETX and DETY for each event in the final _common_clean file
| Quadrant A |  |
 |
Quadrant B |
|---|---|---|---|
| Quadrant D |  |
 |
Quadrant C |
| Plot type | Count rate plots | Images |
|---|---|---|
| Comparison with Poisson distribution Blue bars denote a histogram of data divided into 1 sec bins. Red curve is a Poisson curve with rate = median count rate of data. |
 |
 |
| Quadrant-wise count rates Data is divided into 100 sec bins |
 |
|
| Module-wise count rates for Quadrant A Data is divided into 100 sec bins |
 |
 |
| Module-wise count rates for Quadrant B Data is divided into 100 sec bins |
 |
 |
| Module-wise count rates for Quadrant C Data is divided into 100 sec bins |
 |
 |
| Module-wise count rates for Quadrant D Data is divided into 100 sec bins |
 |
 |
| Parameter | Plot |
|---|---|
| CZT HV Monitor |  |
| D_VDD |  |
| Temperature 1 |  |
| Veto HV Monitor |  |
| Veto LLD |  |
| Alpha Counter |  |
| _CPM_Rate |  |
| CZT Counter |  |
| +2.5 Volts monitor |  |
| +5 Volts monitor |  |
| _ROLL_ROT |  |
| _Roll_DEC |  |
| _Roll_RA | 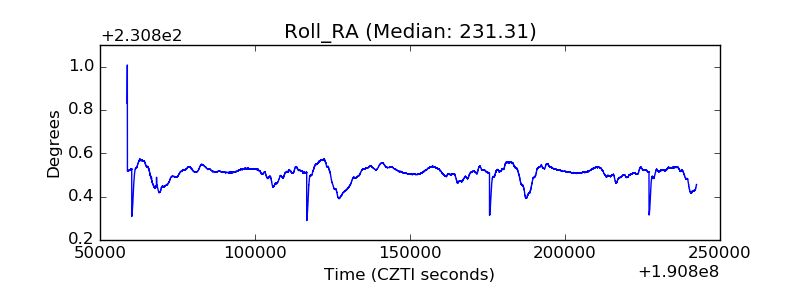 |
| Veto Counter |  |