| Param | Original file | Final file |
|---|---|---|
| Filename | modeM0/AS1G02_049T01_9000000280_01673cztM0_level2.fits | modeM0/AS1G02_049T01_9000000280_01673cztM0_level2_quad_clean.evt |
| Size (bytes) | 882,656,640 | 109,077,120 |
| Size | 841.8 MB | 104.0 MB |
| Events in quadrant A | 8,263,845 | 721,825 |
| Events in quadrant B | 8,747,700 | 744,607 |
| Events in quadrant C | 7,850,350 | 703,435 |
| Events in quadrant D | 7,283,554 | 652,430 |
| Mode M0 | |||
|---|---|---|---|
| Quadrant | BADHDUFLAG | Total packets | Discarded packets |
| A | 0 | 29489 | 3 |
| B | 0 | 30882 | 2 |
| C | 0 | 28227 | 2 |
| D | 0 | 26615 | 2 |
| Mode M9 | |||
|---|---|---|---|
| Quadrant | BADHDUFLAG | Total packets | Discarded packets |
| A | 0 | 10 | 0 |
| B | 0 | 10 | 0 |
| C | 0 | 10 | 0 |
| D | 0 | 11 | 0 |
| Mode SS | |||
|---|---|---|---|
| Quadrant | BADHDUFLAG | Total packets | Discarded packets |
| A | 0 | 138 | 0 |
| B | 0 | 138 | 0 |
| C | 0 | 138 | 0 |
| D | 0 | 138 | 0 |
| Quadrant | Total seconds | Saturated seconds | Saturation percentage |
|---|---|---|---|
| A | 6909 | 7 | 0.101317% |
| B | 6909 | 11 | 0.159213% |
| C | 6909 | 25 | 0.361847% |
| D | 6909 | 4 | 0.057895% |
Noise dominated data is calculated using 1-second bins in cleaned event files. If a bin has >2000 counts, and if more than 50% of those come from <1% of pixels, then it is considered to be noise-dominated and hence unusable.
| Quadrant | # 1 sec bins | Bins with >0 counts | Bins with >2000 counts | High rate bins dominated by noise | Noise dominated (total time) | Noise dominated (detector-on time) | Marked lightcurve |
|---|---|---|---|---|---|---|---|
| A | 7734 | 6910 | 179 | 179 | 2.31% | 2.59% | 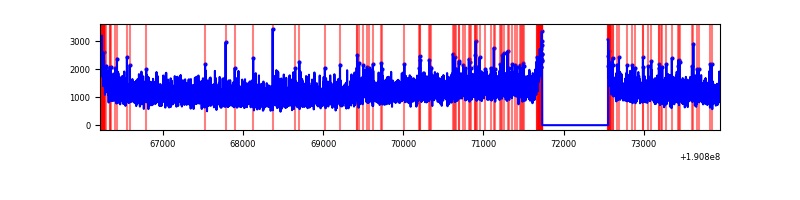 |
| B | 7734 | 6910 | 213 | 213 | 2.75% | 3.08% | 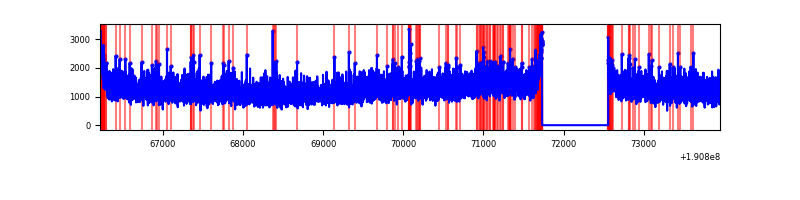 |
| C | 7734 | 6910 | 168 | 168 | 2.17% | 2.43% | 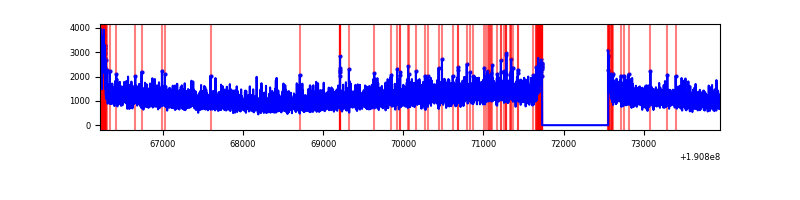 |
| D | 7734 | 6910 | 77 | 77 | 1.00% | 1.11% | 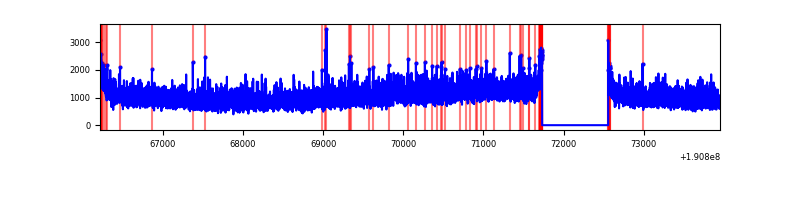 |
Top three noisy pixels from each quadrant. If the there are fewer than three noisy pixels in the level2.evt file, extra rows are filled as -1
| Pixel properties | Quadrant properties | ||||||
|---|---|---|---|---|---|---|---|
| Quadrant | DetID | PixID | Counts | Sigma | Mean | Median | Sigma |
| A | 14 | 5 | 137914 | 265.96 | 2119 | 2139 | 510.5 |
| A | 8 | 14 | 20586 | 36.13 | 2119 | 2139 | 510.5 |
| A | 0 | 128 | 5981 | 7.53 | 2119 | 2139 | 510.5 |
| B | 8 | 3 | 319204 | 604.69 | 2210 | 2217 | 524.2 |
| B | 0 | 220 | 25833 | 45.05 | 2210 | 2217 | 524.2 |
| B | 0 | 234 | 19981 | 33.89 | 2210 | 2217 | 524.2 |
| C | 9 | 85 | 61015 | 106.59 | 1979 | 2044 | 553.2 |
| C | 8 | 208 | 48874 | 84.65 | 1979 | 2044 | 553.2 |
| C | 12 | 4 | 11543 | 17.17 | 1979 | 2044 | 553.2 |
| D | 7 | 34 | 23481 | 39.25 | 1938 | 1978 | 547.9 |
| D | 9 | 65 | 13014 | 20.14 | 1938 | 1978 | 547.9 |
| D | 2 | 54 | 9626 | 13.96 | 1938 | 1978 | 547.9 |
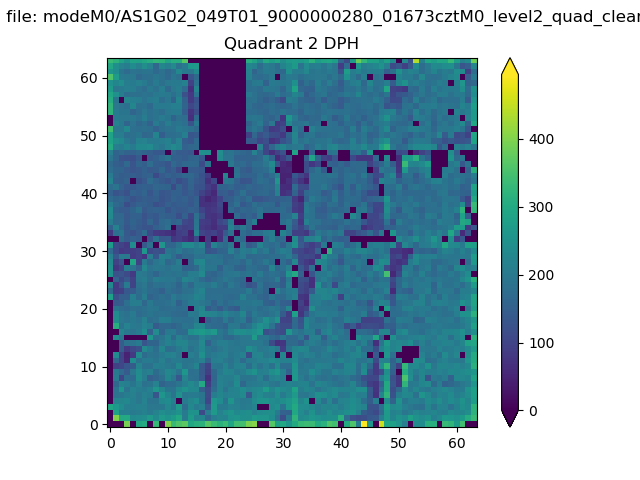
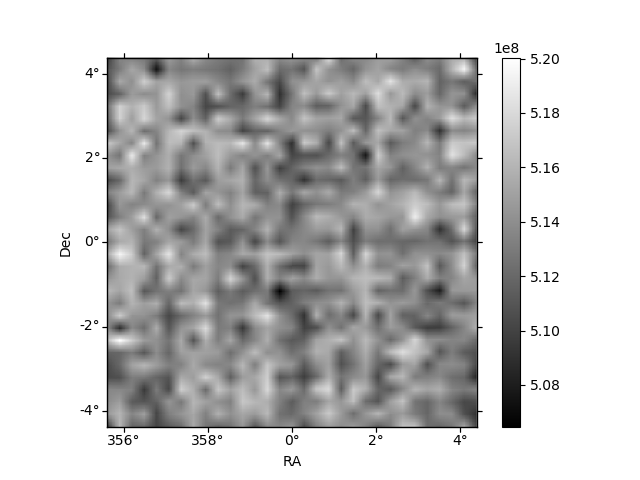
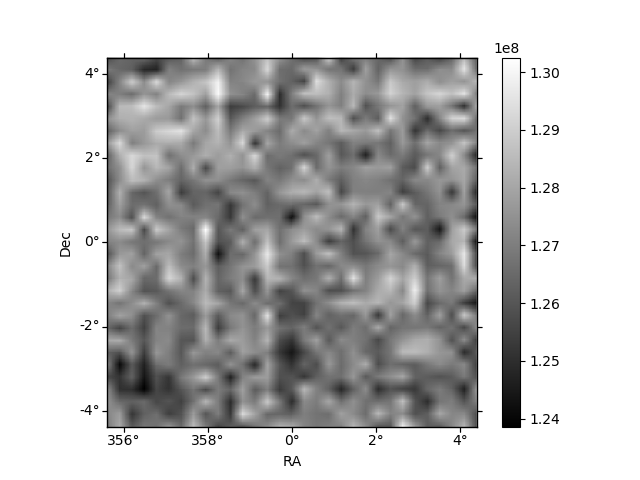
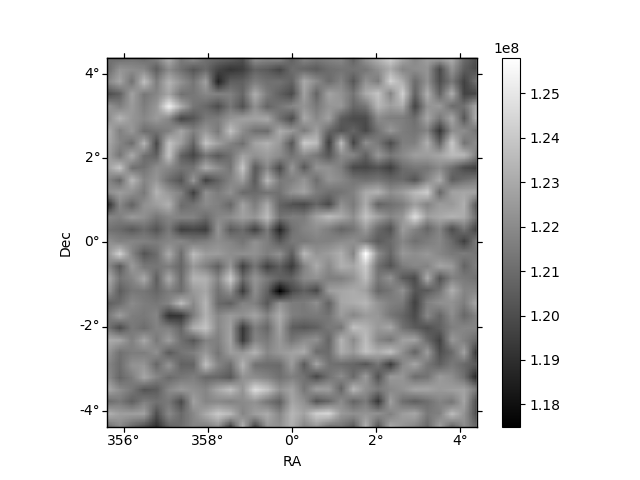
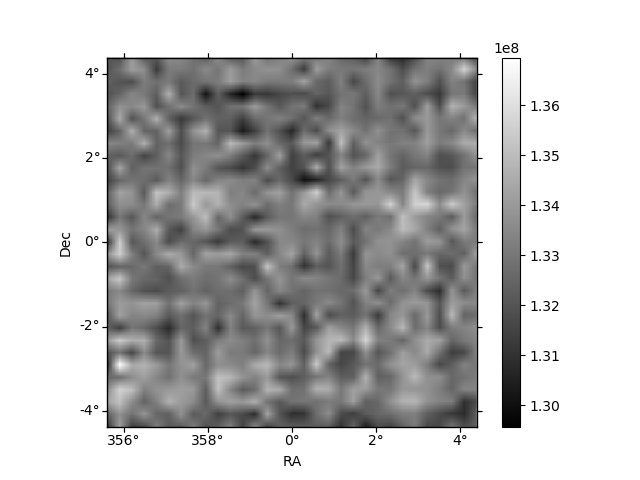
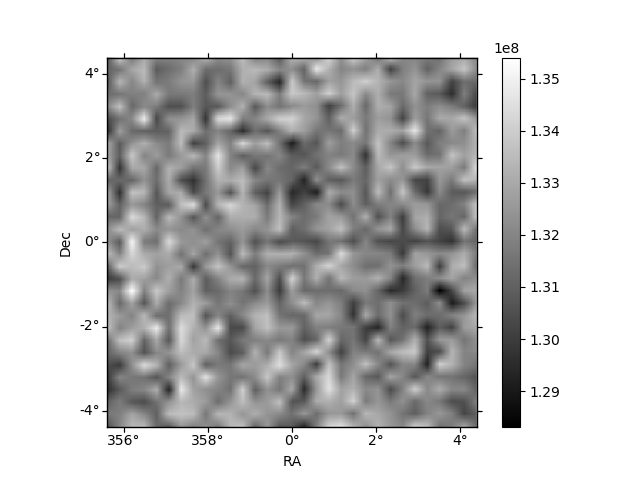
Histogram calculated using DETX and DETY for each event in the final _common_clean file
| Quadrant A | 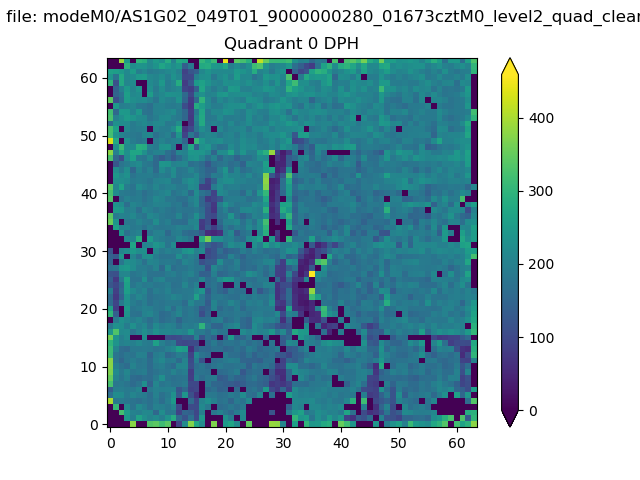 |
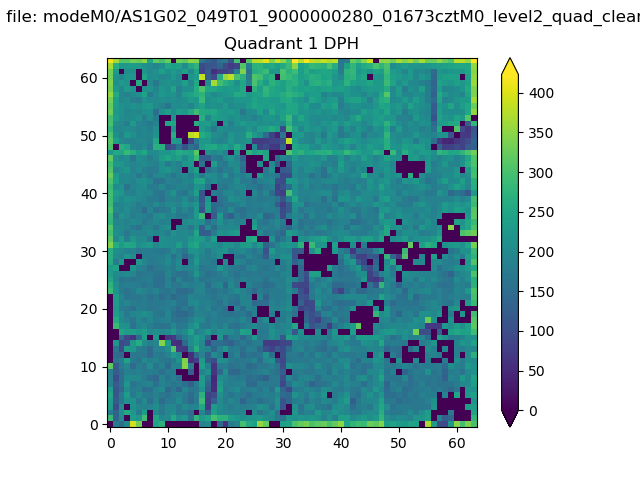 |
Quadrant B |
|---|---|---|---|
| Quadrant D | 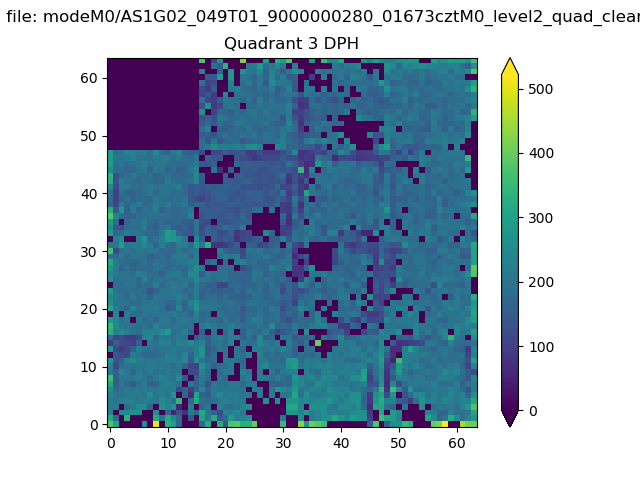 |
 |
Quadrant C |
| Plot type | Count rate plots | Images |
|---|---|---|
| Comparison with Poisson distribution Blue bars denote a histogram of data divided into 1 sec bins. Red curve is a Poisson curve with rate = median count rate of data. |
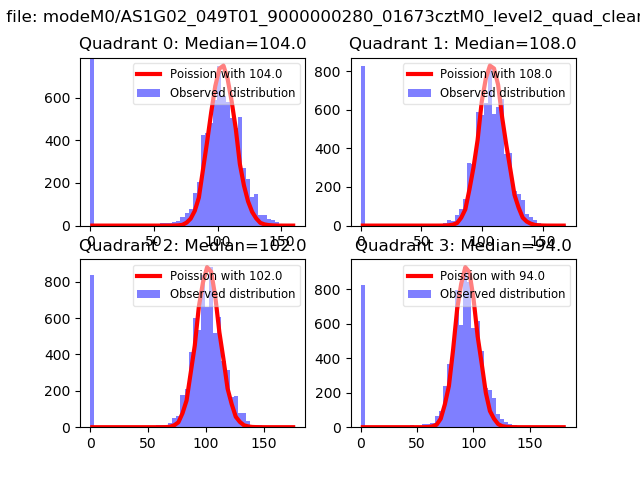 |
 |
| Quadrant-wise count rates Data is divided into 100 sec bins |
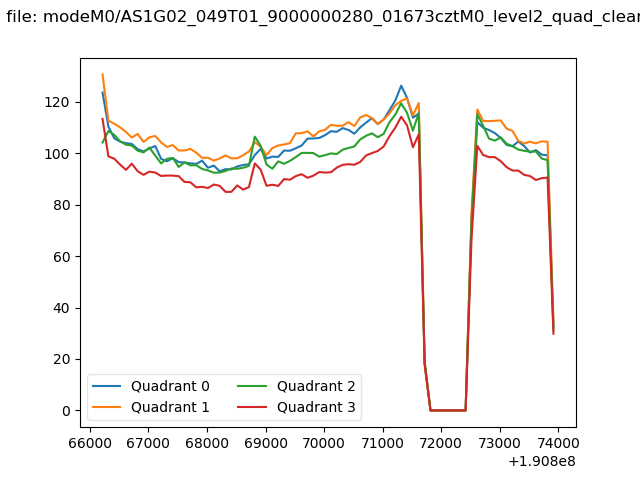 |
|
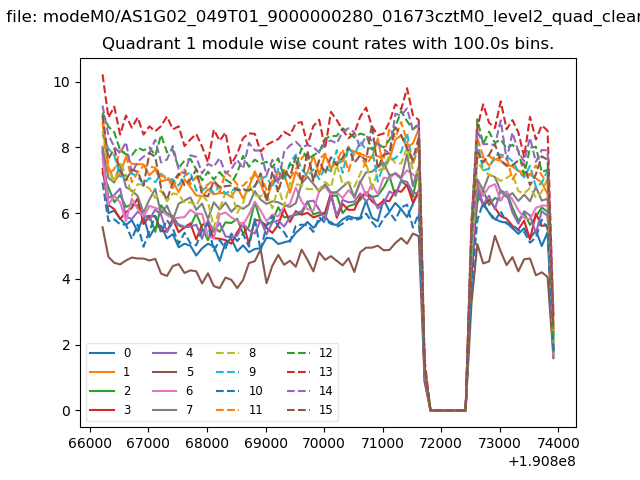
| Module-wise count rates for Quadrant A Data is divided into 100 sec bins |
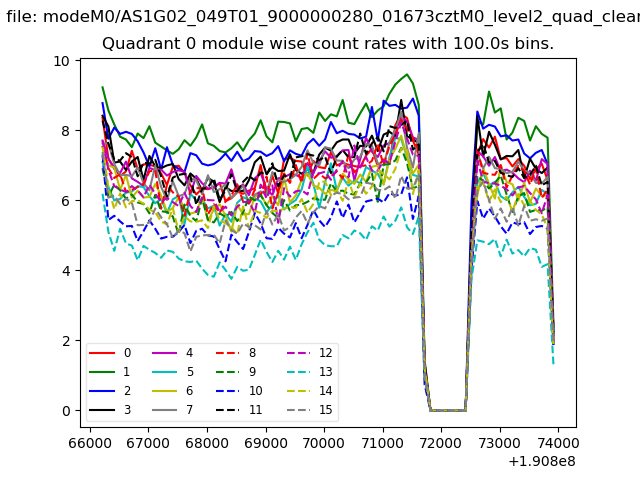 |
 |
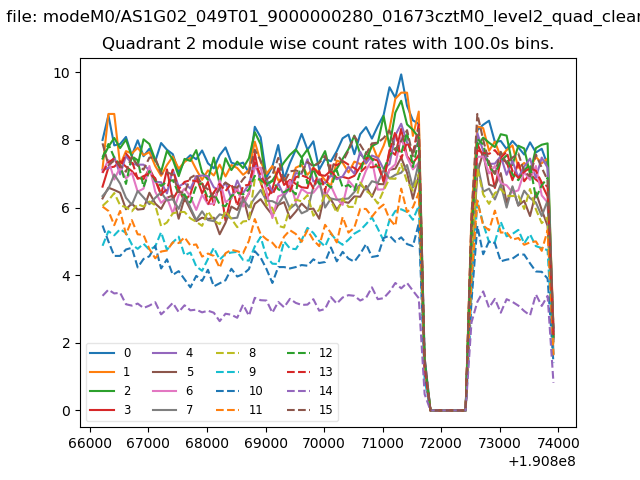
| Module-wise count rates for Quadrant B Data is divided into 100 sec bins |
 |
 |
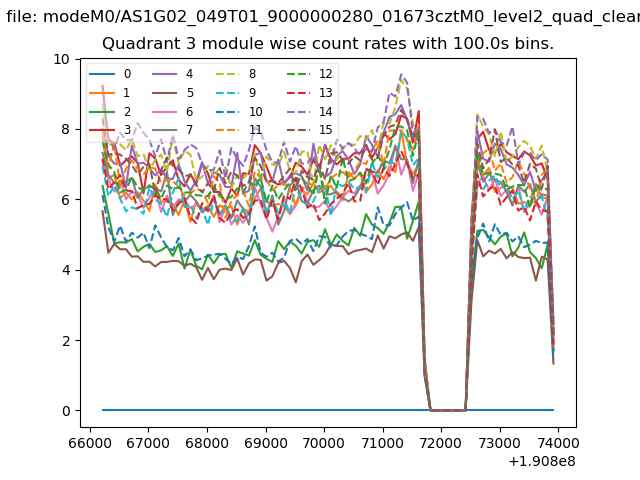
| Module-wise count rates for Quadrant C Data is divided into 100 sec bins |
 |
 |
| Module-wise count rates for Quadrant D Data is divided into 100 sec bins |
 |
 |
| Parameter | Plot |
|---|---|
| CZT HV Monitor | 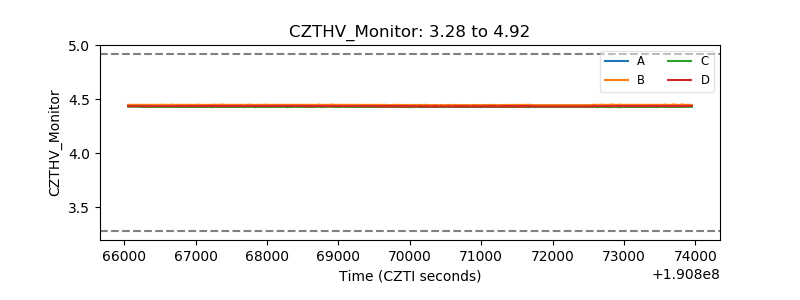 |
| D_VDD | 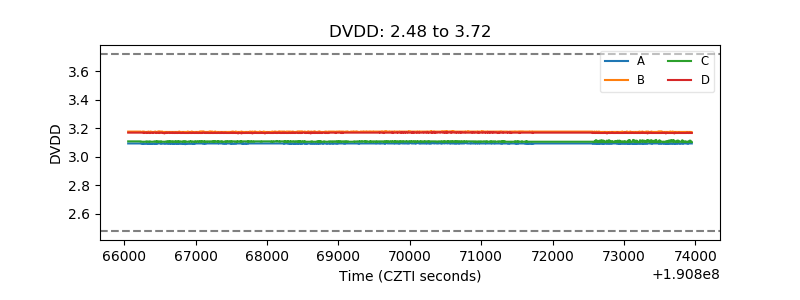 |
| Temperature 1 | 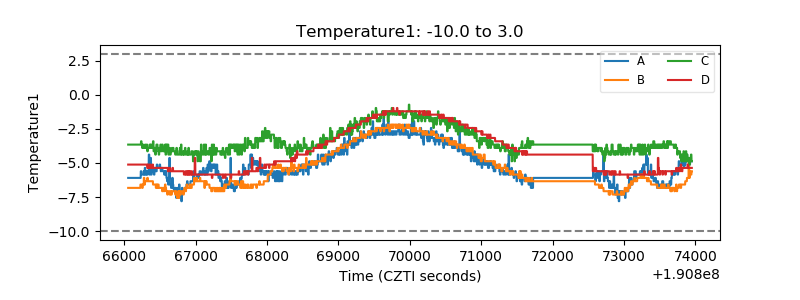 |
| Veto HV Monitor | 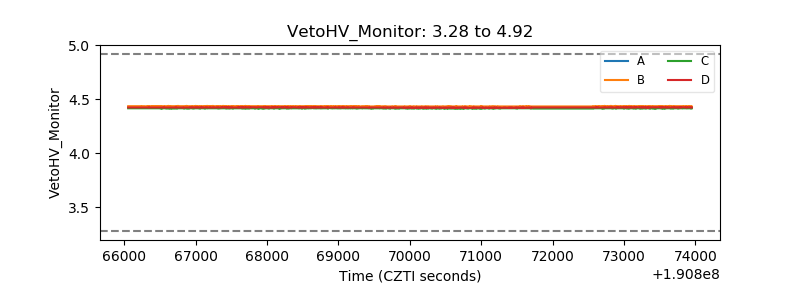 |
| Veto LLD | 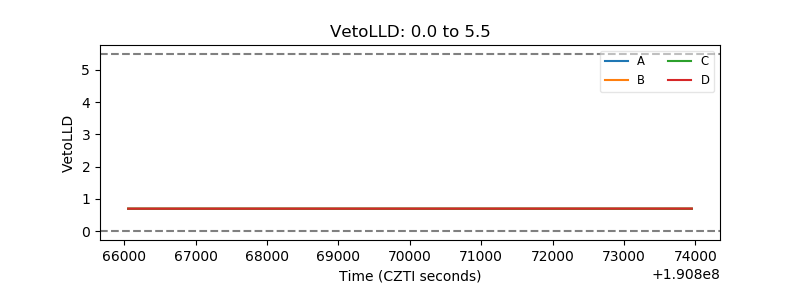 |
| Alpha Counter | 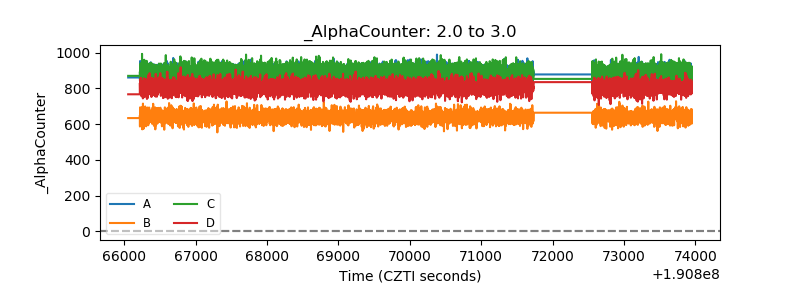 |
| _CPM_Rate | 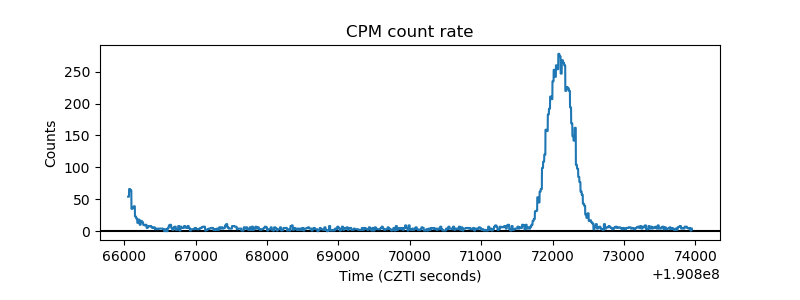 |
| CZT Counter | 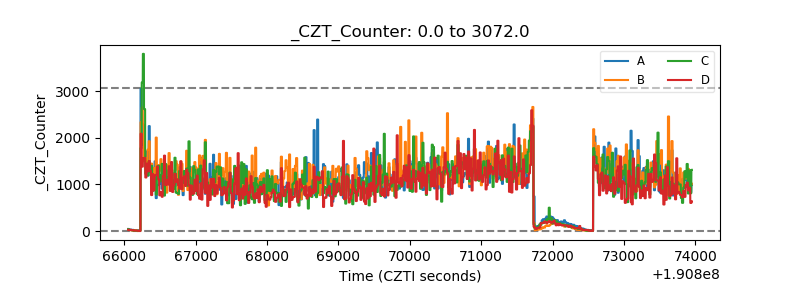 |
| +2.5 Volts monitor |  |
| +5 Volts monitor |  |
| _ROLL_ROT | 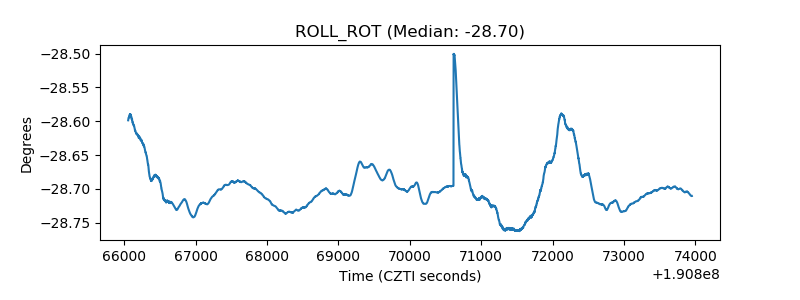 |
| _Roll_DEC | 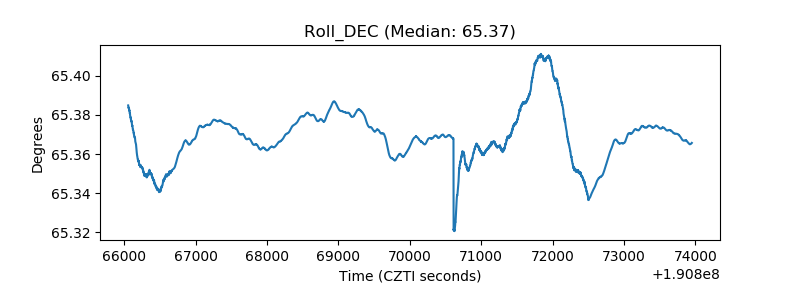 |
| _Roll_RA | 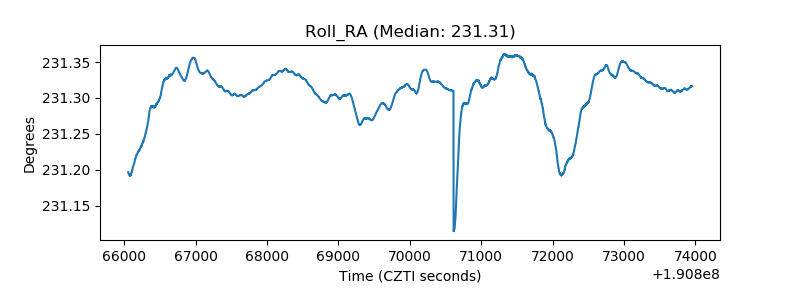 |
| Veto Counter | 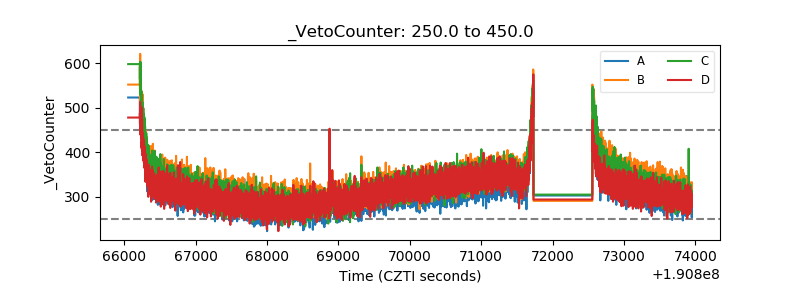 |