| Param | Original file | Final file |
|---|---|---|
| Filename | modeM0/AS1G02_051T01_9000000278cztM0_level2.fits | modeM0/AS1G02_051T01_9000000278cztM0_level2_quad_clean.evt |
| Size (bytes) | 535,694,400 | 541,558,080 |
| Size | 510.9 MB | 516.5 MB |
| Events in quadrant A | 3,138,724 | 3,172,578 |
| Events in quadrant B | 3,091,566 | 3,181,072 |
| Events in quadrant C | 3,103,838 | 3,042,751 |
| Events in quadrant D | 2,668,170 | 2,783,920 |
| Mode M0 | |||
|---|---|---|---|
| Quadrant | BADHDUFLAG | Total packets | Discarded packets |
| A | 0 | 264876 | 0 |
| B | 0 | 278411 | 0 |
| C | 0 | 257560 | 0 |
| D | 0 | 251318 | 0 |
| Mode SS | |||
|---|---|---|---|
| Quadrant | BADHDUFLAG | Total packets | Discarded packets |
| A | 0 | 1250 | 0 |
| B | 0 | 1250 | 0 |
| C | 0 | 1250 | 0 |
| D | 0 | 1250 | 0 |
| Mode M9 | |||
|---|---|---|---|
| Quadrant | BADHDUFLAG | Total packets | Discarded packets |
| A | 0 | 98 | 0 |
| B | 0 | 98 | 0 |
| C | 0 | 98 | 0 |
| D | 0 | 98 | 0 |
| Quadrant | Total seconds | Saturated seconds | Saturation percentage |
|---|---|---|---|
| A | 61546 | 505 | 0.820524% |
| B | 61546 | 614 | 0.997628% |
| C | 61545 | 360 | 0.584938% |
| D | 61544 | 909 | 1.476992% |
Noise dominated data is calculated using 1-second bins in cleaned event files. If a bin has >2000 counts, and if more than 50% of those come from <1% of pixels, then it is considered to be noise-dominated and hence unusable.
| Quadrant | # 1 sec bins | Bins with >0 counts | Bins with >2000 counts | High rate bins dominated by noise | Noise dominated (total time) | Noise dominated (detector-on time) | Marked lightcurve |
|---|---|---|---|---|---|---|---|
| A | 71211 | 61540 | 0 | 0 | 0.00% | 0.00% |  |
| B | 71211 | 61538 | 0 | 0 | 0.00% | 0.00% |  |
| C | 71211 | 61540 | 0 | 0 | 0.00% | 0.00% | 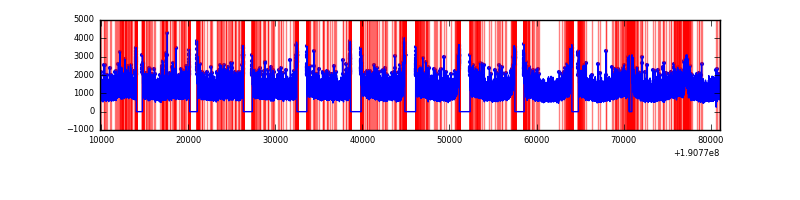 |
| D | 71209 | 61504 | 0 | 0 | 0.00% | 0.00% |  |
Top three noisy pixels from each quadrant. If the there are fewer than three noisy pixels in the level2.evt file, extra rows are filled as -1
| Pixel properties | Quadrant properties | ||||||
|---|---|---|---|---|---|---|---|
| Quadrant | DetID | PixID | Counts | Sigma | Mean | Median | Sigma |
| A | 0 | 29 | 2801 | 10.64 | 814 | 758 | 192.0 |
| A | 7 | 110 | 2719 | 10.21 | 814 | 758 | 192.0 |
| A | 14 | 79 | 2280 | 7.93 | 814 | 758 | 192.0 |
| B | 2 | 9 | 2539 | 12.08 | 815 | 773 | 146.2 |
| B | 14 | 254 | 1980 | 8.25 | 815 | 773 | 146.2 |
| B | 2 | 8 | 1977 | 8.23 | 815 | 773 | 146.2 |
| C | 12 | 241 | 2089 | 6.67 | 818 | 756 | 199.8 |
| C | 2 | 191 | 2019 | 6.32 | 818 | 756 | 199.8 |
| C | 9 | 242 | 1989 | 6.17 | 818 | 756 | 199.8 |
| D | 6 | 231 | 1940 | 6.92 | 762 | 698 | 179.6 |
| D | 1 | 19 | 1937 | 6.9 | 762 | 698 | 179.6 |
| D | 6 | 44 | 1887 | 6.62 | 762 | 698 | 179.6 |
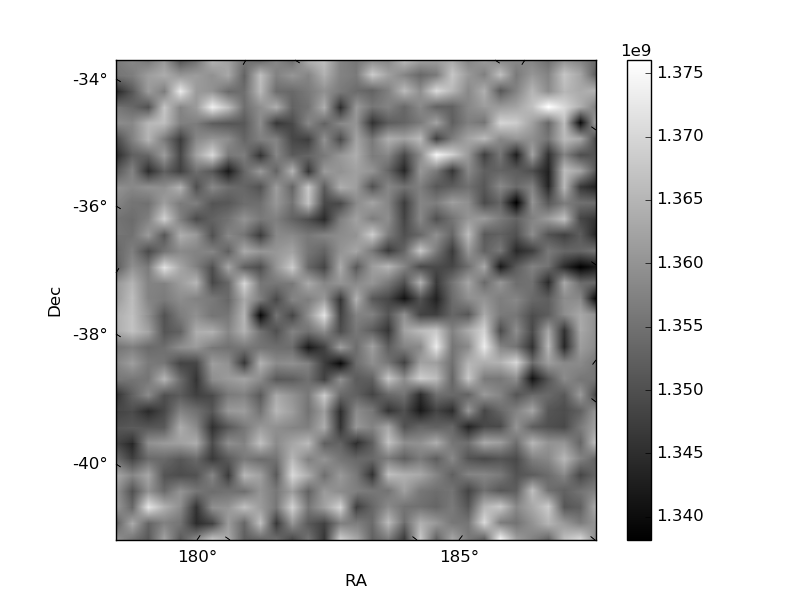
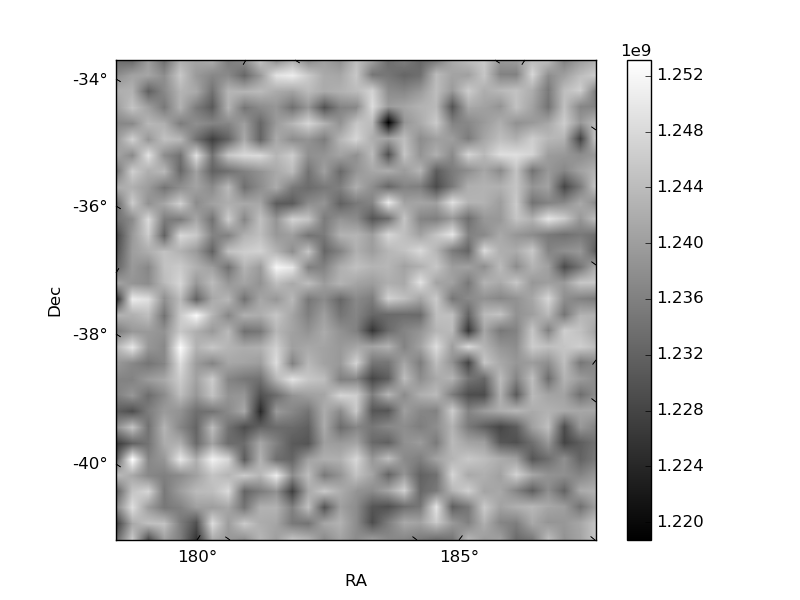
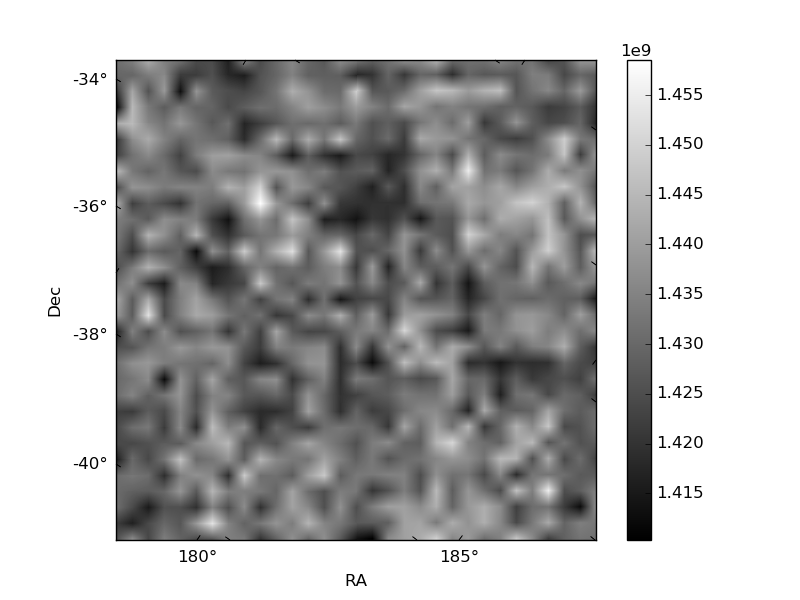
Histogram calculated using DETX and DETY for each event in the final _common_clean file
| Quadrant A | 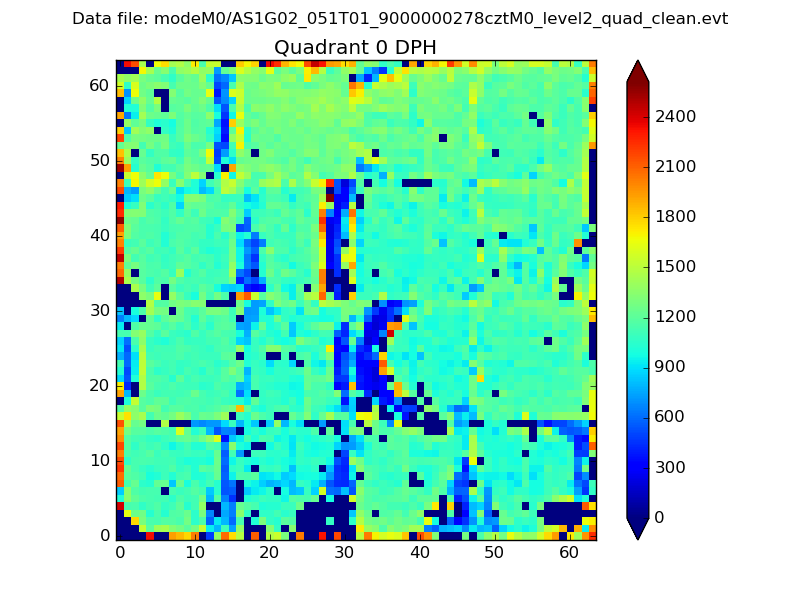 |
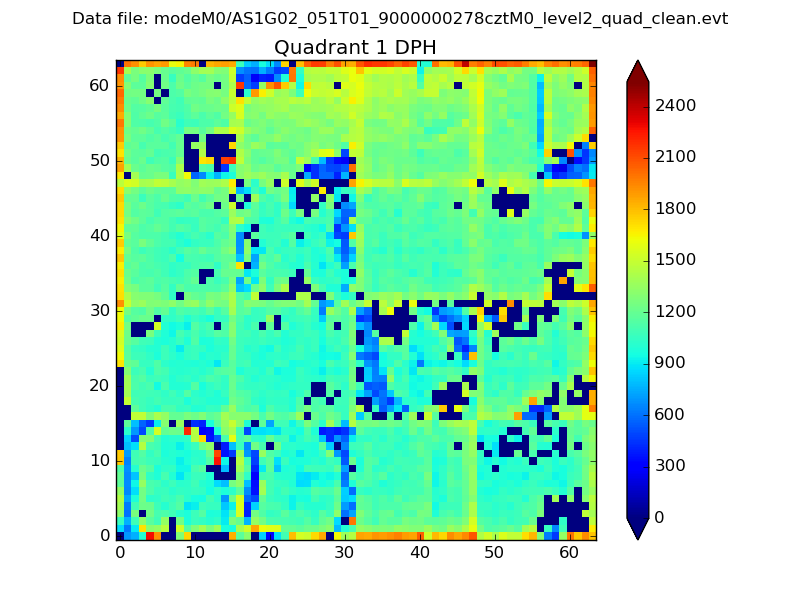 |
Quadrant B |
|---|---|---|---|
| Quadrant D | 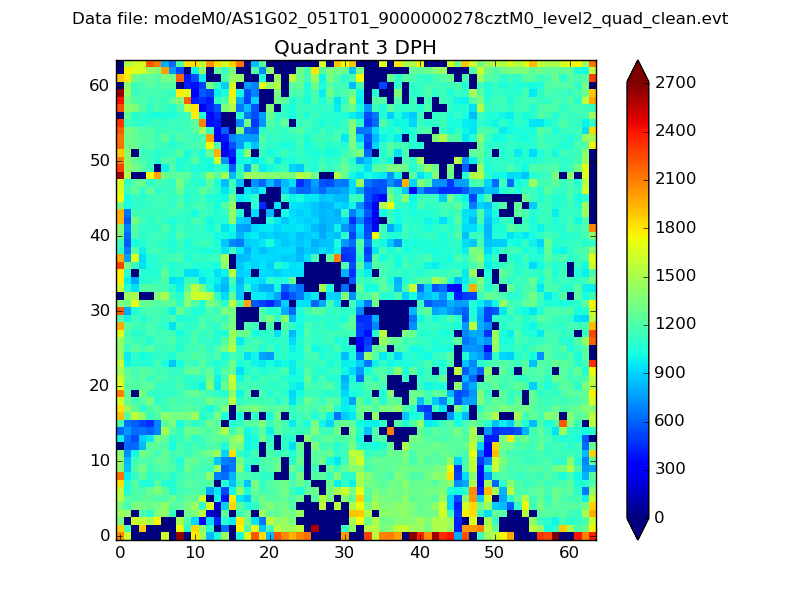 |
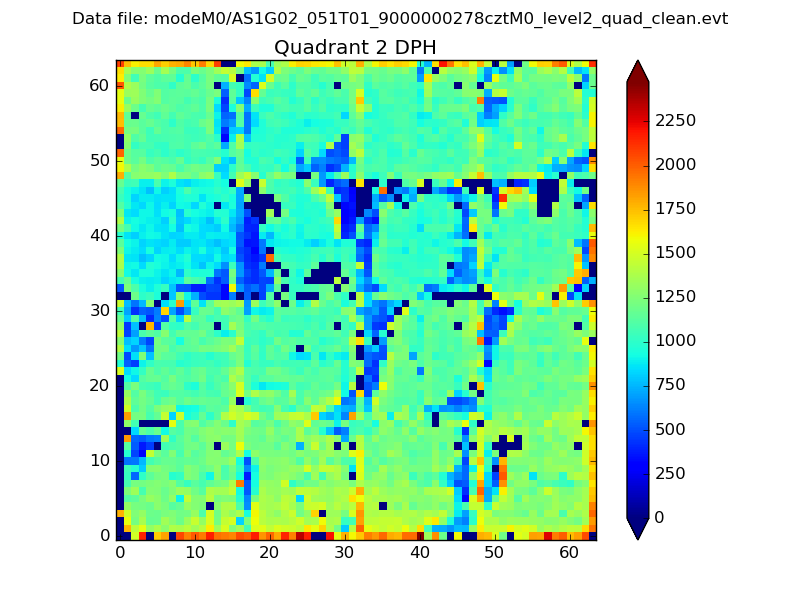 |
Quadrant C |
| Plot type | Count rate plots | Images |
|---|---|---|
| Comparison with Poisson distribution Blue bars denote a histogram of data divided into 1 sec bins. Red curve is a Poisson curve with rate = median count rate of data. |
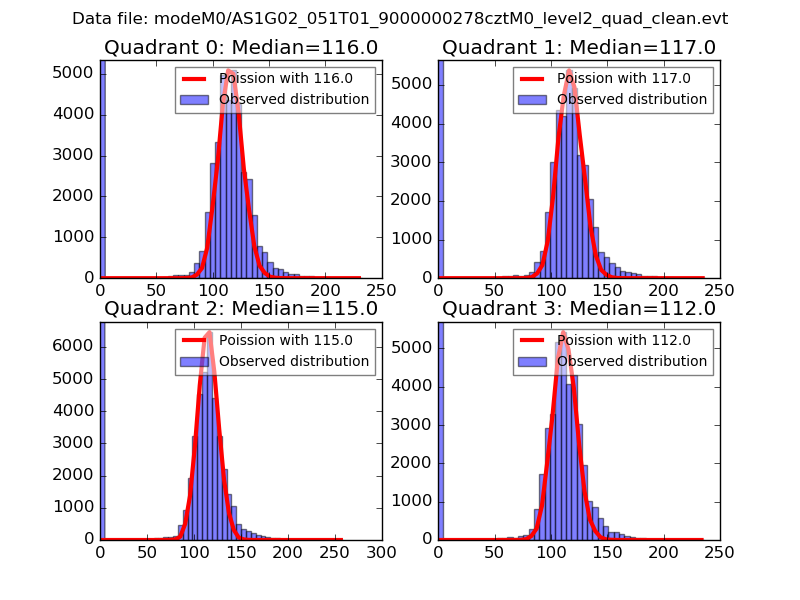 |
 |
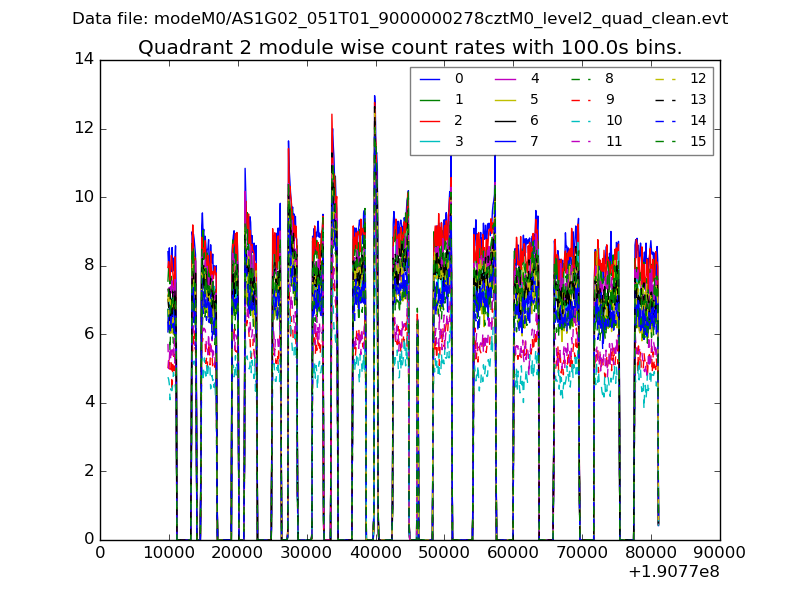
| Quadrant-wise count rates Data is divided into 100 sec bins |
 |
|
| Module-wise count rates for Quadrant A Data is divided into 100 sec bins |
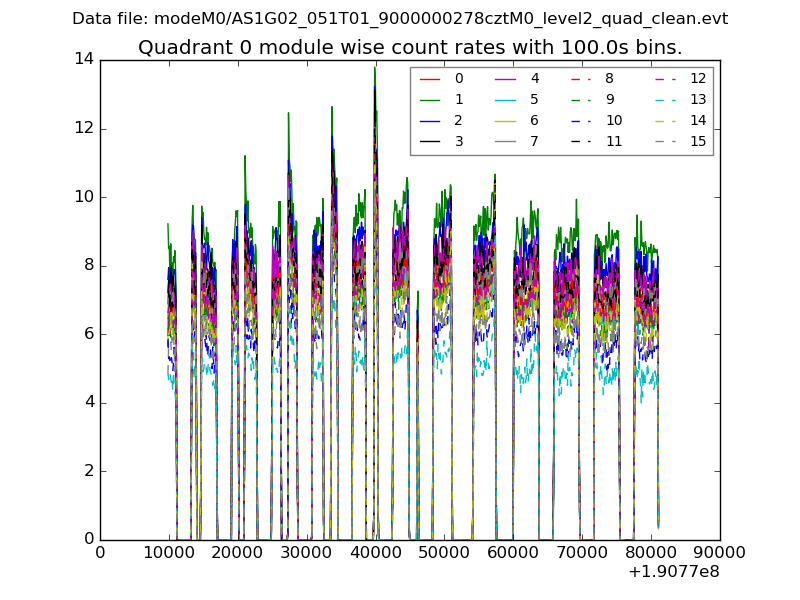 |
 |
| Module-wise count rates for Quadrant B Data is divided into 100 sec bins |
 |
 |
| Module-wise count rates for Quadrant C Data is divided into 100 sec bins |
 |
 |
| Module-wise count rates for Quadrant D Data is divided into 100 sec bins |
 |
 |
| Parameter | Plot |
|---|---|
| CZT HV Monitor |  |
| D_VDD | 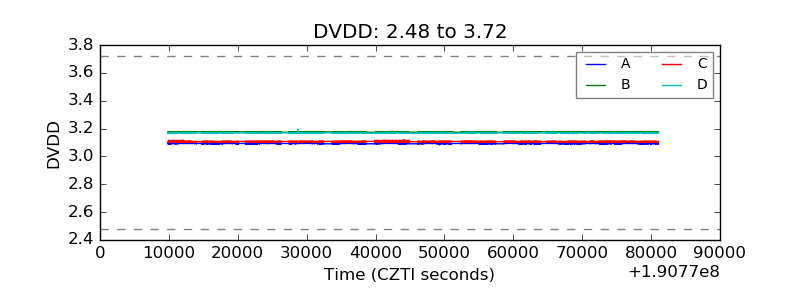 |
| Temperature 1 |  |
| Veto HV Monitor |  |
| Veto LLD | 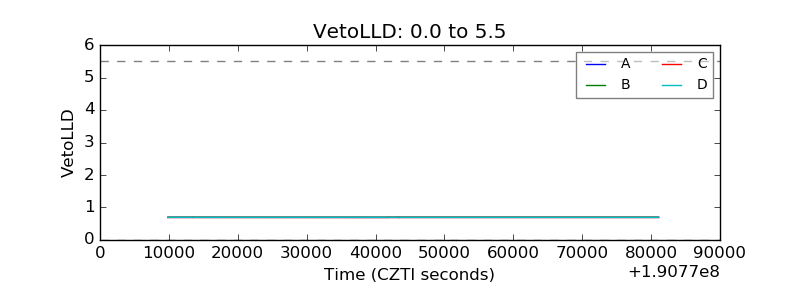 |
| Alpha Counter | 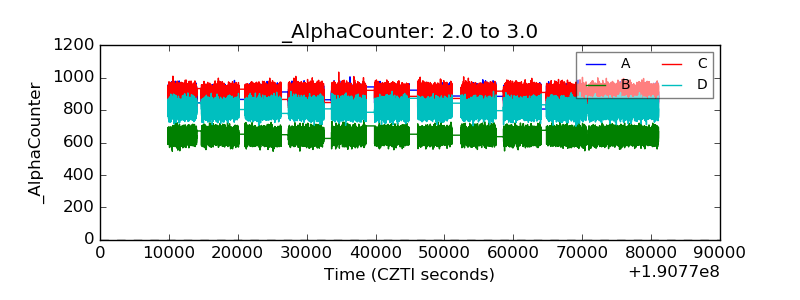 |
| _CPM_Rate |  |
| CZT Counter | 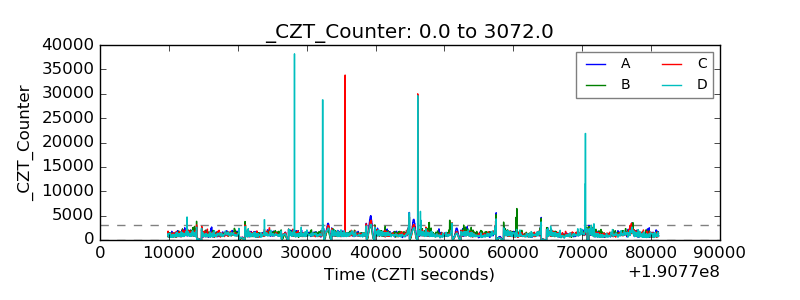 |
| +2.5 Volts monitor |  |
| +5 Volts monitor |  |
| _ROLL_ROT | 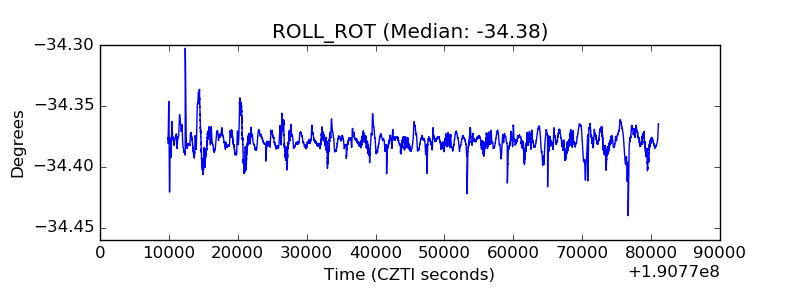 |
| _Roll_DEC | 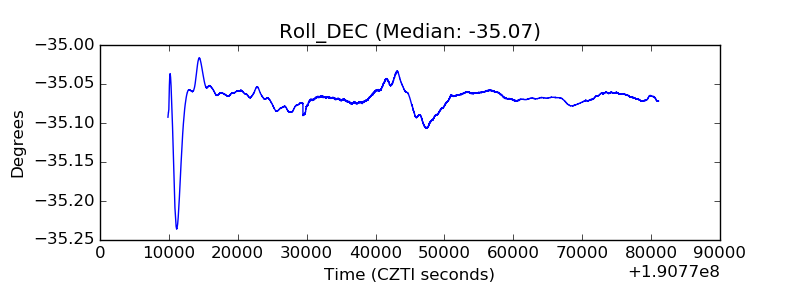 |
| _Roll_RA | 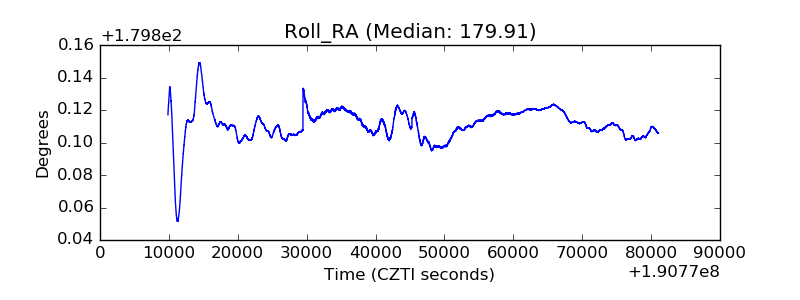 |
| Veto Counter |  |