| Param | Original file | Final file |
|---|---|---|
| Filename | modeM0/AS1G02_050T01_9000000282cztM0_level2.fits | modeM0/AS1G02_050T01_9000000282cztM0_level2_quad_clean.evt |
| Size (bytes) | 511,511,040 | 525,850,560 |
| Size | 487.8 MB | 501.5 MB |
| Events in quadrant A | 3,021,588 | 3,132,180 |
| Events in quadrant B | 2,957,682 | 3,120,705 |
| Events in quadrant C | 2,923,226 | 2,943,896 |
| Events in quadrant D | 2,538,684 | 2,679,704 |
| Mode SS | |||
|---|---|---|---|
| Quadrant | BADHDUFLAG | Total packets | Discarded packets |
| A | 0 | 1202 | 0 |
| B | 0 | 1202 | 0 |
| C | 0 | 1202 | 0 |
| D | 0 | 1202 | 0 |
| Mode M0 | |||
|---|---|---|---|
| Quadrant | BADHDUFLAG | Total packets | Discarded packets |
| A | 0 | 256262 | 0 |
| B | 0 | 276173 | 0 |
| C | 0 | 250838 | 0 |
| D | 0 | 249998 | 0 |
| Mode M9 | |||
|---|---|---|---|
| Quadrant | BADHDUFLAG | Total packets | Discarded packets |
| A | 0 | 85 | 0 |
| B | 0 | 85 | 0 |
| C | 0 | 85 | 0 |
| D | 0 | 85 | 0 |
| Quadrant | Total seconds | Saturated seconds | Saturation percentage |
|---|---|---|---|
| A | 59019 | 501 | 0.848879% |
| B | 59019 | 536 | 0.908182% |
| C | 59019 | 696 | 1.179281% |
| D | 59019 | 1475 | 2.499195% |
Noise dominated data is calculated using 1-second bins in cleaned event files. If a bin has >2000 counts, and if more than 50% of those come from <1% of pixels, then it is considered to be noise-dominated and hence unusable.
| Quadrant | # 1 sec bins | Bins with >0 counts | Bins with >2000 counts | High rate bins dominated by noise | Noise dominated (total time) | Noise dominated (detector-on time) | Marked lightcurve |
|---|---|---|---|---|---|---|---|
| A | 67594 | 59010 | 0 | 0 | 0.00% | 0.00% |  |
| B | 67594 | 59011 | 0 | 0 | 0.00% | 0.00% | 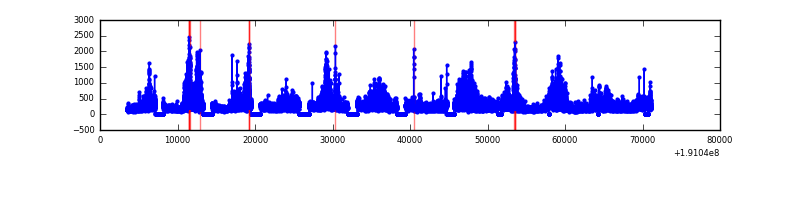 |
| C | 67594 | 59000 | 0 | 0 | 0.00% | 0.00% |  |
| D | 67593 | 58935 | 0 | 0 | 0.00% | 0.00% |  |
Top three noisy pixels from each quadrant. If the there are fewer than three noisy pixels in the level2.evt file, extra rows are filled as -1
| Pixel properties | Quadrant properties | ||||||
|---|---|---|---|---|---|---|---|
| Quadrant | DetID | PixID | Counts | Sigma | Mean | Median | Sigma |
| A | 0 | 29 | 2808 | 11.18 | 782 | 726 | 186.2 |
| A | 7 | 110 | 2689 | 10.54 | 782 | 726 | 186.2 |
| A | 9 | 19 | 2165 | 7.73 | 782 | 726 | 186.2 |
| B | 2 | 9 | 2312 | 10.94 | 780 | 738 | 143.8 |
| B | 5 | 128 | 1983 | 8.66 | 780 | 738 | 143.8 |
| B | 5 | 232 | 1874 | 7.9 | 780 | 738 | 143.8 |
| C | 12 | 241 | 2008 | 6.89 | 770 | 711 | 188.1 |
| C | 9 | 242 | 1883 | 6.23 | 770 | 711 | 188.1 |
| C | 3 | 235 | 1864 | 6.13 | 770 | 711 | 188.1 |
| D | 1 | 19 | 1917 | 7.2 | 724 | 660 | 174.6 |
| D | 6 | 231 | 1779 | 6.41 | 724 | 660 | 174.6 |
| D | 6 | 44 | 1752 | 6.25 | 724 | 660 | 174.6 |
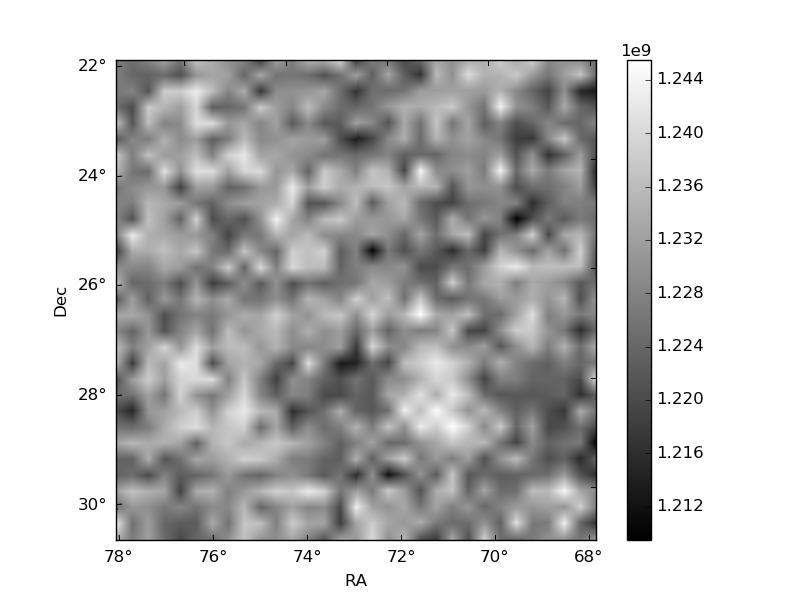
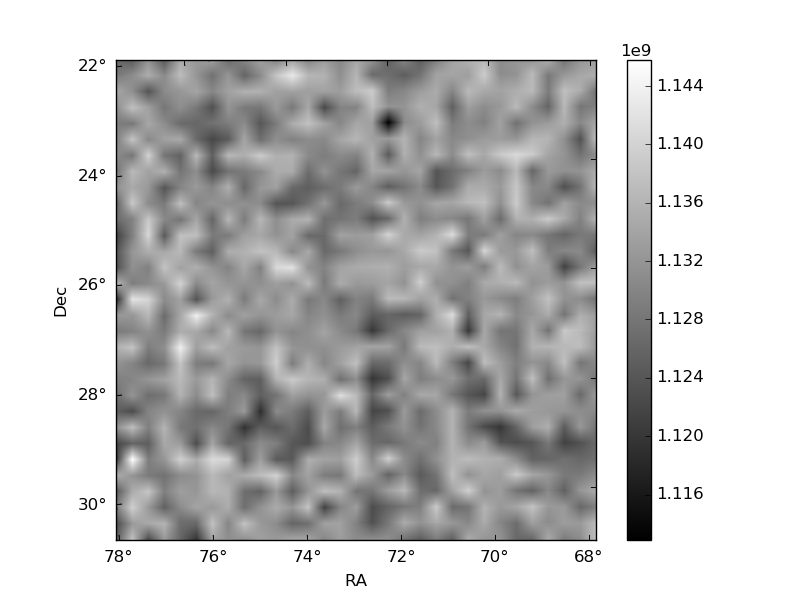
Histogram calculated using DETX and DETY for each event in the final _common_clean file
| Quadrant A | 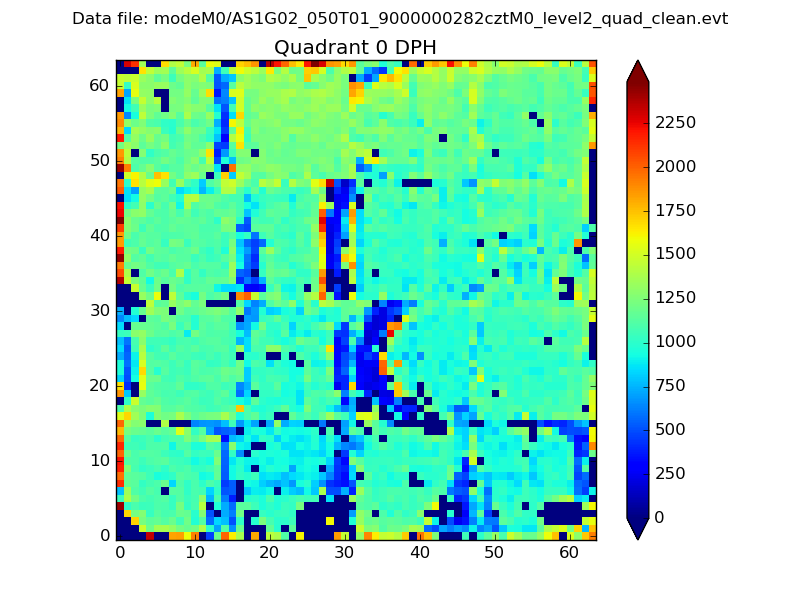 |
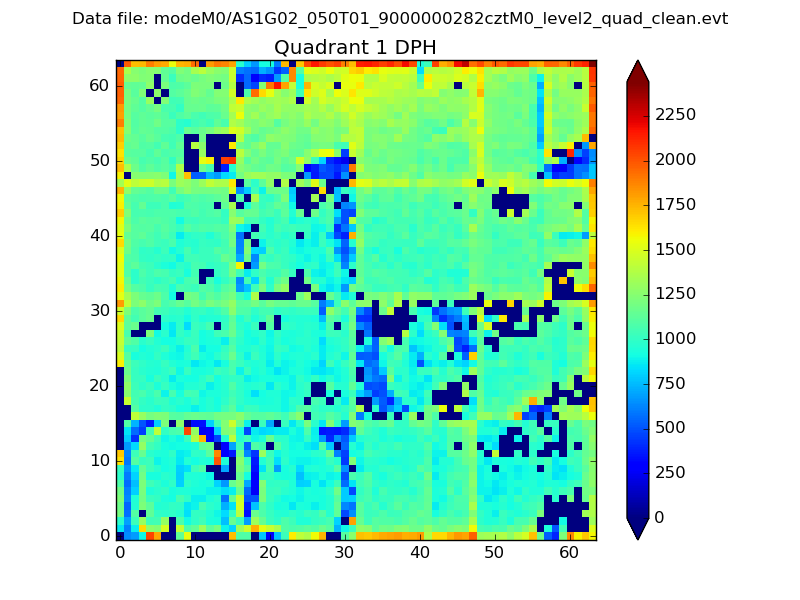 |
Quadrant B |
|---|---|---|---|
| Quadrant D | 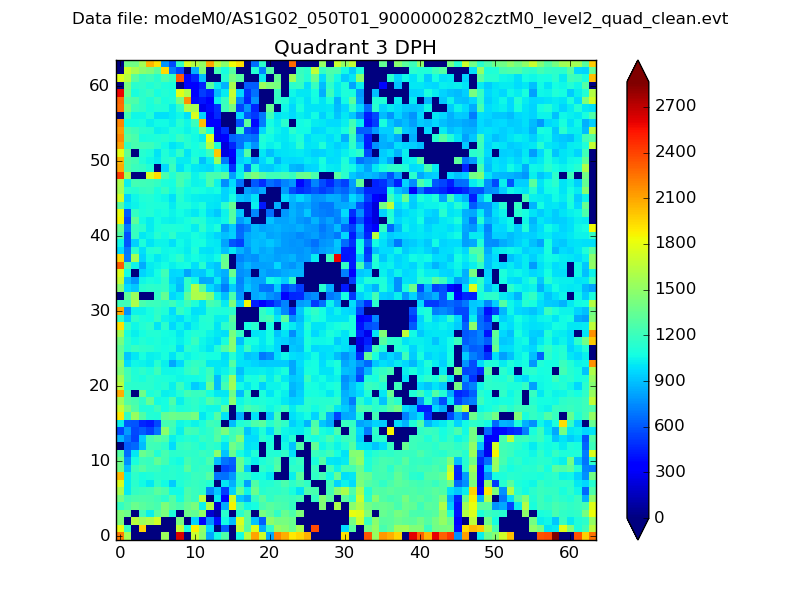 |
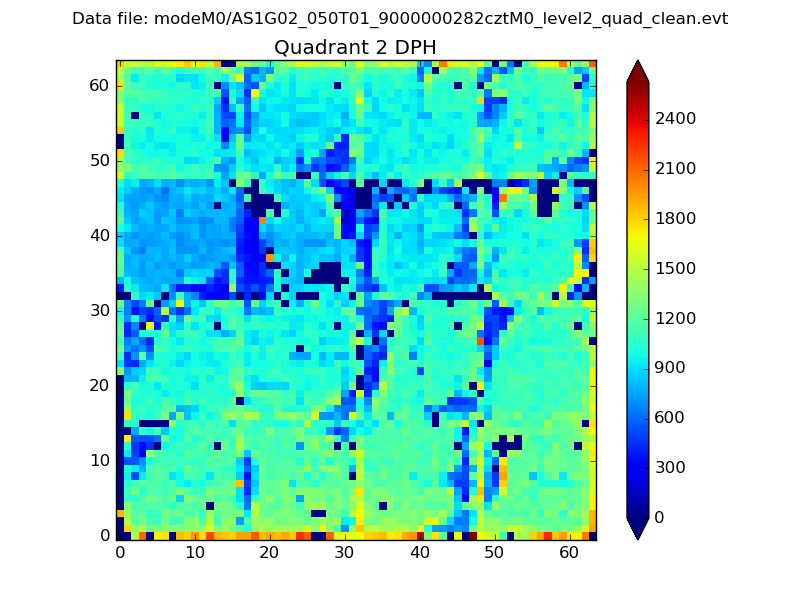 |
Quadrant C |
| Plot type | Count rate plots | Images |
|---|---|---|
| Comparison with Poisson distribution Blue bars denote a histogram of data divided into 1 sec bins. Red curve is a Poisson curve with rate = median count rate of data. |
 |
 |
| Quadrant-wise count rates Data is divided into 100 sec bins |
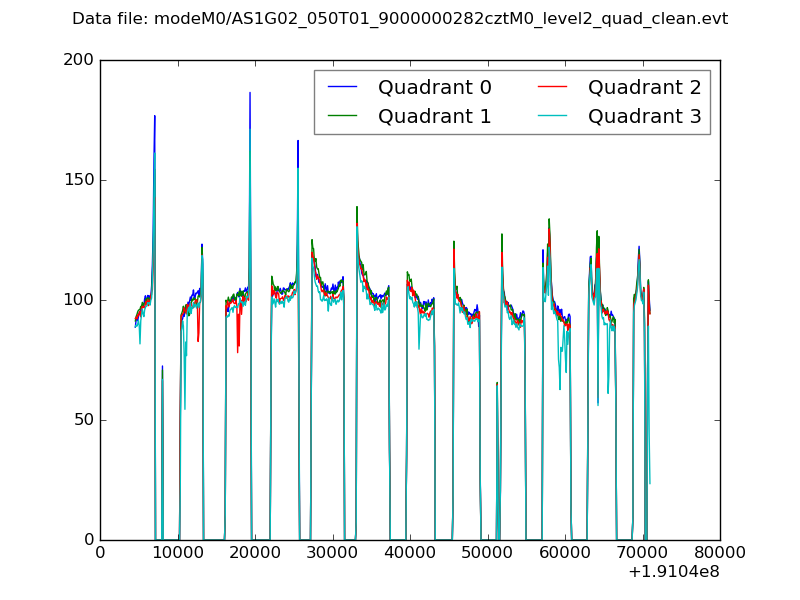 |
|
| Module-wise count rates for Quadrant A Data is divided into 100 sec bins |
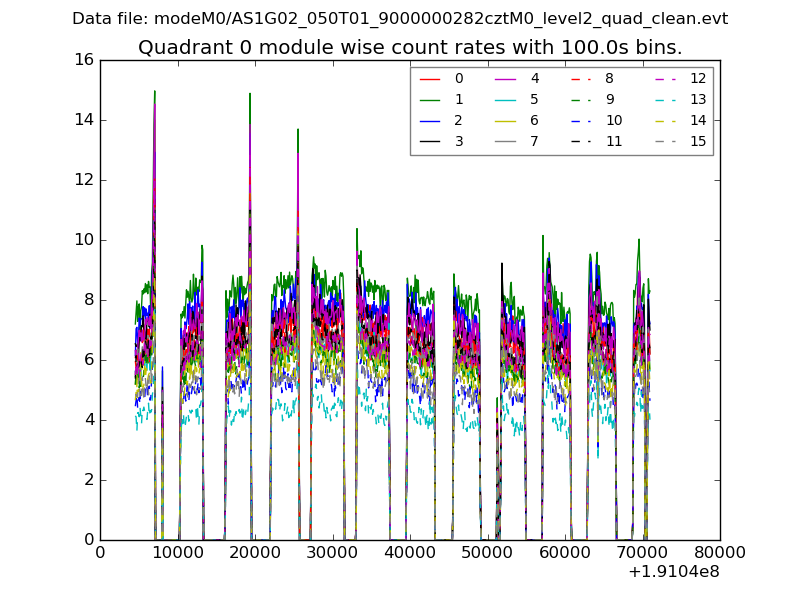 |
 |
| Module-wise count rates for Quadrant B Data is divided into 100 sec bins |
 |
 |
| Module-wise count rates for Quadrant C Data is divided into 100 sec bins |
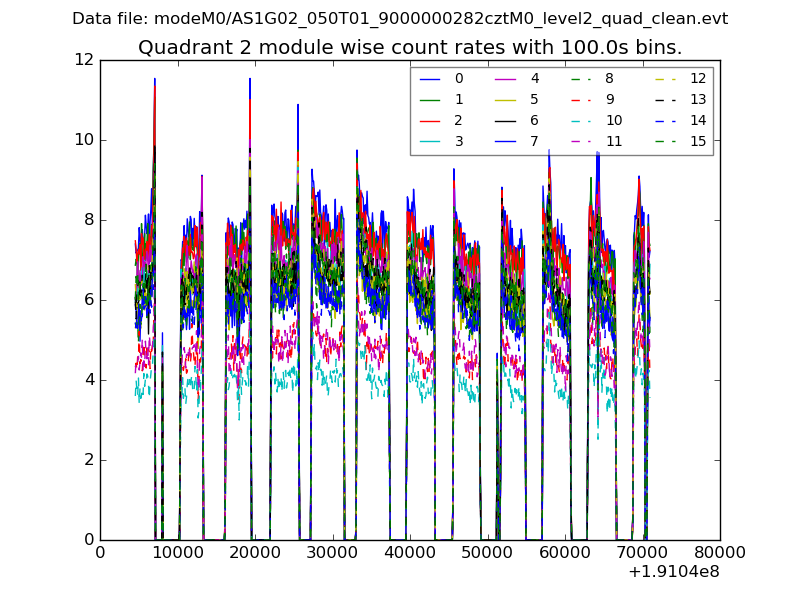 |
 |
| Module-wise count rates for Quadrant D Data is divided into 100 sec bins |
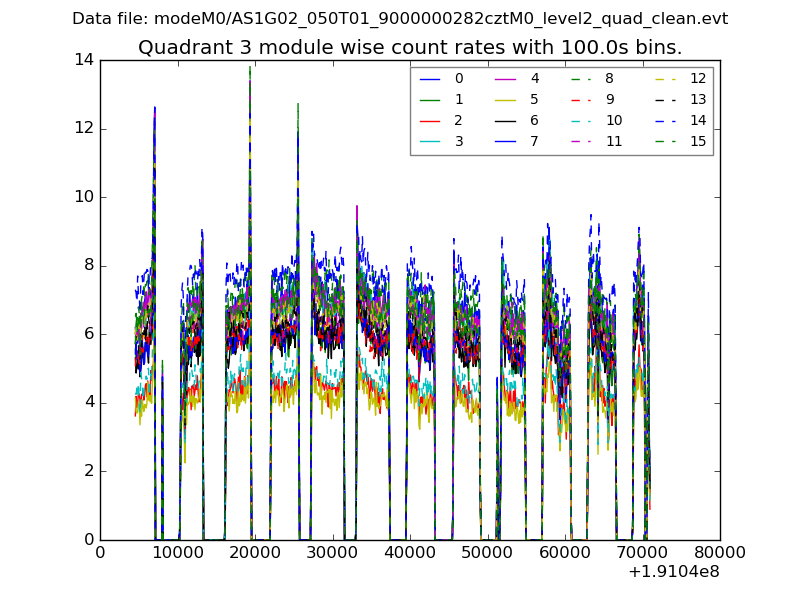 |
 |
| Parameter | Plot |
|---|---|
| CZT HV Monitor |  |
| D_VDD |  |
| Temperature 1 |  |
| Veto HV Monitor |  |
| Veto LLD |  |
| Alpha Counter | 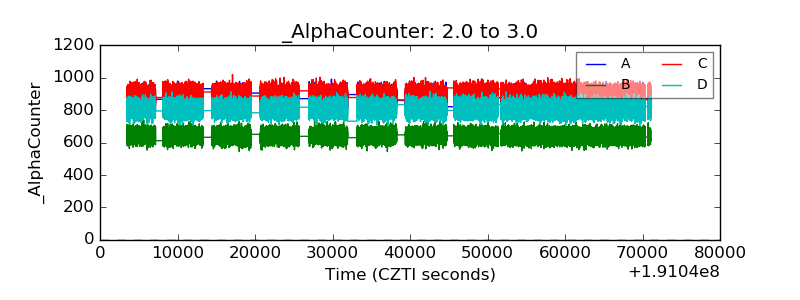 |
| _CPM_Rate |  |
| CZT Counter |  |
| +2.5 Volts monitor |  |
| +5 Volts monitor |  |
| _ROLL_ROT |  |
| _Roll_DEC |  |
| _Roll_RA |  |
| Veto Counter |  |