| Param | Original file | Final file |
|---|---|---|
| Filename | modeM0/AS1T01_034T01_9000000290cztM0_level2.fits | modeM0/AS1T01_034T01_9000000290cztM0_level2_quad_clean.evt |
| Size (bytes) | 583,574,400 | 871,041,600 |
| Size | 556.5 MB | 830.7 MB |
| Events in quadrant A | 3,364,952 | 5,631,813 |
| Events in quadrant B | 3,349,898 | 5,683,496 |
| Events in quadrant C | 3,303,182 | 5,350,669 |
| Events in quadrant D | 2,844,348 | 4,907,029 |
| Mode M9 | |||
|---|---|---|---|
| Quadrant | BADHDUFLAG | Total packets | Discarded packets |
| A | 1 | 139850770659368 | 139848430125102 |
| B | 1 | 139850770659368 | 139848430125102 |
| C | 1 | 139850770659368 | 139848430125102 |
| D | 1 | 139850770659368 | 139848430125102 |
| Mode SS | |||
|---|---|---|---|
| Quadrant | BADHDUFLAG | Total packets | Discarded packets |
| A | 0 | 1404 | 0 |
| B | 0 | 1404 | 0 |
| C | 0 | 1404 | 0 |
| D | 0 | 1404 | 0 |
| Mode M0 | |||
|---|---|---|---|
| Quadrant | BADHDUFLAG | Total packets | Discarded packets |
| A | 0 | 312195 | 0 |
| B | 0 | 308463 | 0 |
| C | 0 | 294591 | 0 |
| D | 0 | 324373 | 0 |
| Quadrant | Total seconds | Saturated seconds | Saturation percentage |
|---|---|---|---|
| A | 70167 | 341 | 0.485983% |
| B | 70155 | 255 | 0.363481% |
| C | 70150 | 292 | 0.416251% |
| D | 70143 | 1360 | 1.938896% |
Noise dominated data is calculated using 1-second bins in cleaned event files. If a bin has >2000 counts, and if more than 50% of those come from <1% of pixels, then it is considered to be noise-dominated and hence unusable.
| Quadrant | # 1 sec bins | Bins with >0 counts | Bins with >2000 counts | High rate bins dominated by noise | Noise dominated (total time) | Noise dominated (detector-on time) | Marked lightcurve |
|---|---|---|---|---|---|---|---|
| A | 80457 | 70180 | 0 | 0 | 0.00% | 0.00% | 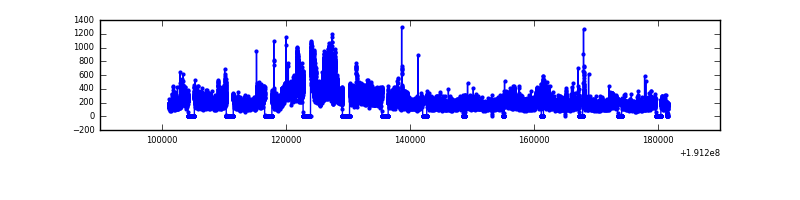 |
| B | 80457 | 70169 | 0 | 0 | 0.00% | 0.00% |  |
| C | 80457 | 70168 | 0 | 0 | 0.00% | 0.00% | 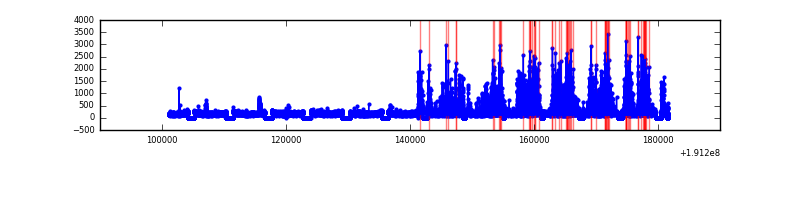 |
| D | 80457 | 70145 | 0 | 0 | 0.00% | 0.00% |  |
Top three noisy pixels from each quadrant. If the there are fewer than three noisy pixels in the level2.evt file, extra rows are filled as -1
| Pixel properties | Quadrant properties | ||||||
|---|---|---|---|---|---|---|---|
| Quadrant | DetID | PixID | Counts | Sigma | Mean | Median | Sigma |
| A | 14 | 188 | 3107 | 11.47 | 871 | 816 | 199.7 |
| A | 0 | 29 | 3010 | 10.99 | 871 | 816 | 199.7 |
| A | 7 | 110 | 2958 | 10.73 | 871 | 816 | 199.7 |
| B | 2 | 9 | 2764 | 12.13 | 885 | 843 | 158.3 |
| B | 5 | 128 | 2230 | 8.76 | 885 | 843 | 158.3 |
| B | 14 | 254 | 2171 | 8.39 | 885 | 843 | 158.3 |
| C | 12 | 241 | 2292 | 7.07 | 871 | 808 | 209.9 |
| C | 2 | 127 | 2248 | 6.86 | 871 | 808 | 209.9 |
| C | 1 | 81 | 2176 | 6.52 | 871 | 808 | 209.9 |
| D | 1 | 19 | 2091 | 7.11 | 811 | 744 | 189.4 |
| D | 6 | 231 | 2078 | 7.04 | 811 | 744 | 189.4 |
| D | 6 | 44 | 2059 | 6.94 | 811 | 744 | 189.4 |
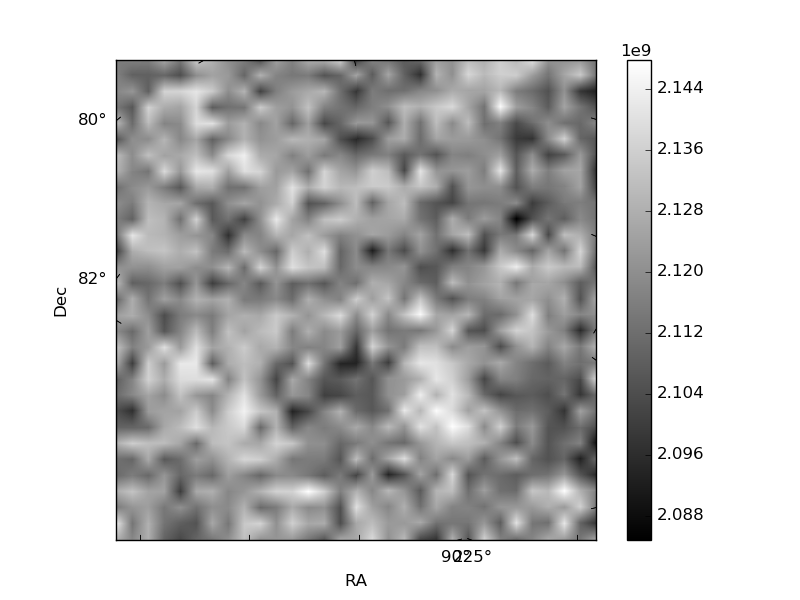
Histogram calculated using DETX and DETY for each event in the final _common_clean file
| Quadrant A |  |
 |
Quadrant B |
|---|---|---|---|
| Quadrant D | 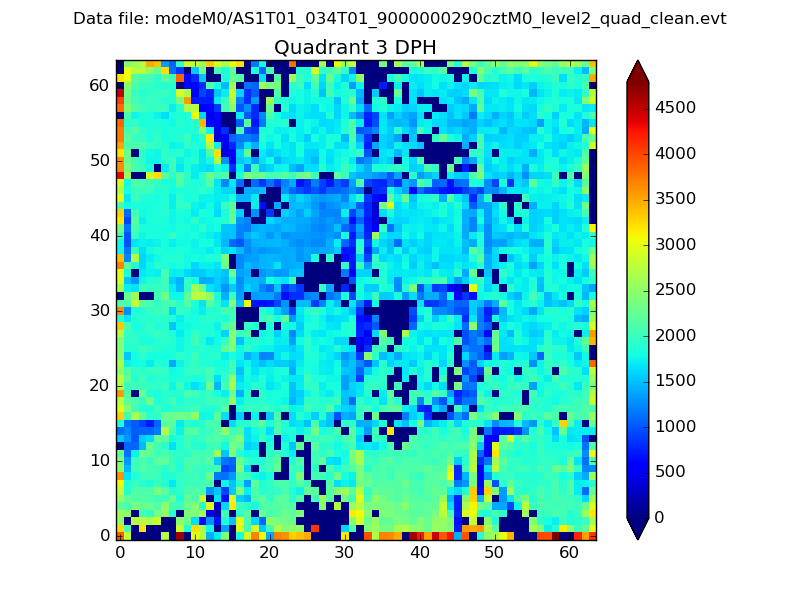 |
 |
Quadrant C |
| Plot type | Count rate plots | Images |
|---|---|---|
| Comparison with Poisson distribution Blue bars denote a histogram of data divided into 1 sec bins. Red curve is a Poisson curve with rate = median count rate of data. |
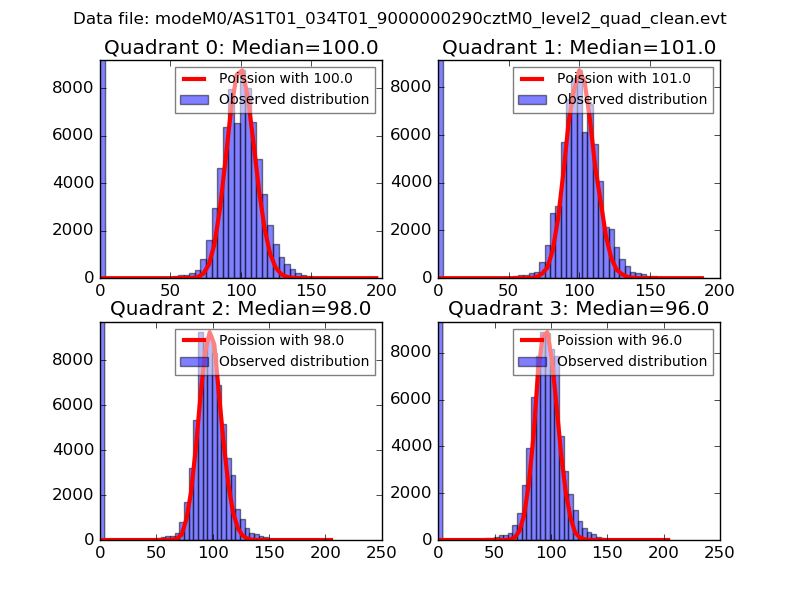 |
 |
| Quadrant-wise count rates Data is divided into 100 sec bins |
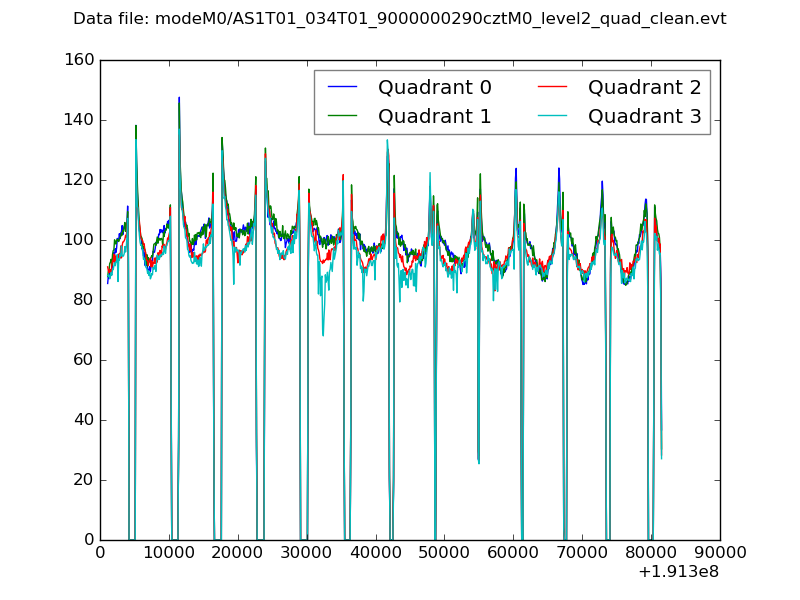 |
|
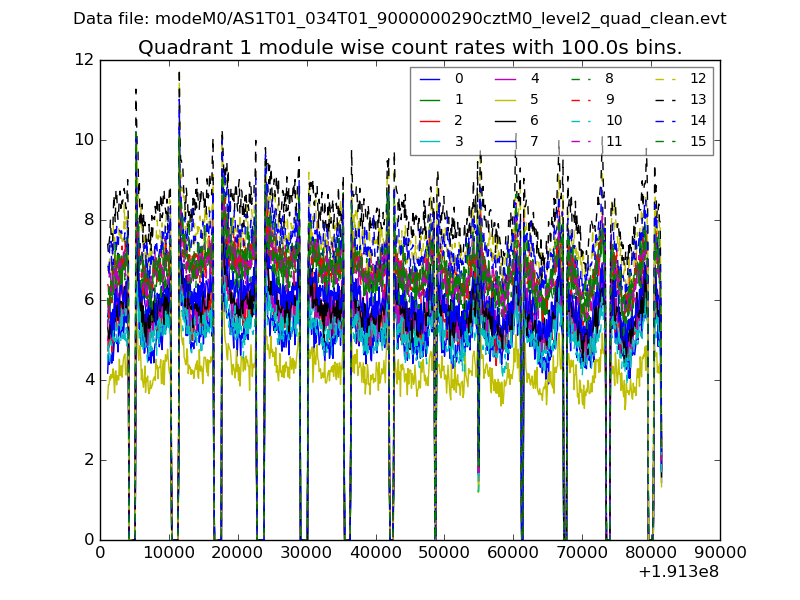
| Module-wise count rates for Quadrant A Data is divided into 100 sec bins |
 |
 |
| Module-wise count rates for Quadrant B Data is divided into 100 sec bins |
 |
 |
| Module-wise count rates for Quadrant C Data is divided into 100 sec bins |
 |
 |
| Module-wise count rates for Quadrant D Data is divided into 100 sec bins |
 |
 |
| Parameter | Plot |
|---|---|
| CZT HV Monitor |  |
| D_VDD |  |
| Temperature 1 |  |
| Veto HV Monitor |  |
| Veto LLD |  |
| Alpha Counter |  |
| _CPM_Rate | 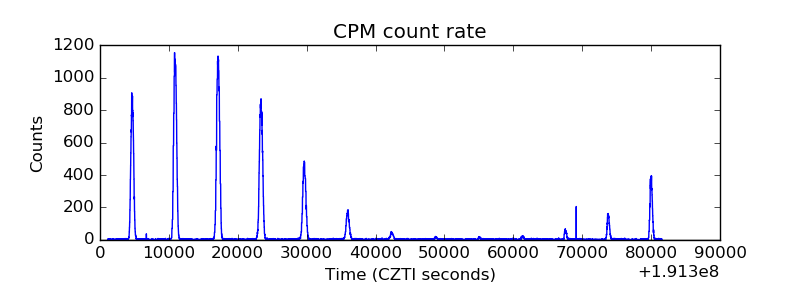 |
| CZT Counter |  |
| +2.5 Volts monitor |  |
| +5 Volts monitor | 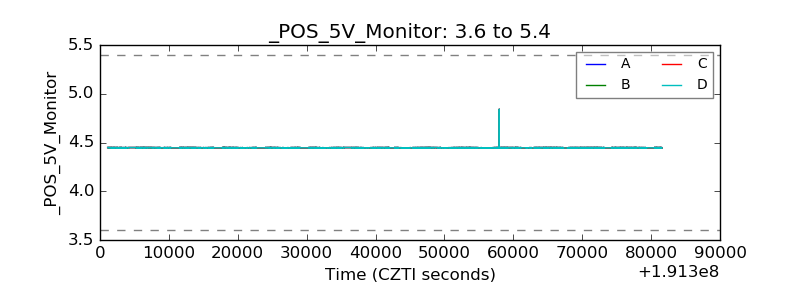 |
| _ROLL_ROT | 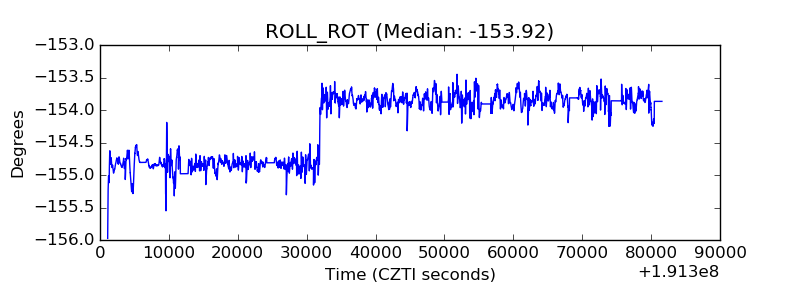 |
| _Roll_DEC |  |
| _Roll_RA |  |
| Veto Counter |  |