| Param | Original file | Final file |
|---|---|---|
| Filename | modeM0/AS1T01_051T01_9000000292cztM0_level2.fits | modeM0/AS1T01_051T01_9000000292cztM0_level2_quad_clean.evt |
| Size (bytes) | 580,714,560 | 846,529,920 |
| Size | 553.8 MB | 807.3 MB |
| Events in quadrant A | 3,379,934 | 5,482,751 |
| Events in quadrant B | 3,332,786 | 5,510,577 |
| Events in quadrant C | 3,284,858 | 5,185,351 |
| Events in quadrant D | 2,805,544 | 4,679,353 |
| Mode M9 | |||
|---|---|---|---|
| Quadrant | BADHDUFLAG | Total packets | Discarded packets |
| A | 1 | 139704983316520 | 139702401237038 |
| B | 1 | 139704983316520 | 139702401237038 |
| C | 1 | 139704983316520 | 139702401237038 |
| D | 1 | 139704983316520 | 139702401237038 |
| Mode M0 | |||
|---|---|---|---|
| Quadrant | BADHDUFLAG | Total packets | Discarded packets |
| A | 0 | 297312 | 0 |
| B | 0 | 304843 | 0 |
| C | 0 | 291701 | 0 |
| D | 0 | 317608 | 0 |
| Mode SS | |||
|---|---|---|---|
| Quadrant | BADHDUFLAG | Total packets | Discarded packets |
| A | 0 | 1398 | 0 |
| B | 0 | 1398 | 0 |
| C | 0 | 1398 | 0 |
| D | 0 | 1398 | 0 |
| Quadrant | Total seconds | Saturated seconds | Saturation percentage |
|---|---|---|---|
| A | 69759 | 155 | 0.222194% |
| B | 69753 | 153 | 0.219345% |
| C | 69755 | 206 | 0.295319% |
| D | 69759 | 2228 | 3.193853% |
Noise dominated data is calculated using 1-second bins in cleaned event files. If a bin has >2000 counts, and if more than 50% of those come from <1% of pixels, then it is considered to be noise-dominated and hence unusable.
| Quadrant | # 1 sec bins | Bins with >0 counts | Bins with >2000 counts | High rate bins dominated by noise | Noise dominated (total time) | Noise dominated (detector-on time) | Marked lightcurve |
|---|---|---|---|---|---|---|---|
| A | 80176 | 69760 | 0 | 0 | 0.00% | 0.00% |  |
| B | 80176 | 69756 | 0 | 0 | 0.00% | 0.00% |  |
| C | 80176 | 69757 | 0 | 0 | 0.00% | 0.00% |  |
| D | 80176 | 69730 | 0 | 0 | 0.00% | 0.00% |  |
Top three noisy pixels from each quadrant. If the there are fewer than three noisy pixels in the level2.evt file, extra rows are filled as -1
| Pixel properties | Quadrant properties | ||||||
|---|---|---|---|---|---|---|---|
| Quadrant | DetID | PixID | Counts | Sigma | Mean | Median | Sigma |
| A | 0 | 29 | 3092 | 11.25 | 874 | 818 | 202.2 |
| A | 7 | 110 | 2955 | 10.57 | 874 | 818 | 202.2 |
| A | 9 | 19 | 2434 | 7.99 | 874 | 818 | 202.2 |
| B | 2 | 9 | 2724 | 11.88 | 881 | 838 | 158.7 |
| B | 5 | 128 | 2228 | 8.76 | 881 | 838 | 158.7 |
| B | 14 | 254 | 2184 | 8.48 | 881 | 838 | 158.7 |
| C | 12 | 241 | 2363 | 7.43 | 866 | 801 | 210.2 |
| C | 3 | 235 | 2168 | 6.5 | 866 | 801 | 210.2 |
| C | 2 | 191 | 2155 | 6.44 | 866 | 801 | 210.2 |
| D | 1 | 19 | 2052 | 7.01 | 800 | 733 | 188.2 |
| D | 6 | 44 | 2026 | 6.87 | 800 | 733 | 188.2 |
| D | 3 | 30 | 2011 | 6.79 | 800 | 733 | 188.2 |
Histogram calculated using DETX and DETY for each event in the final _common_clean file
| Quadrant A |  |
 |
Quadrant B |
|---|---|---|---|
| Quadrant D | 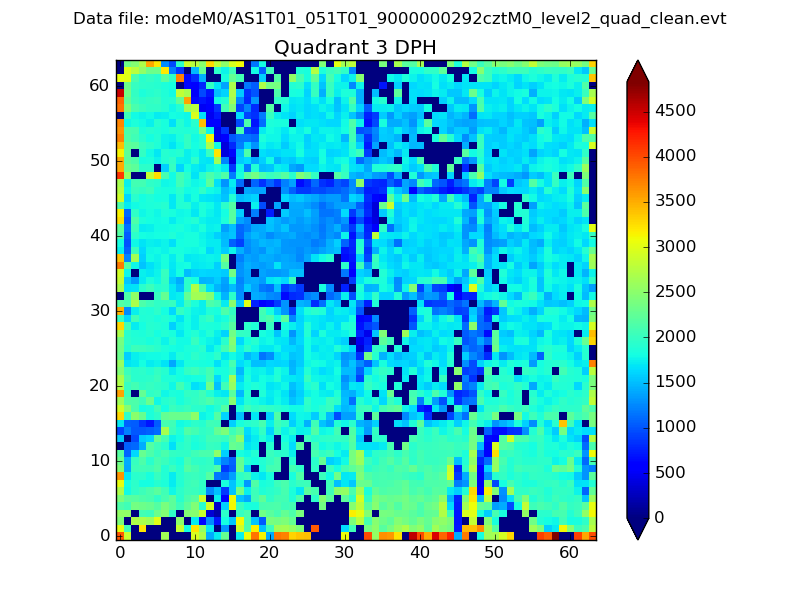 |
 |
Quadrant C |
| Plot type | Count rate plots | Images |
|---|---|---|
| Comparison with Poisson distribution Blue bars denote a histogram of data divided into 1 sec bins. Red curve is a Poisson curve with rate = median count rate of data. |
 |
 |
| Quadrant-wise count rates Data is divided into 100 sec bins |
 |
|
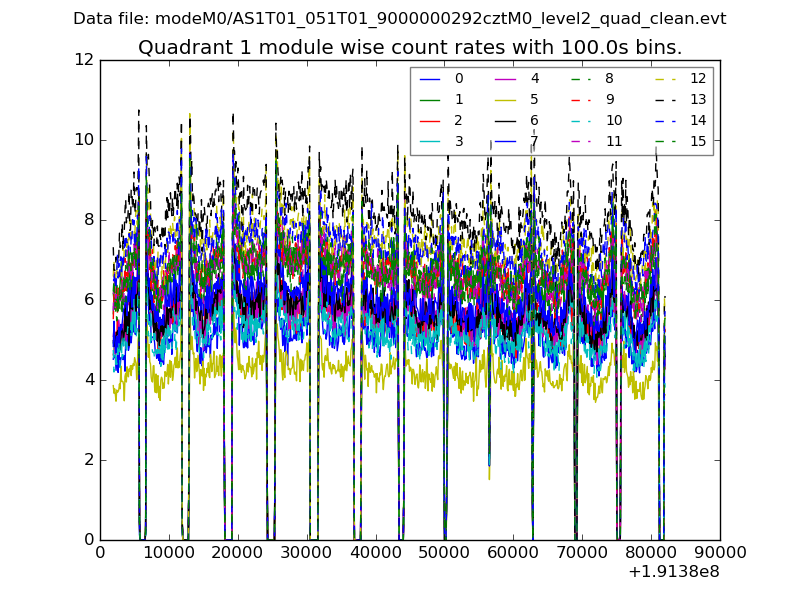
| Module-wise count rates for Quadrant A Data is divided into 100 sec bins |
 |
 |
| Module-wise count rates for Quadrant B Data is divided into 100 sec bins |
 |
 |
| Module-wise count rates for Quadrant C Data is divided into 100 sec bins |
 |
 |
| Module-wise count rates for Quadrant D Data is divided into 100 sec bins |
 |
 |
| Parameter | Plot |
|---|---|
| CZT HV Monitor |  |
| D_VDD |  |
| Temperature 1 |  |
| Veto HV Monitor |  |
| Veto LLD | 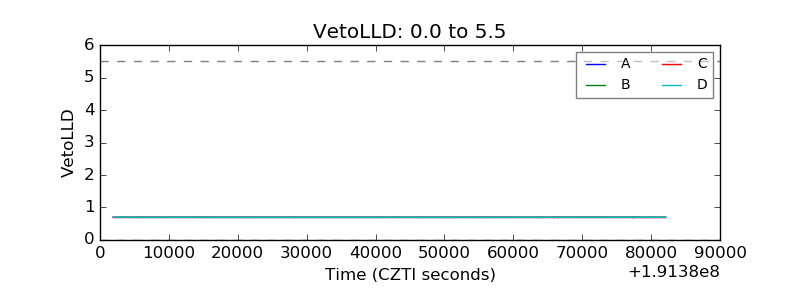 |
| Alpha Counter | 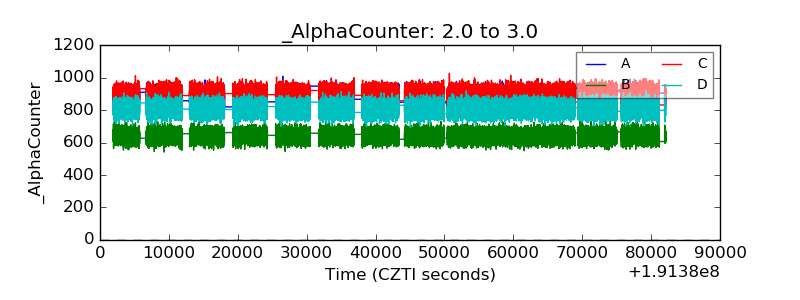 |
| _CPM_Rate |  |
| CZT Counter |  |
| +2.5 Volts monitor |  |
| +5 Volts monitor | 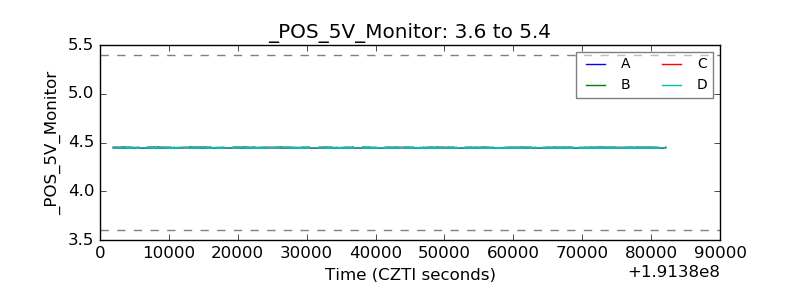 |
| _ROLL_ROT |  |
| _Roll_DEC |  |
| _Roll_RA |  |
| Veto Counter |  |