| Param | Original file | Final file |
|---|---|---|
| Filename | modeM0/AS1G02_020T01_9000000296cztM0_level2.fits | modeM0/AS1G02_020T01_9000000296cztM0_level2_quad_clean.evt |
| Size (bytes) | 887,207,040 | 1,111,256,640 |
| Size | 846.1 MB | 1.0 GB |
| Events in quadrant A | 5,170,138 | 6,929,268 |
| Events in quadrant B | 5,100,394 | 6,961,556 |
| Events in quadrant C | 5,049,030 | 6,555,862 |
| Events in quadrant D | 4,360,494 | 6,023,613 |
| Mode M9 | |||
|---|---|---|---|
| Quadrant | BADHDUFLAG | Total packets | Discarded packets |
| A | 1 | 139775209433128 | 139771120713774 |
| B | 1 | 139775209433128 | 139771120713774 |
| C | 1 | 139775209433128 | 139771120713774 |
| D | 1 | 139775209433128 | 139771120713774 |
| Mode SS | |||
|---|---|---|---|
| Quadrant | BADHDUFLAG | Total packets | Discarded packets |
| A | 0 | 2096 | 0 |
| B | 0 | 2096 | 0 |
| C | 0 | 2096 | 0 |
| D | 0 | 2096 | 0 |
| Mode M0 | |||
|---|---|---|---|
| Quadrant | BADHDUFLAG | Total packets | Discarded packets |
| A | 0 | 463207 | 0 |
| B | 0 | 462472 | 0 |
| C | 0 | 445819 | 0 |
| D | 0 | 455383 | 0 |
| Quadrant | Total seconds | Saturated seconds | Saturation percentage |
|---|---|---|---|
| A | 104888 | 639 | 0.609221% |
| B | 104894 | 551 | 0.525292% |
| C | 104894 | 525 | 0.500505% |
| D | 104894 | 1932 | 1.841859% |
Noise dominated data is calculated using 1-second bins in cleaned event files. If a bin has >2000 counts, and if more than 50% of those come from <1% of pixels, then it is considered to be noise-dominated and hence unusable.
| Quadrant | # 1 sec bins | Bins with >0 counts | Bins with >2000 counts | High rate bins dominated by noise | Noise dominated (total time) | Noise dominated (detector-on time) | Marked lightcurve |
|---|---|---|---|---|---|---|---|
| A | 121326 | 104891 | 0 | 0 | 0.00% | 0.00% |  |
| B | 121326 | 104892 | 0 | 0 | 0.00% | 0.00% |  |
| C | 121326 | 104898 | 0 | 0 | 0.00% | 0.00% |  |
| D | 121326 | 104867 | 0 | 0 | 0.00% | 0.00% |  |
Top three noisy pixels from each quadrant. If the there are fewer than three noisy pixels in the level2.evt file, extra rows are filled as -1
| Pixel properties | Quadrant properties | ||||||
|---|---|---|---|---|---|---|---|
| Quadrant | DetID | PixID | Counts | Sigma | Mean | Median | Sigma |
| A | 0 | 29 | 4804 | 11.42 | 1338 | 1247 | 311.5 |
| A | 7 | 110 | 4472 | 10.35 | 1338 | 1247 | 311.5 |
| A | 14 | 79 | 3748 | 8.03 | 1338 | 1247 | 311.5 |
| B | 2 | 9 | 4096 | 11.8 | 1348 | 1281 | 238.6 |
| B | 10 | 225 | 3209 | 8.08 | 1348 | 1281 | 238.6 |
| B | 14 | 254 | 3176 | 7.94 | 1348 | 1281 | 238.6 |
| C | 12 | 241 | 3432 | 6.89 | 1331 | 1229 | 319.7 |
| C | 2 | 191 | 3355 | 6.65 | 1331 | 1229 | 319.7 |
| C | 1 | 81 | 3295 | 6.46 | 1331 | 1229 | 319.7 |
| D | 1 | 19 | 3213 | 7.18 | 1244 | 1139 | 289.0 |
| D | 6 | 231 | 3177 | 7.05 | 1244 | 1139 | 289.0 |
| D | 11 | 82 | 3104 | 6.8 | 1244 | 1139 | 289.0 |
Histogram calculated using DETX and DETY for each event in the final _common_clean file
| Quadrant A | 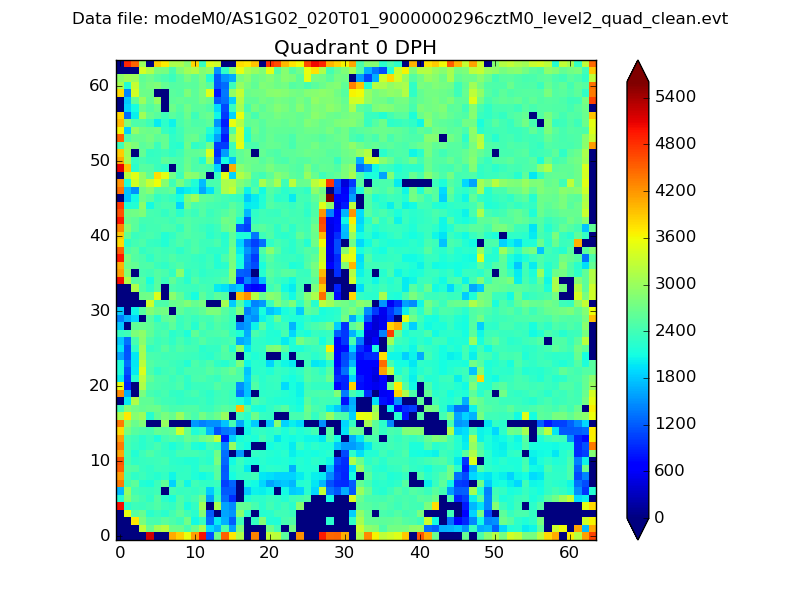 |
 |
Quadrant B |
|---|---|---|---|
| Quadrant D |  |
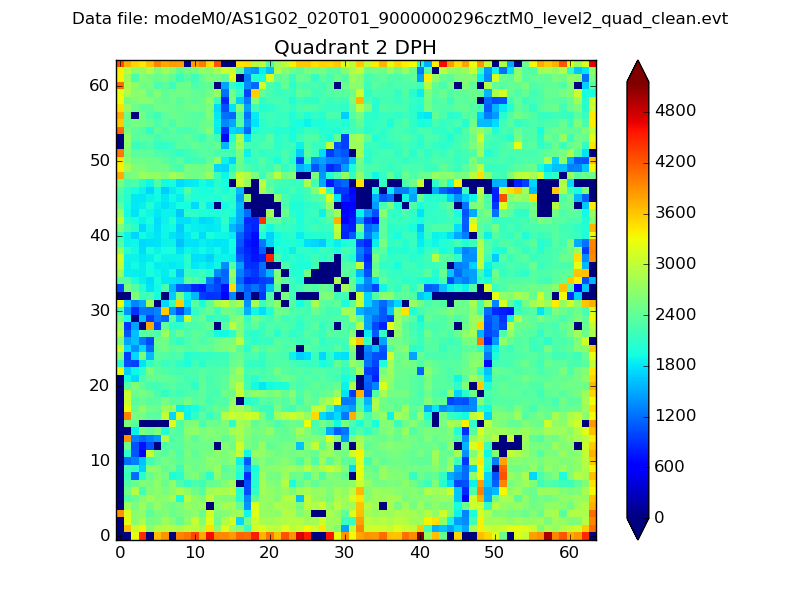 |
Quadrant C |
| Plot type | Count rate plots | Images |
|---|---|---|
| Comparison with Poisson distribution Blue bars denote a histogram of data divided into 1 sec bins. Red curve is a Poisson curve with rate = median count rate of data. |
 |
 |
| Quadrant-wise count rates Data is divided into 100 sec bins |
 |
|
| Module-wise count rates for Quadrant A Data is divided into 100 sec bins |
 |
 |
| Module-wise count rates for Quadrant B Data is divided into 100 sec bins |
 |
 |
| Module-wise count rates for Quadrant C Data is divided into 100 sec bins |
 |
 |
| Module-wise count rates for Quadrant D Data is divided into 100 sec bins |
 |
 |
| Parameter | Plot |
|---|---|
| CZT HV Monitor |  |
| D_VDD | 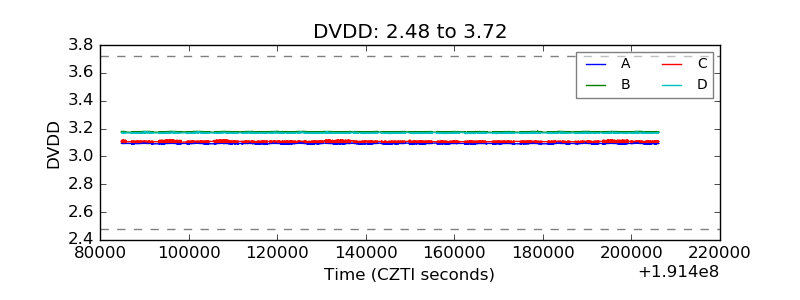 |
| Temperature 1 |  |
| Veto HV Monitor |  |
| Veto LLD |  |
| Alpha Counter |  |
| _CPM_Rate |  |
| CZT Counter |  |
| +2.5 Volts monitor |  |
| +5 Volts monitor |  |
| _ROLL_ROT |  |
| _Roll_DEC |  |
| _Roll_RA |  |
| Veto Counter |  |