| Param | Original file | Final file |
|---|---|---|
| Filename | modeM0/AS1G02_020T01_9000000296_01781cztM0_level2.evt | modeM0/AS1G02_020T01_9000000296_01781cztM0_level2_quad_clean.evt |
| Size (bytes) | 970,911,360 | 95,713,920 |
| Size | 925.9 MB | 91.3 MB |
| Events in quadrant A | 7,710,198 | 627,243 |
| Events in quadrant B | 7,263,126 | 638,255 |
| Events in quadrant C | 6,759,459 | 618,326 |
| Events in quadrant D | 7,281,784 | 604,348 |
| Mode M9 | |||
|---|---|---|---|
| Quadrant | BADHDUFLAG | Total packets | Discarded packets |
| A | 0 | 1 | 0 |
| B | 1 | 1 | 0 |
| C | 1 | -1 | -1 |
| D | 1 | -1 | -1 |
| Mode SS | |||
|---|---|---|---|
| Quadrant | BADHDUFLAG | Total packets | Discarded packets |
| A | 0 | 118 | 0 |
| B | 0 | 118 | 0 |
| C | 0 | 118 | 0 |
| D | 0 | 118 | 0 |
| Mode M0 | |||
|---|---|---|---|
| Quadrant | BADHDUFLAG | Total packets | Discarded packets |
| A | 0 | 27075 | 1 |
| B | 0 | 25748 | 1 |
| C | 0 | 24288 | 7 |
| D | 0 | 25799 | 1 |
| Quadrant | Total seconds | Saturated seconds | Saturation percentage |
|---|---|---|---|
| A | 5874 | 44 | 0.749064% |
| B | 5874 | 35 | 0.595846% |
| C | 5872 | 29 | 0.493869% |
| D | 5874 | 72 | 1.225741% |
Noise dominated data is calculated using 1-second bins in cleaned event files. If a bin has >2000 counts, and if more than 50% of those come from <1% of pixels, then it is considered to be noise-dominated and hence unusable.
| Quadrant | # 1 sec bins | Bins with >0 counts | Bins with >2000 counts | High rate bins dominated by noise | Noise dominated (total time) | Noise dominated (detector-on time) | Marked lightcurve |
|---|---|---|---|---|---|---|---|
| A | 7064 | 5875 | 275 | 275 | 3.89% | 4.68% | 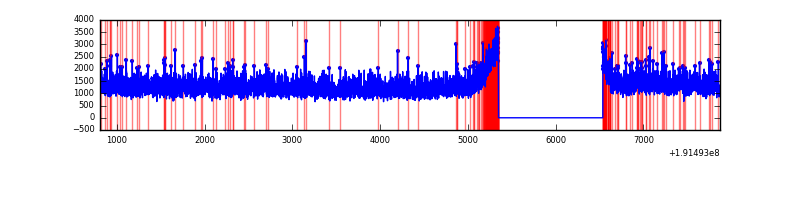 |
| B | 7064 | 5875 | 232 | 232 | 3.28% | 3.95% | 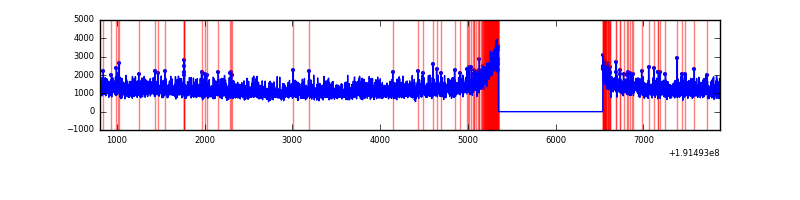 |
| C | 7064 | 5874 | 170 | 170 | 2.41% | 2.89% | 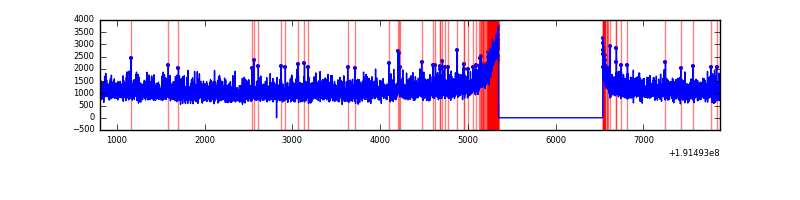 |
| D | 7064 | 5875 | 305 | 305 | 4.32% | 5.19% | 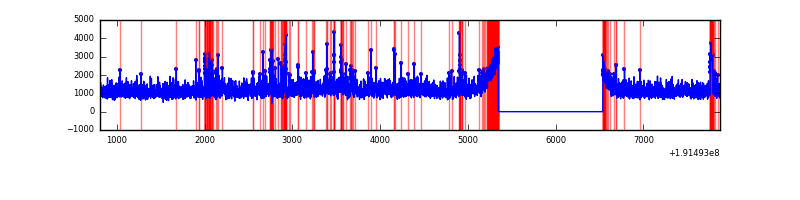 |
Top three noisy pixels from each quadrant. If the there are fewer than three noisy pixels in the level2.evt file, extra rows are filled as -1
| Pixel properties | Quadrant properties | ||||||
|---|---|---|---|---|---|---|---|
| Quadrant | DetID | PixID | Counts | Sigma | Mean | Median | Sigma |
| A | 0 | 231 | 552114 | 1232.55 | 1864 | 1875 | 446.4 |
| A | 15 | 236 | 17073 | 34.04 | 1864 | 1875 | 446.4 |
| A | 13 | 9 | 11524 | 21.61 | 1864 | 1875 | 446.4 |
| B | 0 | 229 | 13108 | 24.86 | 1910 | 1921 | 450.1 |
| B | 7 | 202 | 9200 | 16.17 | 1910 | 1921 | 450.1 |
| B | 0 | 234 | 7187 | 11.7 | 1910 | 1921 | 450.1 |
| C | 8 | 208 | 13015 | 23.55 | 1725 | 1781 | 476.9 |
| C | 9 | 236 | 6895 | 10.72 | 1725 | 1781 | 476.9 |
| C | 15 | 246 | 6407 | 9.7 | 1725 | 1781 | 476.9 |
| D | 7 | 85 | 370555 | 695.76 | 1706 | 1764 | 530.1 |
| D | 13 | 53 | 167197 | 312.11 | 1706 | 1764 | 530.1 |
| D | 2 | 16 | 122437 | 227.66 | 1706 | 1764 | 530.1 |
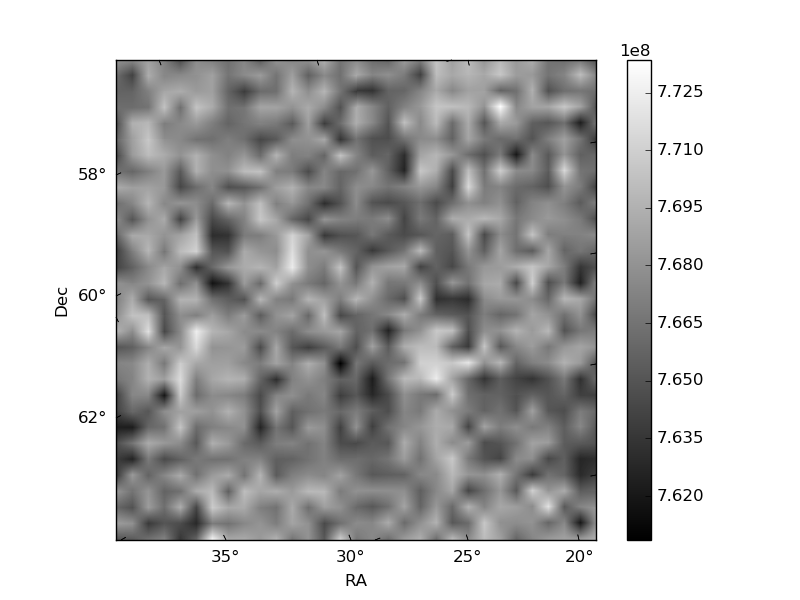
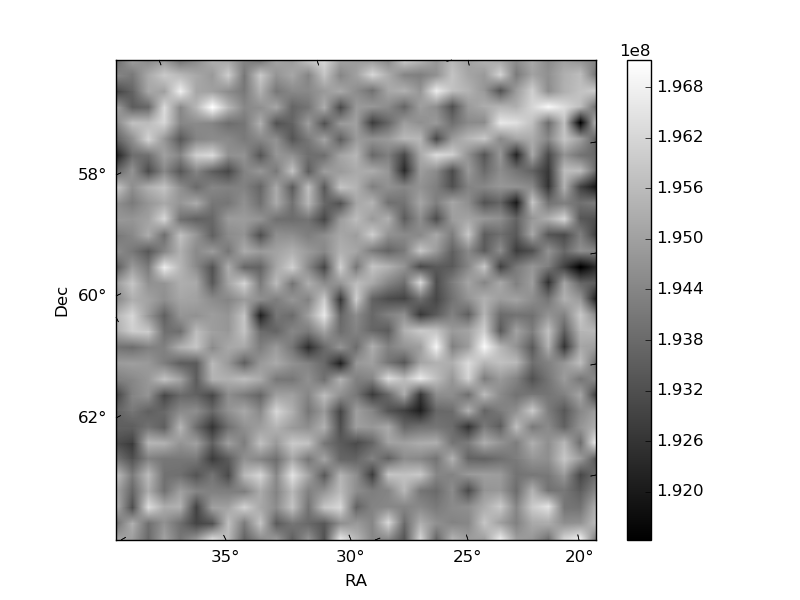
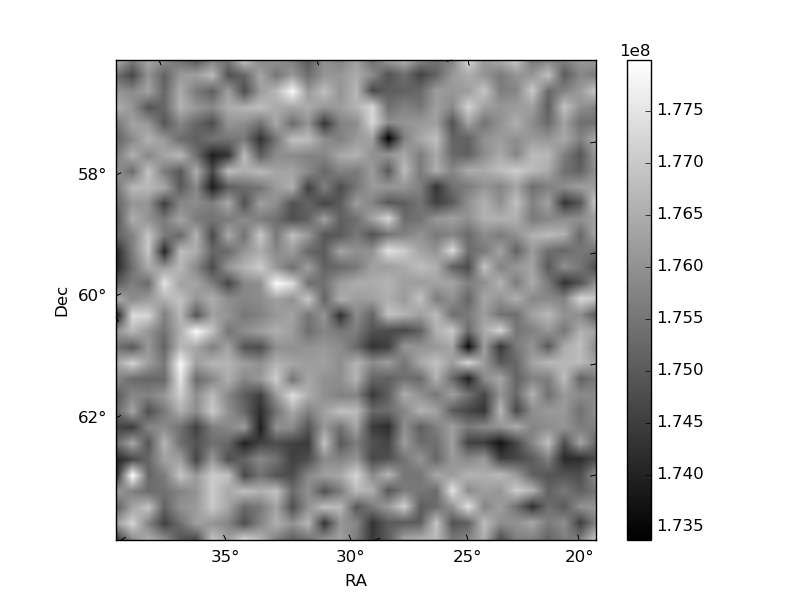
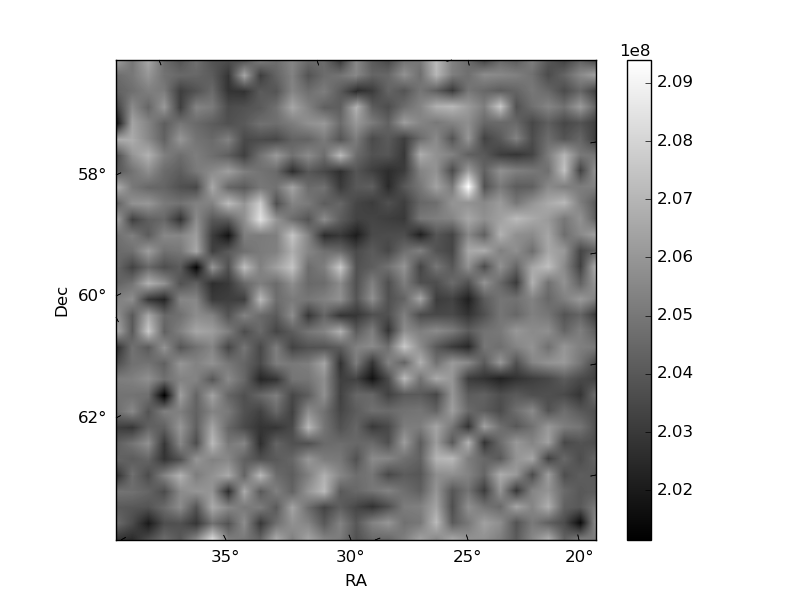
Histogram calculated using DETX and DETY for each event in the final _common_clean file
| Quadrant A | 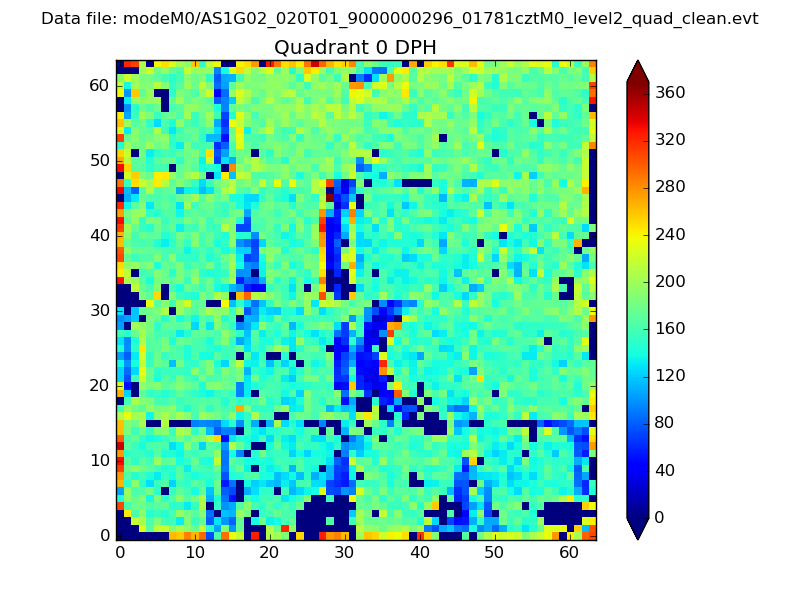 |
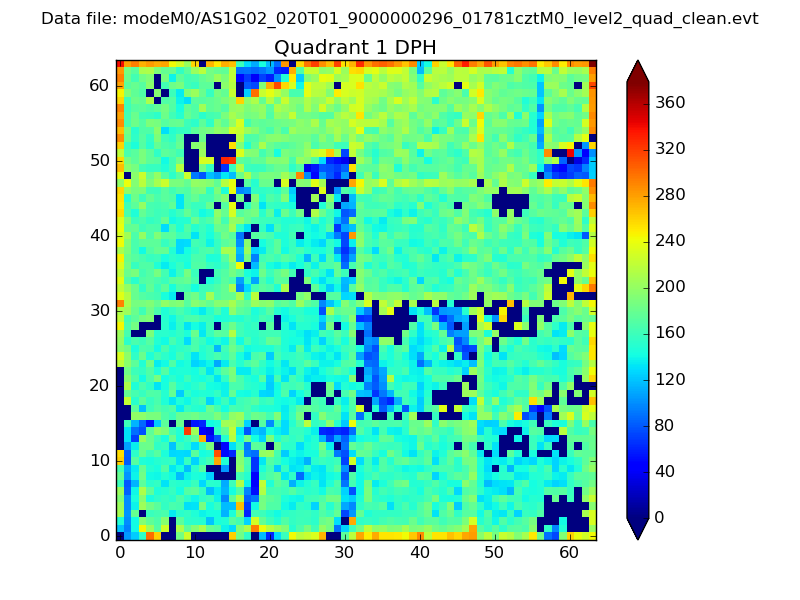 |
Quadrant B |
|---|---|---|---|
| Quadrant D | 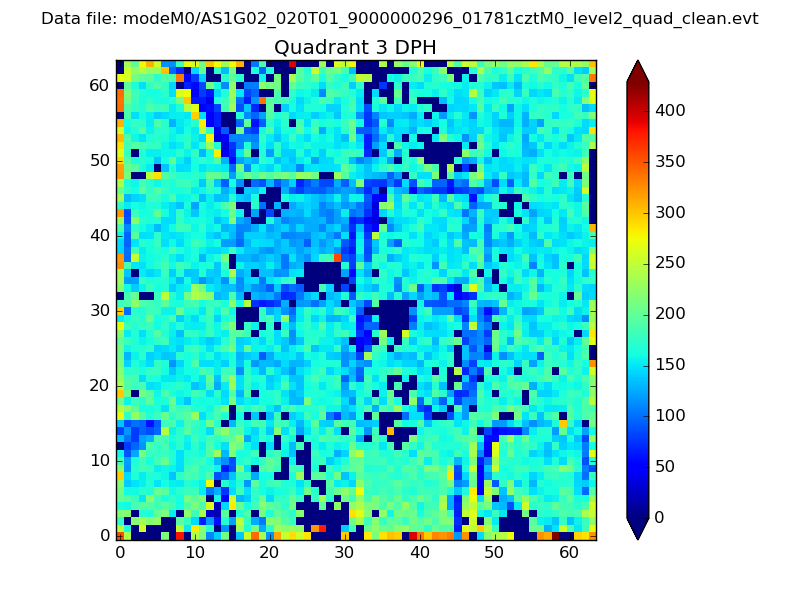 |
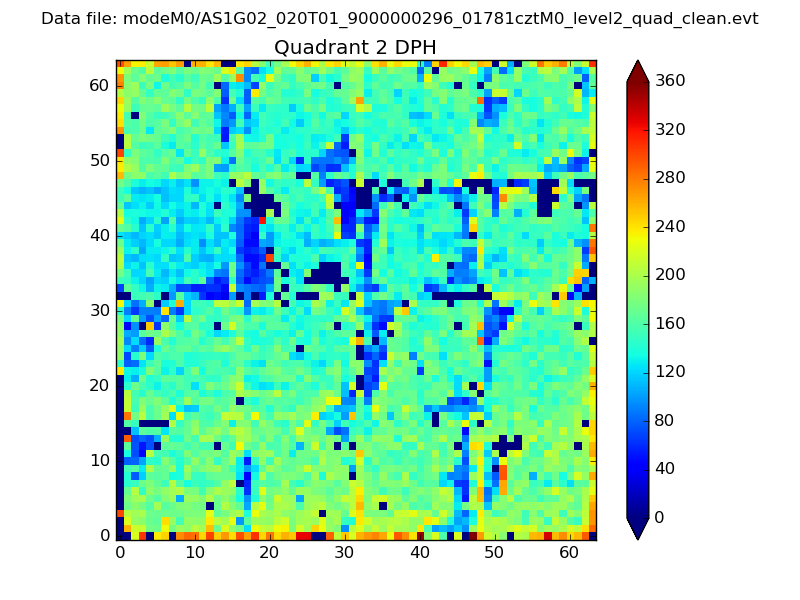 |
Quadrant C |
| Plot type | Count rate plots | Images |
|---|---|---|
| Comparison with Poisson distribution Blue bars denote a histogram of data divided into 1 sec bins. Red curve is a Poisson curve with rate = median count rate of data. |
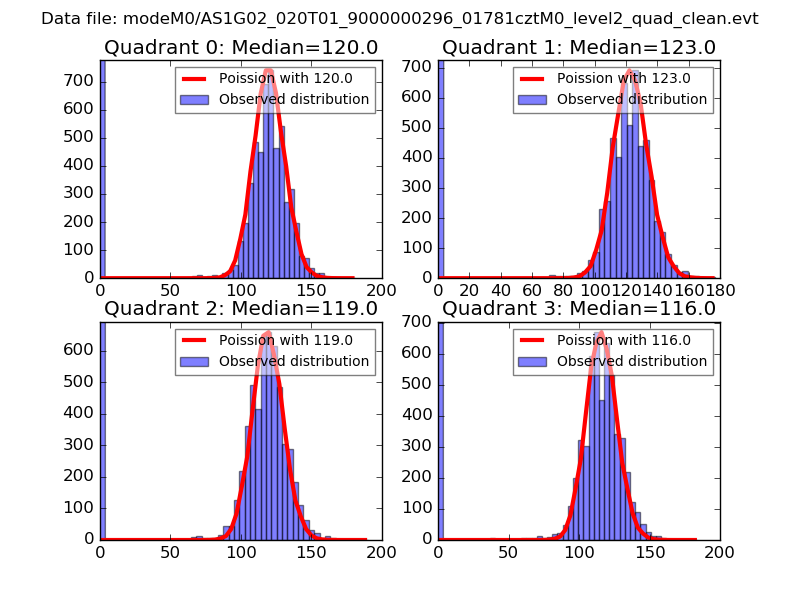 |
 |
| Quadrant-wise count rates Data is divided into 100 sec bins |
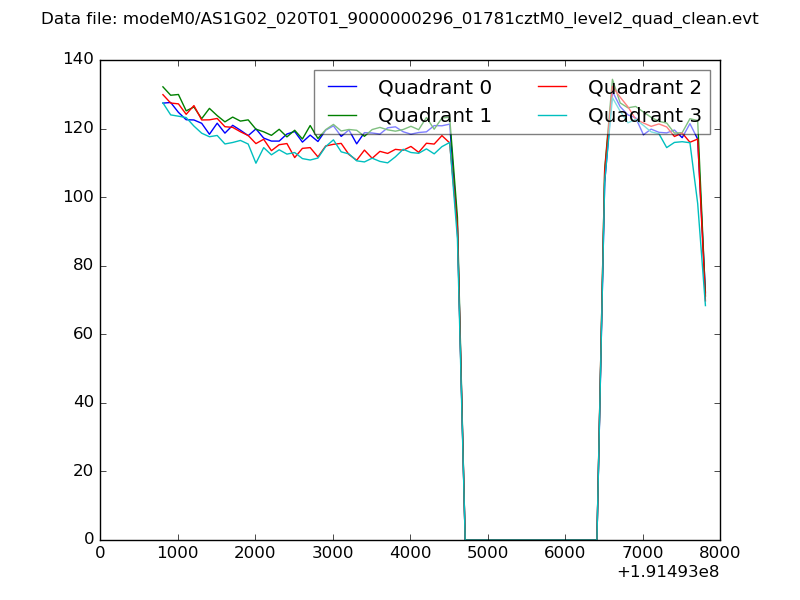 |
|
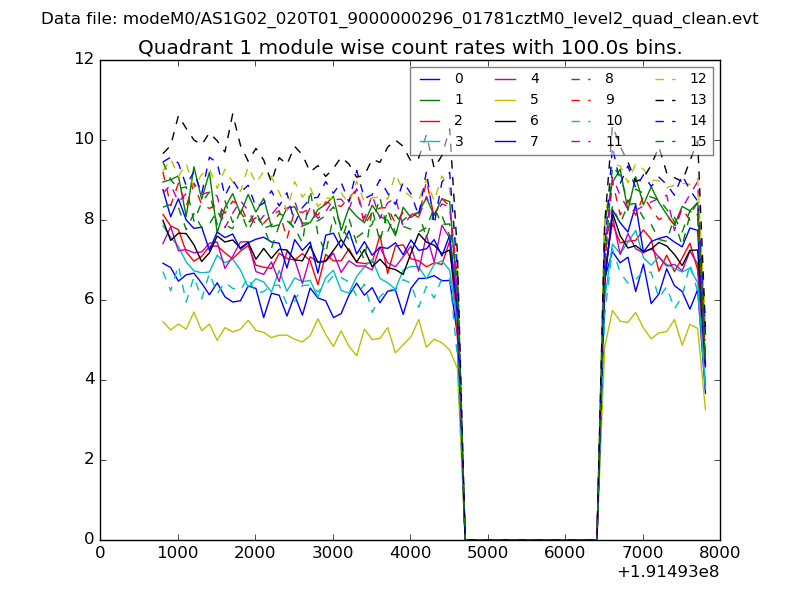
| Module-wise count rates for Quadrant A Data is divided into 100 sec bins |
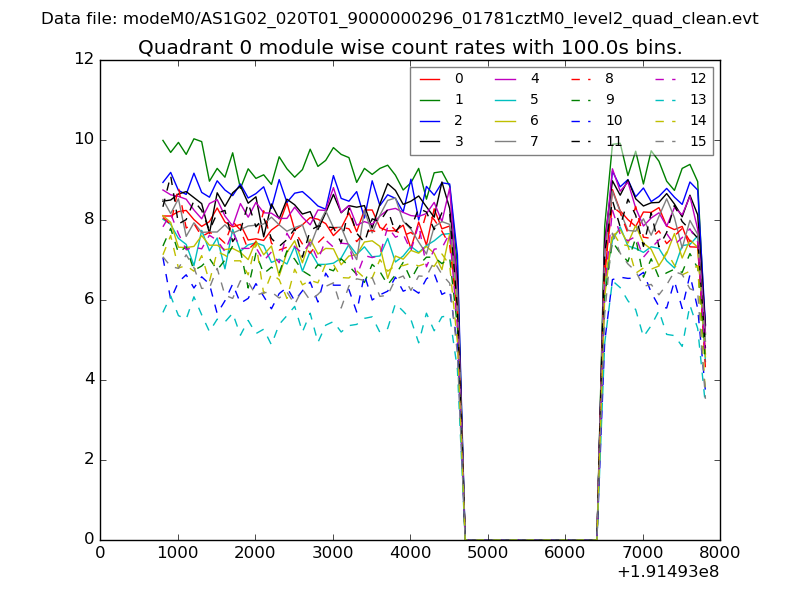 |
 |
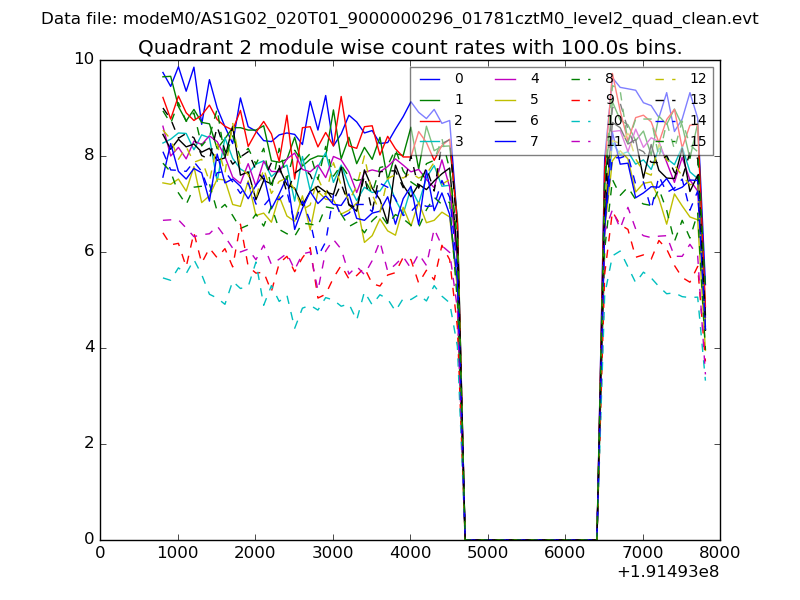
| Module-wise count rates for Quadrant B Data is divided into 100 sec bins |
 |
 |
| Module-wise count rates for Quadrant C Data is divided into 100 sec bins |
 |
 |
| Module-wise count rates for Quadrant D Data is divided into 100 sec bins |
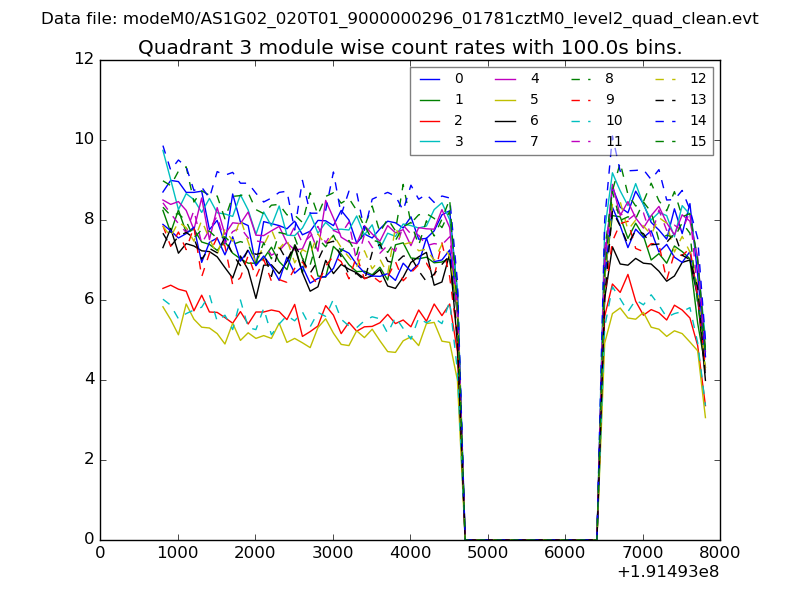 |
 |
| Parameter | Plot |
|---|---|
| CZT HV Monitor | 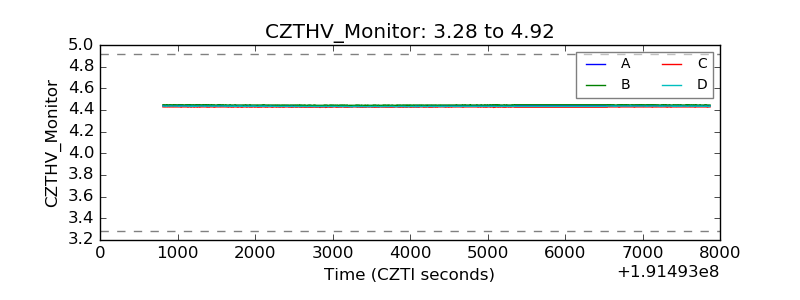 |
| D_VDD | 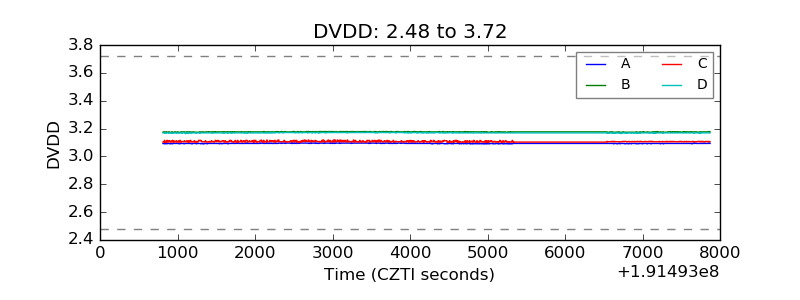 |
| Temperature 1 | 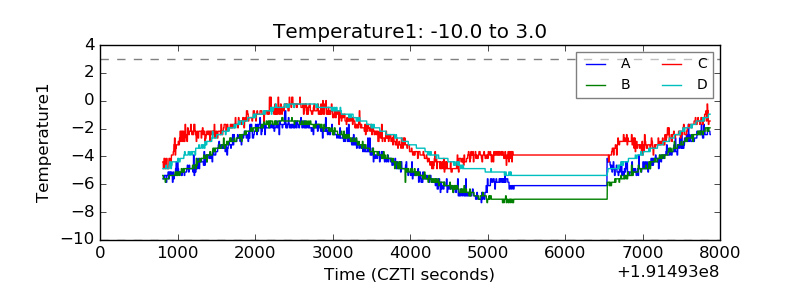 |
| Veto HV Monitor | 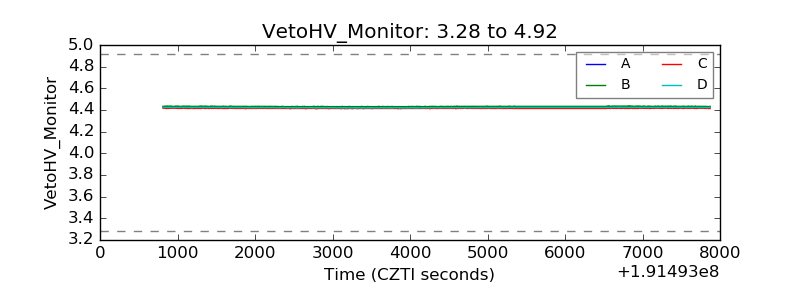 |
| Veto LLD |  |
| Alpha Counter | 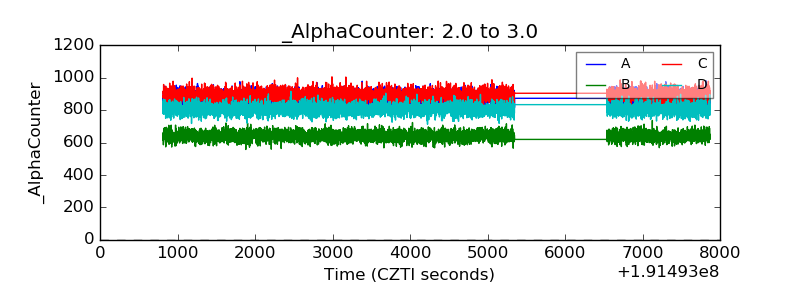 |
| _CPM_Rate | 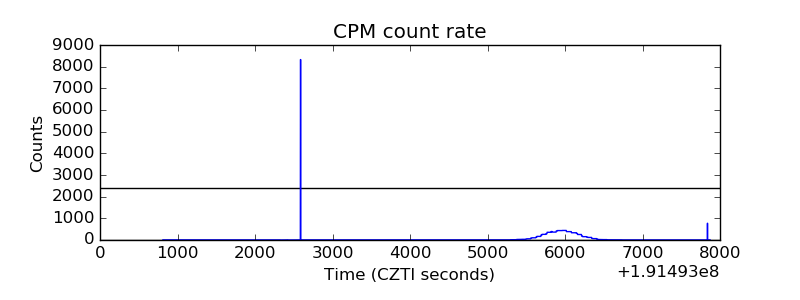 |
| CZT Counter |  |
| +2.5 Volts monitor |  |
| +5 Volts monitor |  |
| _ROLL_ROT | 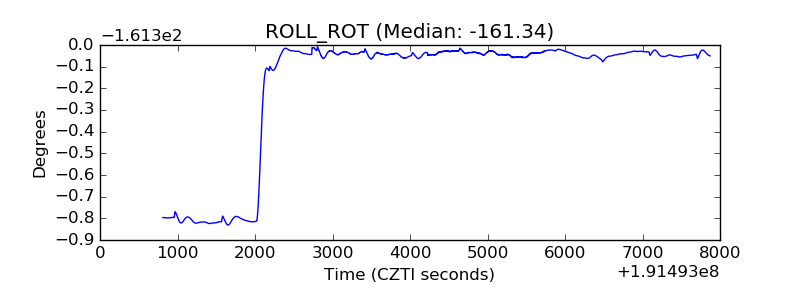 |
| _Roll_DEC | 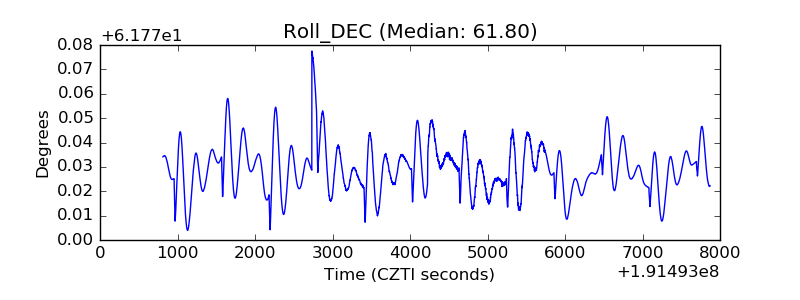 |
| _Roll_RA | 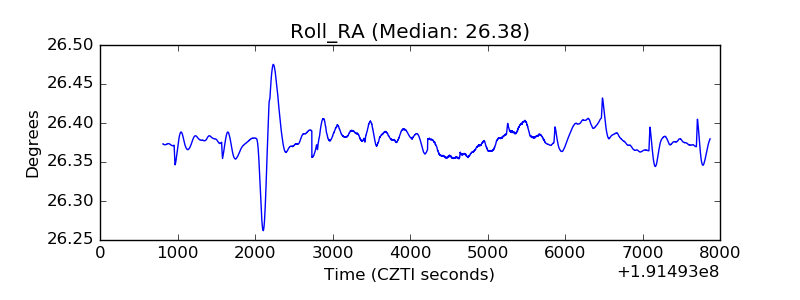 |
| Veto Counter | 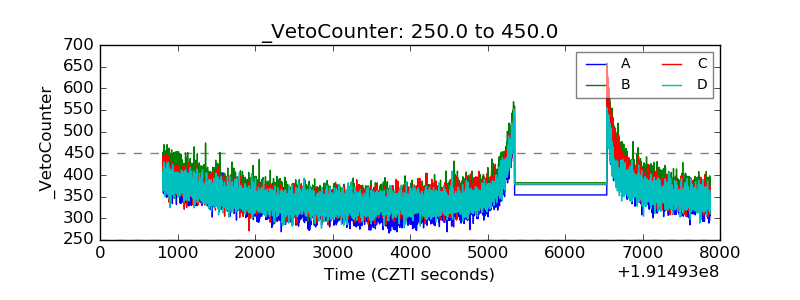 |