| Param | Original file | Final file |
|---|---|---|
| Filename | modeM0/AS1G02_020T01_9000000296_01782cztM0_level2.evt | modeM0/AS1G02_020T01_9000000296_01782cztM0_level2_quad_clean.evt |
| Size (bytes) | 1,107,201,600 | 97,470,720 |
| Size | 1.0 GB | 93.0 MB |
| Events in quadrant A | 8,568,248 | 631,972 |
| Events in quadrant B | 8,283,679 | 638,677 |
| Events in quadrant C | 7,827,536 | 616,849 |
| Events in quadrant D | 8,414,836 | 603,538 |
| Mode M9 | |||
|---|---|---|---|
| Quadrant | BADHDUFLAG | Total packets | Discarded packets |
| A | 0 | 1 | 0 |
| B | 1 | 1 | 0 |
| C | 1 | -1 | -1 |
| D | 1 | -1 | -1 |
| Mode SS | |||
|---|---|---|---|
| Quadrant | BADHDUFLAG | Total packets | Discarded packets |
| A | 0 | 132 | 0 |
| B | 0 | 132 | 0 |
| C | 0 | 132 | 0 |
| D | 0 | 132 | 0 |
| Mode M0 | |||
|---|---|---|---|
| Quadrant | BADHDUFLAG | Total packets | Discarded packets |
| A | 0 | 30148 | 13 |
| B | 0 | 29345 | 2 |
| C | 0 | 27996 | 11 |
| D | 0 | 29680 | 2 |
| Quadrant | Total seconds | Saturated seconds | Saturation percentage |
|---|---|---|---|
| A | 6607 | 62 | 0.938399% |
| B | 6609 | 43 | 0.650628% |
| C | 6607 | 33 | 0.499470% |
| D | 6609 | 167 | 2.526857% |
Noise dominated data is calculated using 1-second bins in cleaned event files. If a bin has >2000 counts, and if more than 50% of those come from <1% of pixels, then it is considered to be noise-dominated and hence unusable.
| Quadrant | # 1 sec bins | Bins with >0 counts | Bins with >2000 counts | High rate bins dominated by noise | Noise dominated (total time) | Noise dominated (detector-on time) | Marked lightcurve |
|---|---|---|---|---|---|---|---|
| A | 7579 | 6609 | 352 | 352 | 4.64% | 5.33% | 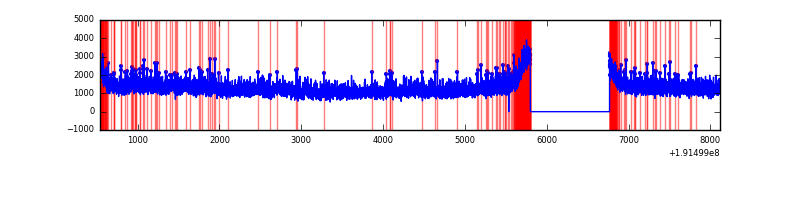 |
| B | 7579 | 6610 | 312 | 312 | 4.12% | 4.72% | 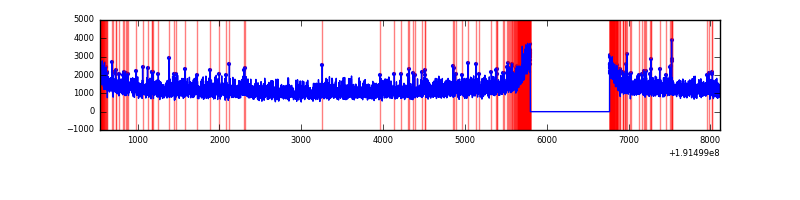 |
| C | 7579 | 6609 | 215 | 215 | 2.84% | 3.25% |  |
| D | 7579 | 6609 | 445 | 445 | 5.87% | 6.73% | 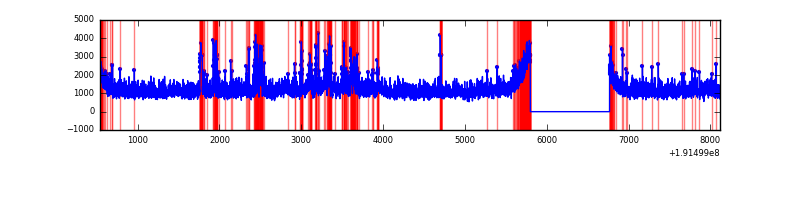 |
Top three noisy pixels from each quadrant. If the there are fewer than three noisy pixels in the level2.evt file, extra rows are filled as -1
| Pixel properties | Quadrant properties | ||||||
|---|---|---|---|---|---|---|---|
| Quadrant | DetID | PixID | Counts | Sigma | Mean | Median | Sigma |
| A | 0 | 231 | 446988 | 870.69 | 2121 | 2131 | 510.9 |
| A | 10 | 2 | 11700 | 18.73 | 2121 | 2131 | 510.9 |
| A | 13 | 9 | 5173 | 5.95 | 2121 | 2131 | 510.9 |
| B | 15 | 85 | 25977 | 46.04 | 2168 | 2174 | 517.0 |
| B | 5 | 94 | 22564 | 39.44 | 2168 | 2174 | 517.0 |
| B | 0 | 234 | 18751 | 32.07 | 2168 | 2174 | 517.0 |
| C | 8 | 208 | 190288 | 345.64 | 1952 | 2015 | 544.7 |
| C | 15 | 246 | 10735 | 16.01 | 1952 | 2015 | 544.7 |
| C | 14 | 48 | 7024 | 9.2 | 1952 | 2015 | 544.7 |
| D | 10 | 85 | 488399 | 802.14 | 1933 | 1996 | 606.4 |
| D | 7 | 85 | 366313 | 600.81 | 1933 | 1996 | 606.4 |
| D | 13 | 138 | 112017 | 181.44 | 1933 | 1996 | 606.4 |
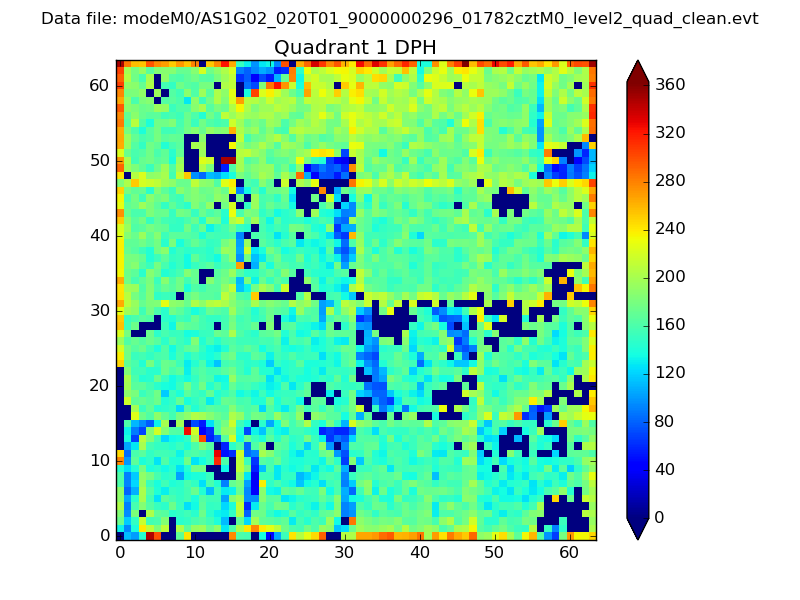
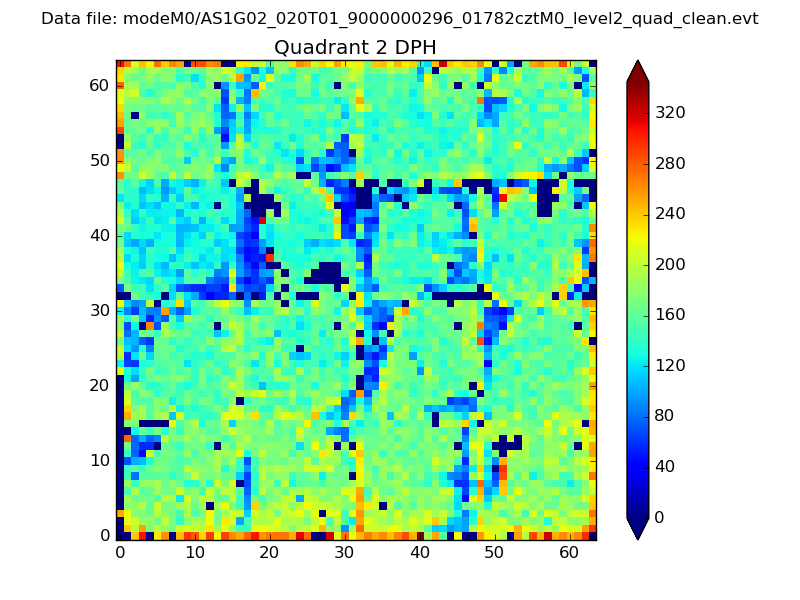
Histogram calculated using DETX and DETY for each event in the final _common_clean file
| Quadrant A | 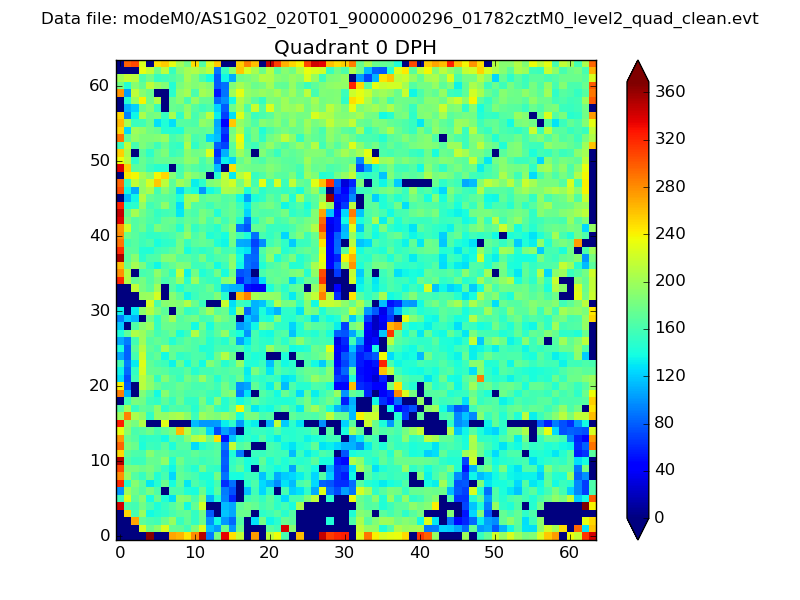 |
 |
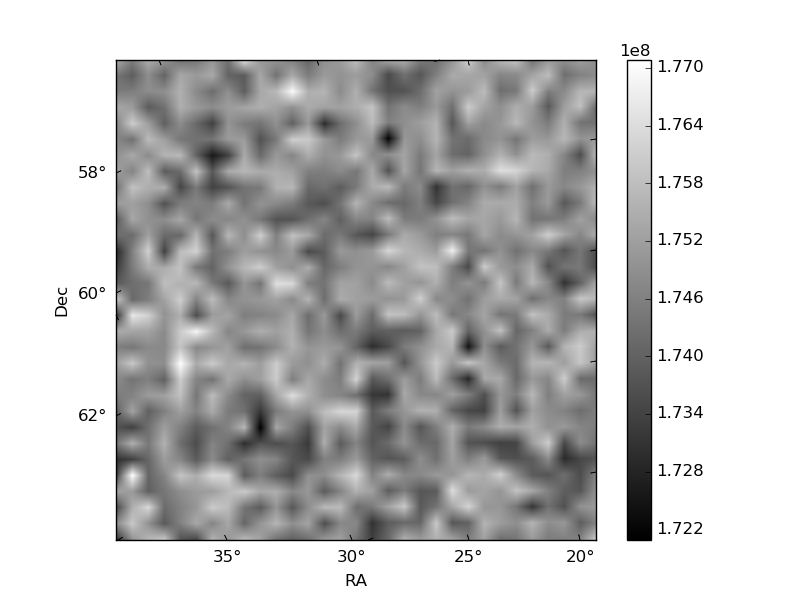
Quadrant B |
|---|---|---|---|
| Quadrant D |  |
 |
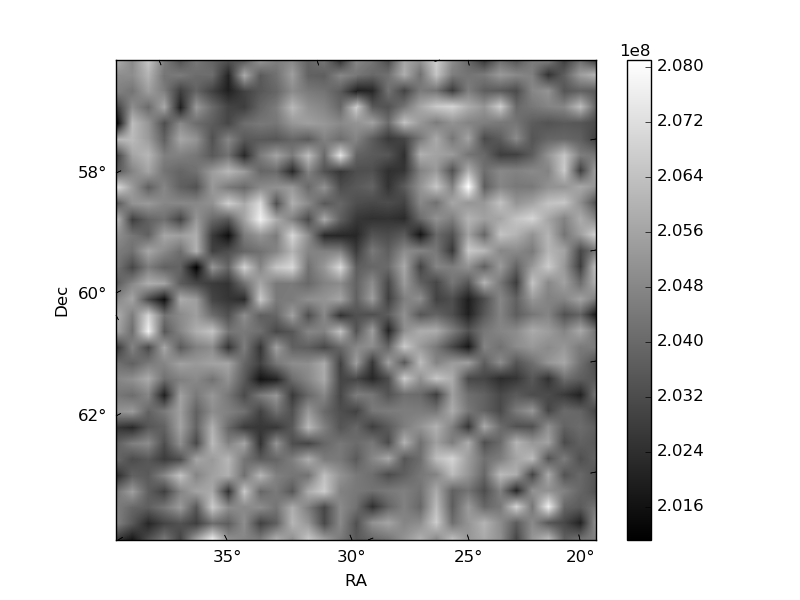
Quadrant C |
| Plot type | Count rate plots | Images |
|---|---|---|
| Comparison with Poisson distribution Blue bars denote a histogram of data divided into 1 sec bins. Red curve is a Poisson curve with rate = median count rate of data. |
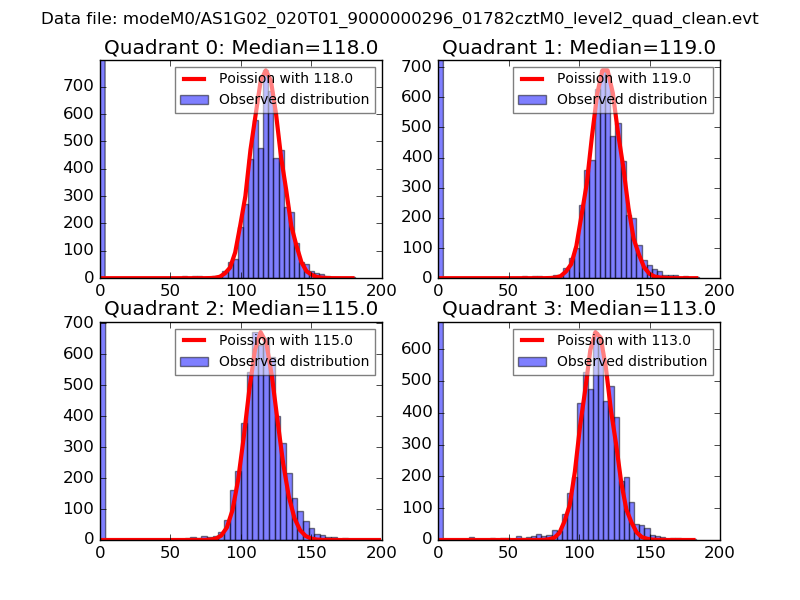 |
 |
| Quadrant-wise count rates Data is divided into 100 sec bins |
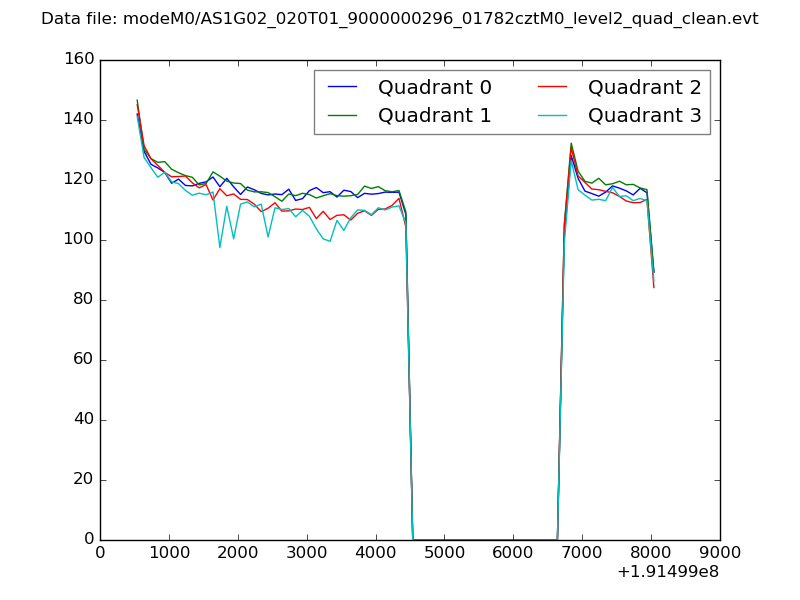 |
|
| Module-wise count rates for Quadrant A Data is divided into 100 sec bins |
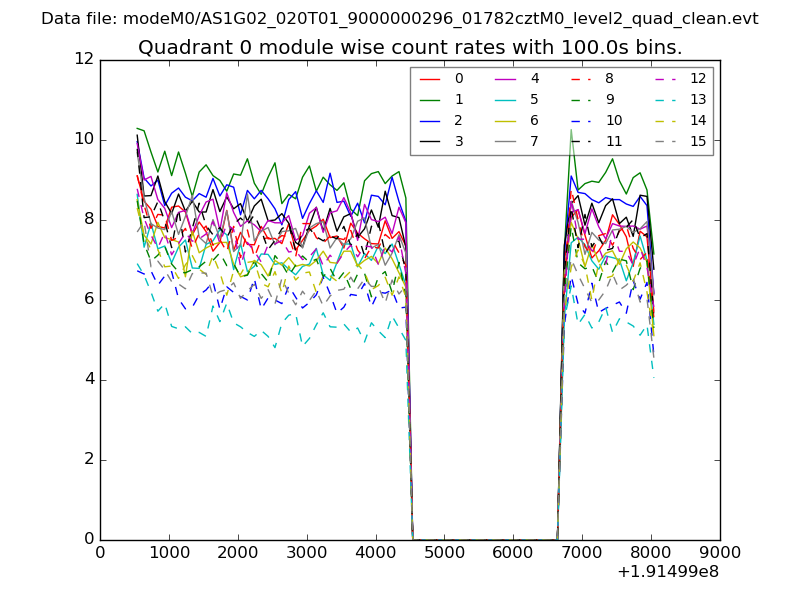 |
 |
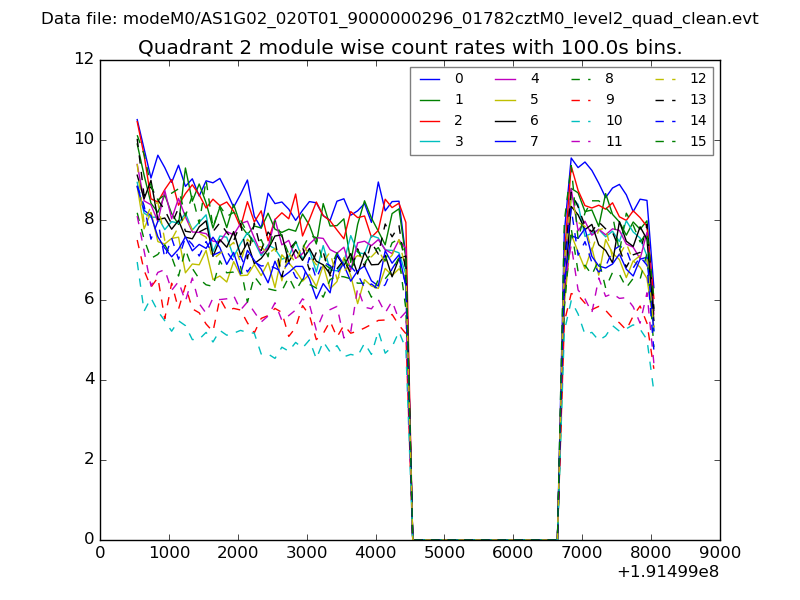
| Module-wise count rates for Quadrant B Data is divided into 100 sec bins |
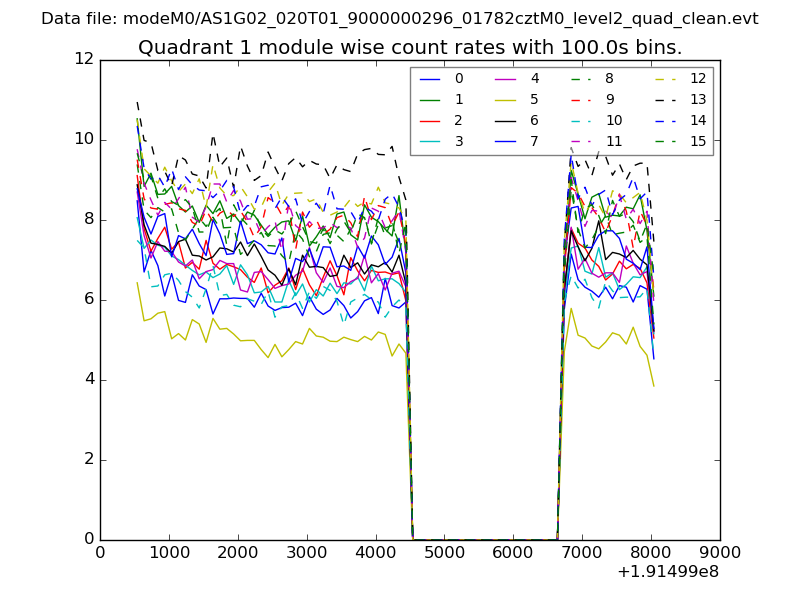 |
 |
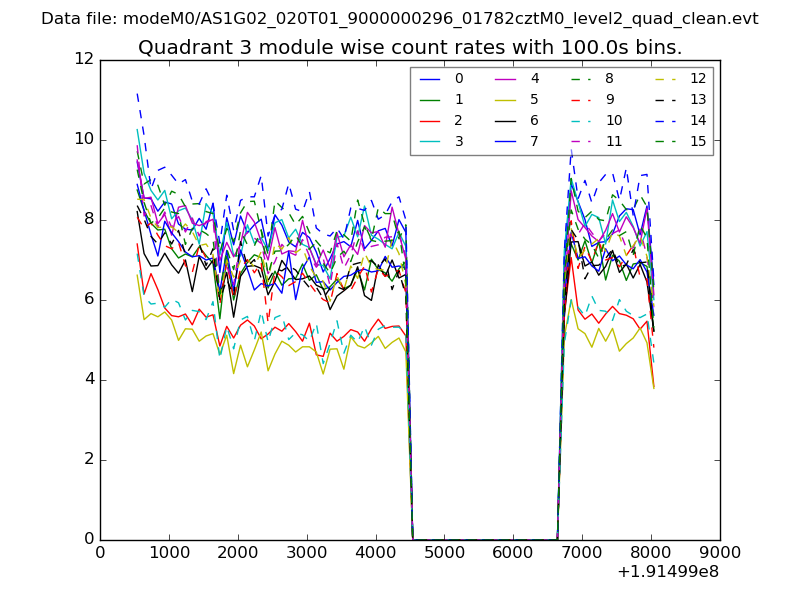
| Module-wise count rates for Quadrant C Data is divided into 100 sec bins |
 |
 |
| Module-wise count rates for Quadrant D Data is divided into 100 sec bins |
 |
 |
| Parameter | Plot |
|---|---|
| CZT HV Monitor | 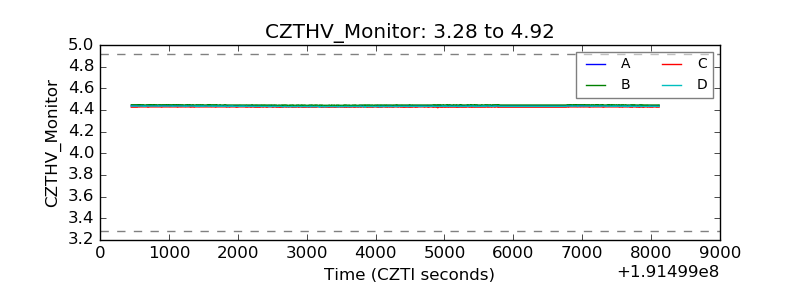 |
| D_VDD | 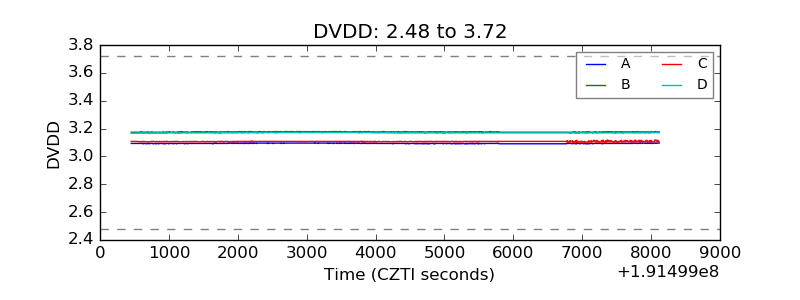 |
| Temperature 1 | 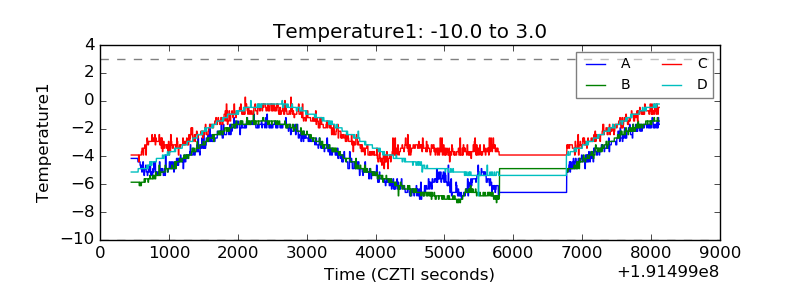 |
| Veto HV Monitor | 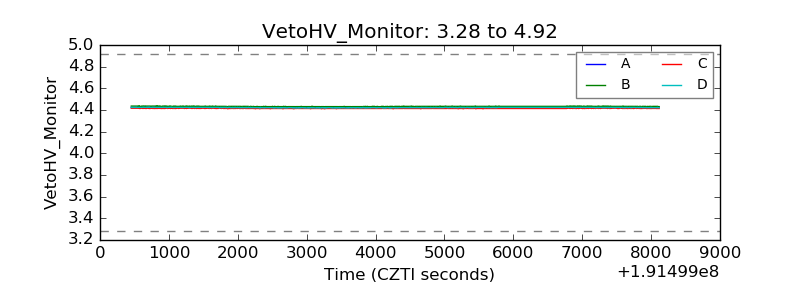 |
| Veto LLD | 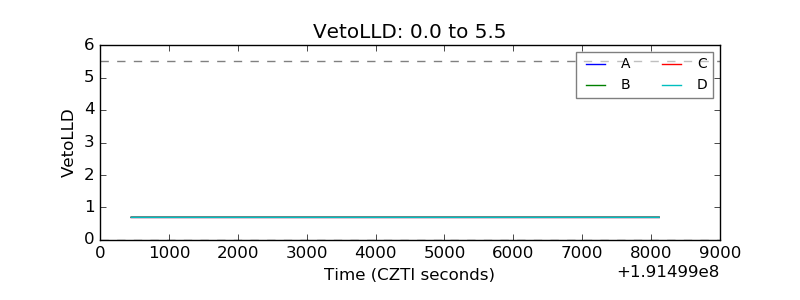 |
| Alpha Counter | 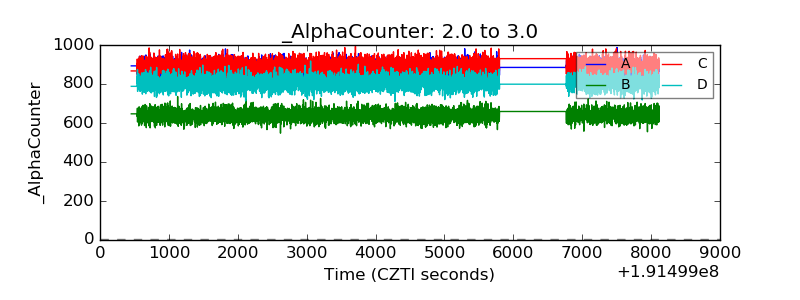 |
| _CPM_Rate | 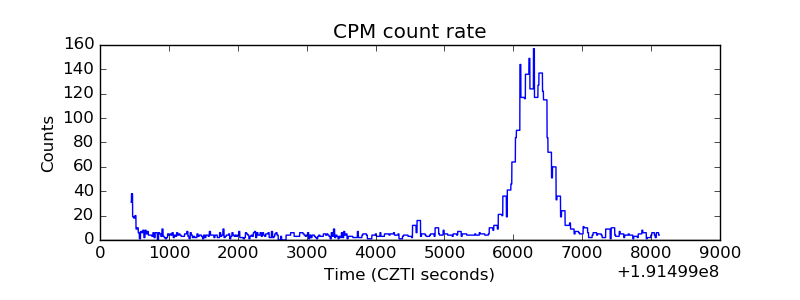 |
| CZT Counter | 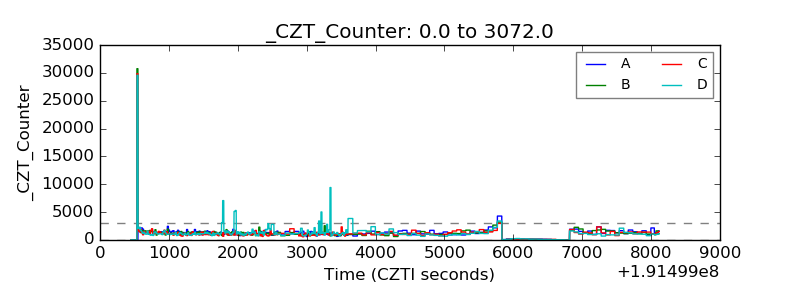 |
| +2.5 Volts monitor |  |
| +5 Volts monitor |  |
| _ROLL_ROT | 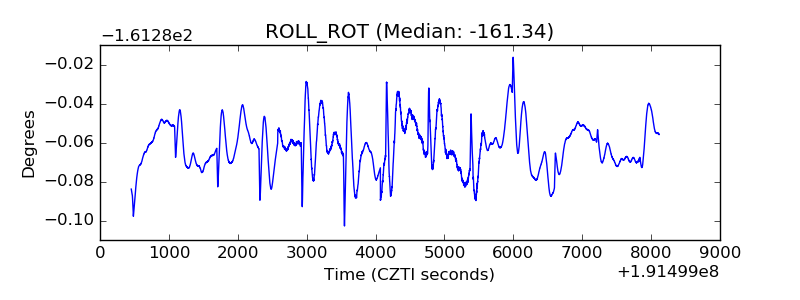 |
| _Roll_DEC | 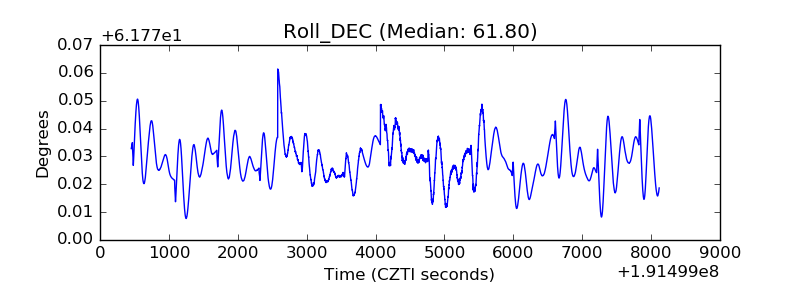 |
| _Roll_RA | 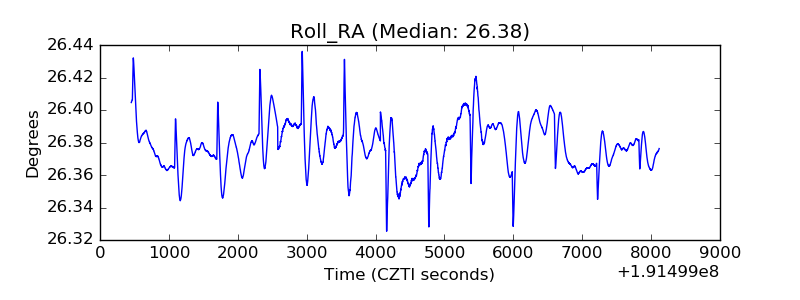 |
| Veto Counter | 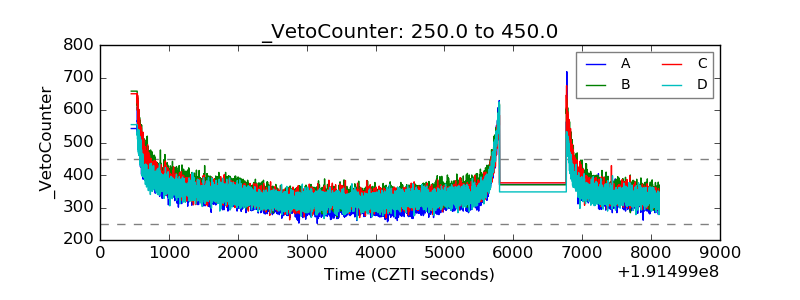 |