| Param | Original file | Final file |
|---|---|---|
| Filename | modeM0/AS1G02_020T01_9000000296_01783cztM0_level2.evt | modeM0/AS1G02_020T01_9000000296_01783cztM0_level2_quad_clean.evt |
| Size (bytes) | 1,180,552,320 | 95,474,880 |
| Size | 1.1 GB | 91.1 MB |
| Events in quadrant A | 9,051,369 | 608,166 |
| Events in quadrant B | 8,684,733 | 619,025 |
| Events in quadrant C | 8,750,949 | 595,581 |
| Events in quadrant D | 8,808,054 | 585,928 |
| Mode M9 | |||
|---|---|---|---|
| Quadrant | BADHDUFLAG | Total packets | Discarded packets |
| A | 0 | 1 | 0 |
| B | 1 | 1 | 0 |
| C | 1 | -1 | -1 |
| D | 1 | -1 | -1 |
| Mode SS | |||
|---|---|---|---|
| Quadrant | BADHDUFLAG | Total packets | Discarded packets |
| A | 0 | 138 | 0 |
| B | 0 | 138 | 0 |
| C | 0 | 138 | 0 |
| D | 0 | 138 | 0 |
| Mode M0 | |||
|---|---|---|---|
| Quadrant | BADHDUFLAG | Total packets | Discarded packets |
| A | 0 | 31814 | 2 |
| B | 0 | 30713 | 2 |
| C | 0 | 30901 | 2 |
| D | 0 | 31078 | 12 |
| Quadrant | Total seconds | Saturated seconds | Saturation percentage |
|---|---|---|---|
| A | 6930 | 31 | 0.447330% |
| B | 6930 | 20 | 0.288600% |
| C | 6930 | 30 | 0.432900% |
| D | 6928 | 139 | 2.006351% |
Noise dominated data is calculated using 1-second bins in cleaned event files. If a bin has >2000 counts, and if more than 50% of those come from <1% of pixels, then it is considered to be noise-dominated and hence unusable.
| Quadrant | # 1 sec bins | Bins with >0 counts | Bins with >2000 counts | High rate bins dominated by noise | Noise dominated (total time) | Noise dominated (detector-on time) | Marked lightcurve |
|---|---|---|---|---|---|---|---|
| A | 7580 | 6931 | 365 | 365 | 4.82% | 5.27% | 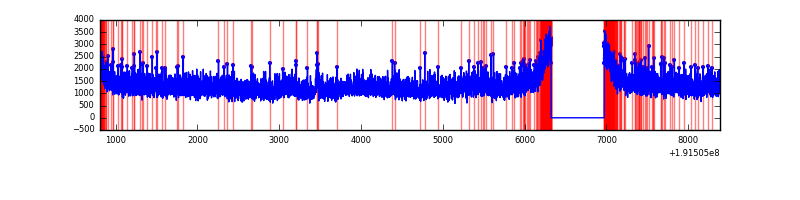 |
| B | 7580 | 6931 | 336 | 336 | 4.43% | 4.85% | 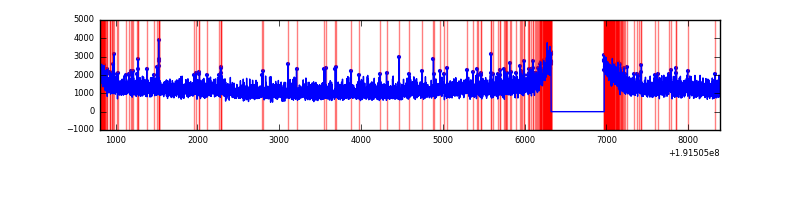 |
| C | 7580 | 6931 | 309 | 309 | 4.08% | 4.46% | 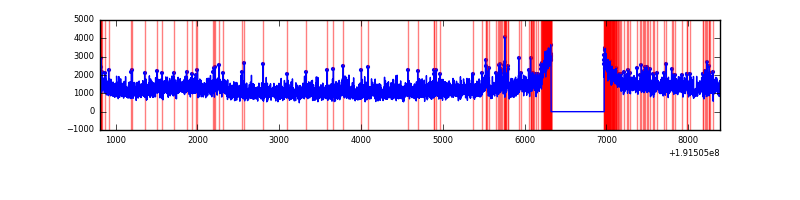 |
| D | 7580 | 6930 | 503 | 503 | 6.64% | 7.26% | 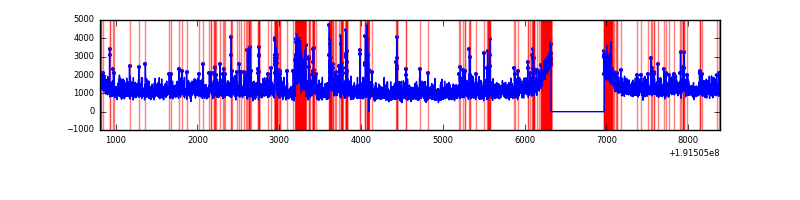 |
Top three noisy pixels from each quadrant. If the there are fewer than three noisy pixels in the level2.evt file, extra rows are filled as -1
| Pixel properties | Quadrant properties | ||||||
|---|---|---|---|---|---|---|---|
| Quadrant | DetID | PixID | Counts | Sigma | Mean | Median | Sigma |
| A | 0 | 231 | 547622 | 1024.2 | 2210 | 2221 | 532.5 |
| A | 13 | 9 | 27374 | 47.23 | 2210 | 2221 | 532.5 |
| A | 15 | 233 | 11770 | 17.93 | 2210 | 2221 | 532.5 |
| B | 15 | 85 | 27973 | 47.75 | 2265 | 2278 | 538.1 |
| B | 0 | 234 | 27924 | 47.66 | 2265 | 2278 | 538.1 |
| B | 0 | 244 | 22455 | 37.5 | 2265 | 2278 | 538.1 |
| C | 8 | 208 | 708006 | 1233.3 | 2053 | 2126 | 572.3 |
| C | 10 | 82 | 10449 | 14.54 | 2053 | 2126 | 572.3 |
| C | 14 | 48 | 9955 | 13.68 | 2053 | 2126 | 572.3 |
| D | 7 | 85 | 324135 | 517.22 | 2020 | 2097 | 622.6 |
| D | 13 | 138 | 317321 | 506.28 | 2020 | 2097 | 622.6 |
| D | 13 | 53 | 286998 | 457.58 | 2020 | 2097 | 622.6 |
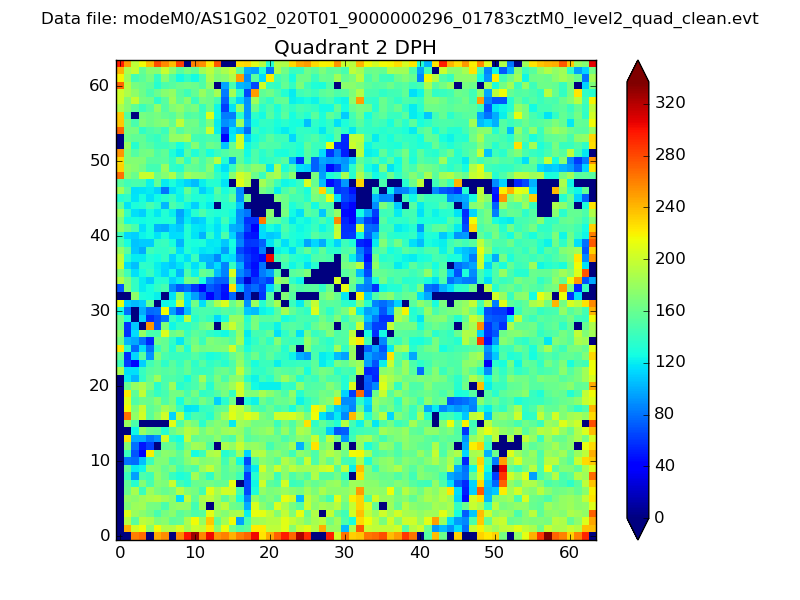
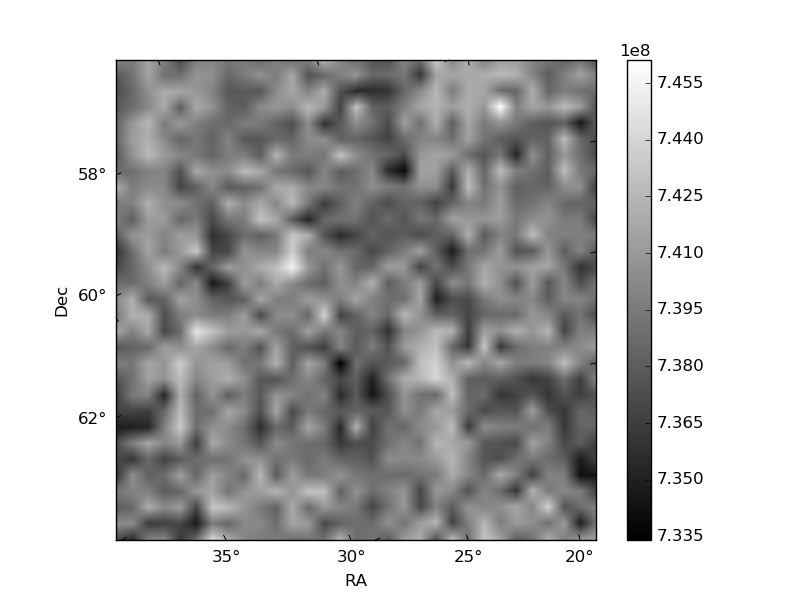
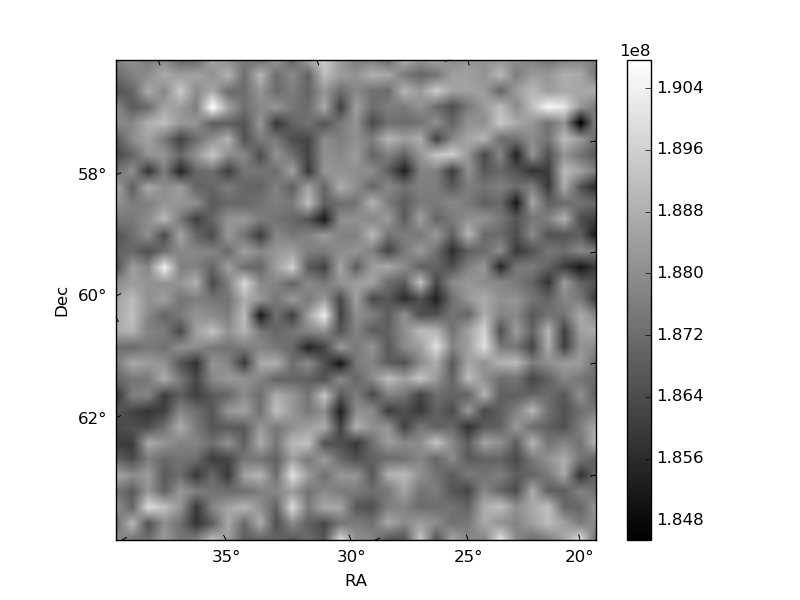
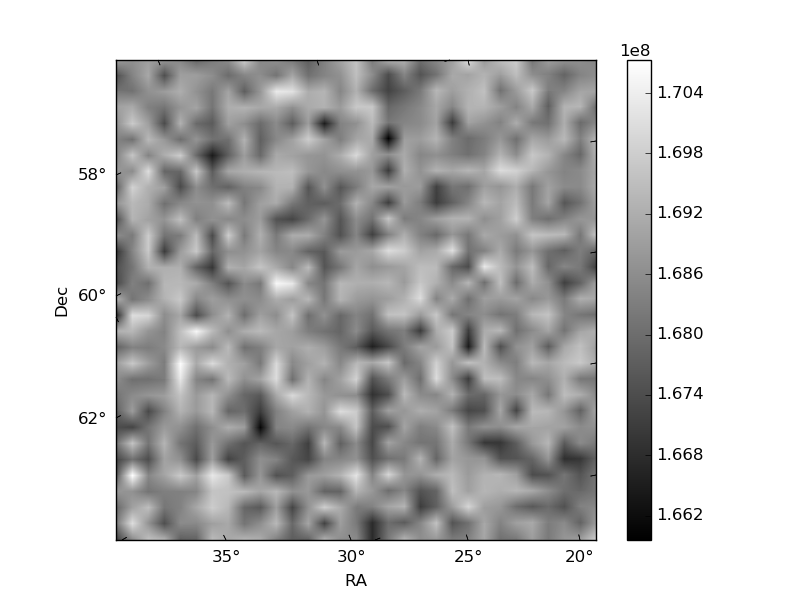
Histogram calculated using DETX and DETY for each event in the final _common_clean file
| Quadrant A | 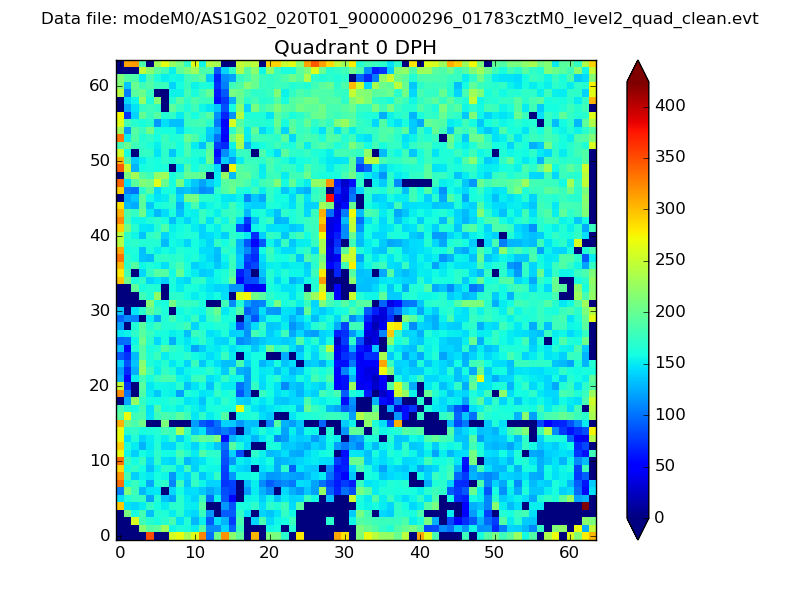 |
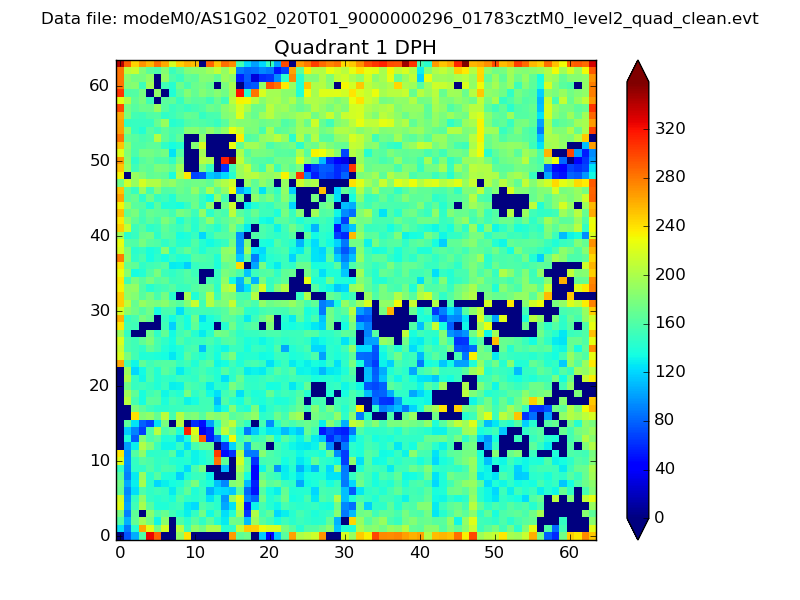 |
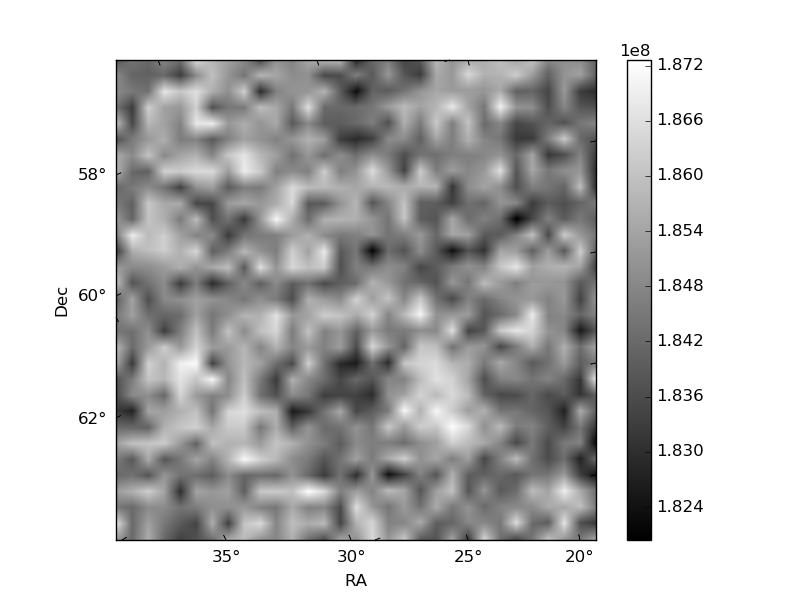
Quadrant B |
|---|---|---|---|
| Quadrant D | 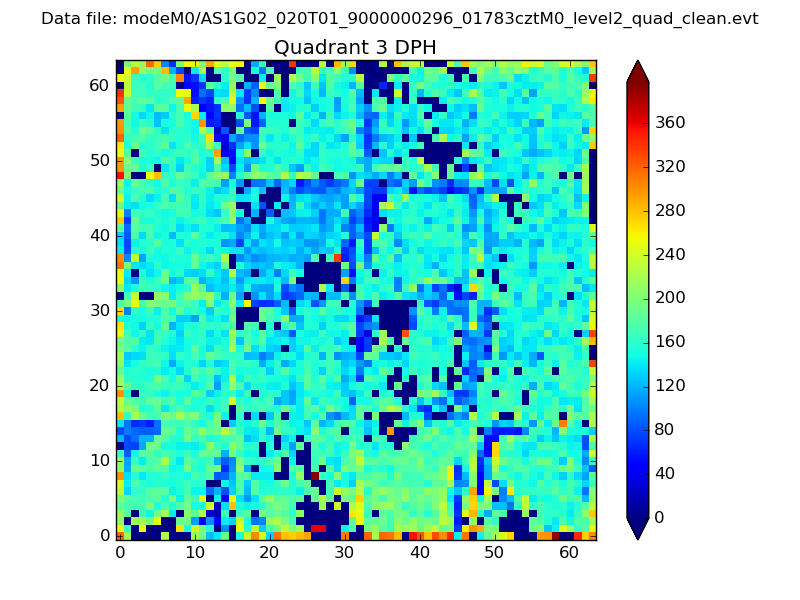 |
 |
Quadrant C |
| Plot type | Count rate plots | Images |
|---|---|---|
| Comparison with Poisson distribution Blue bars denote a histogram of data divided into 1 sec bins. Red curve is a Poisson curve with rate = median count rate of data. |
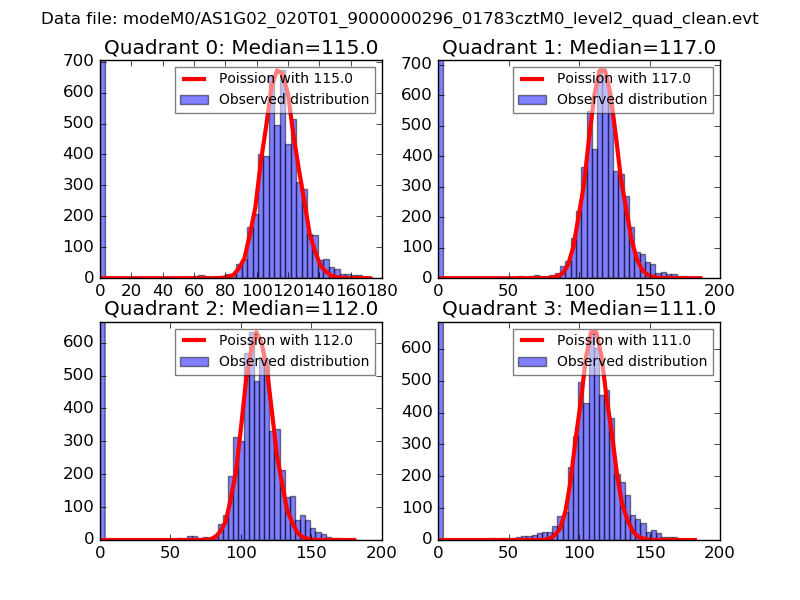 |
 |
| Quadrant-wise count rates Data is divided into 100 sec bins |
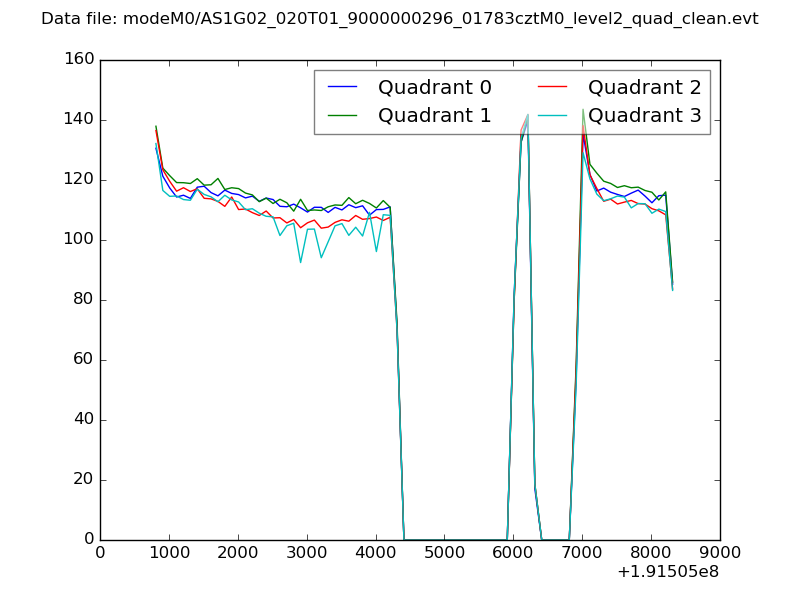 |
|
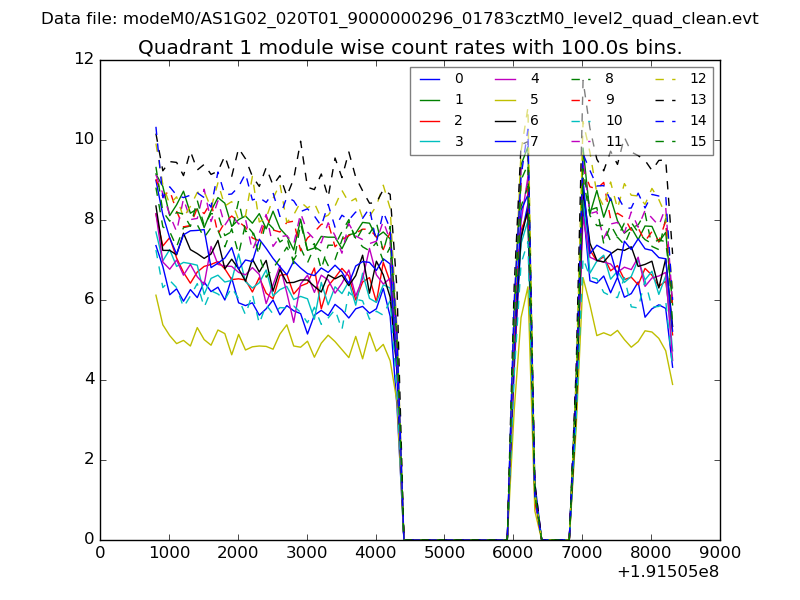
| Module-wise count rates for Quadrant A Data is divided into 100 sec bins |
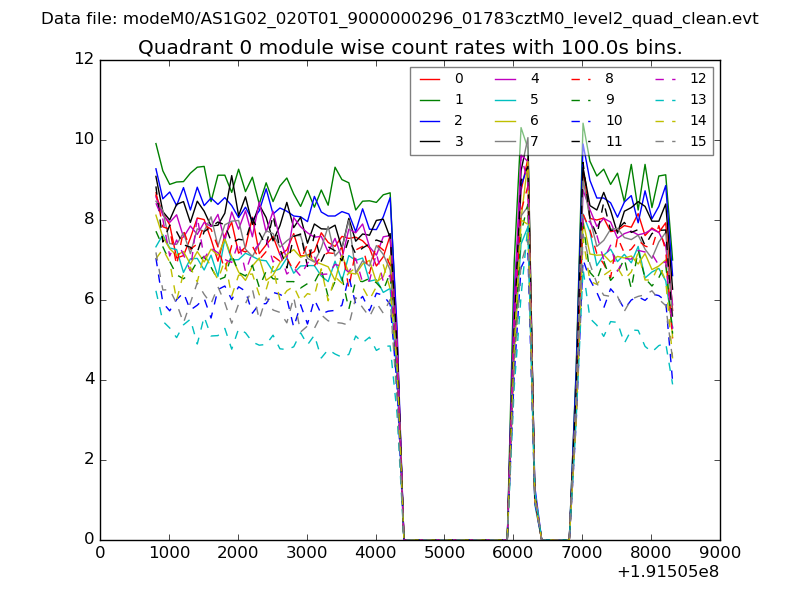 |
 |
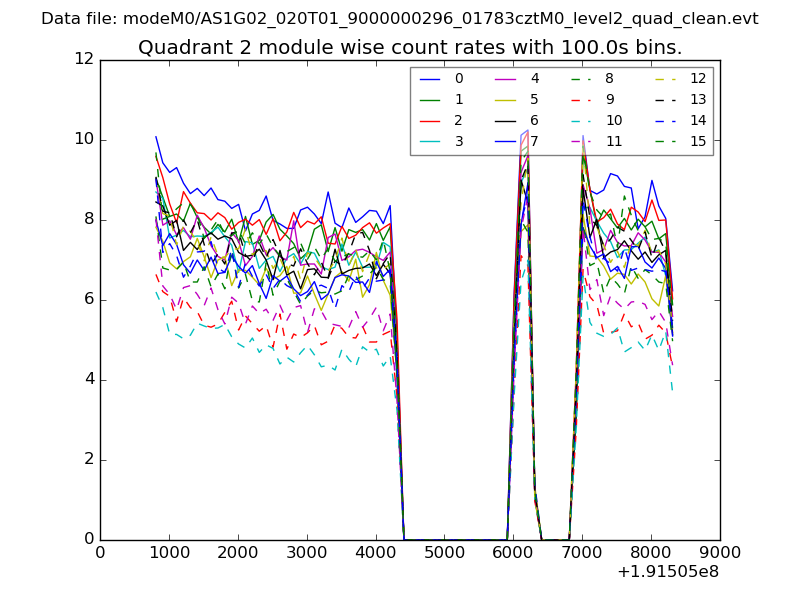
| Module-wise count rates for Quadrant B Data is divided into 100 sec bins |
 |
 |
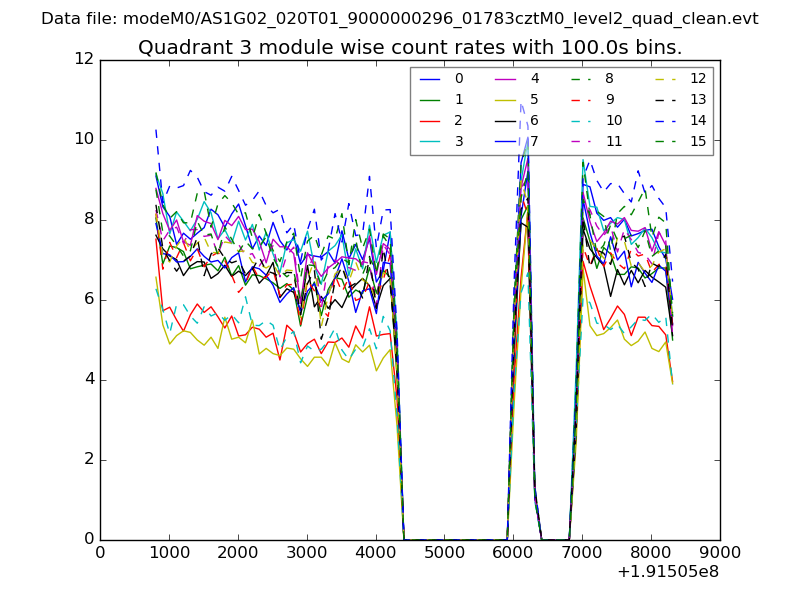
| Module-wise count rates for Quadrant C Data is divided into 100 sec bins |
 |
 |
| Module-wise count rates for Quadrant D Data is divided into 100 sec bins |
 |
 |
| Parameter | Plot |
|---|---|
| CZT HV Monitor | 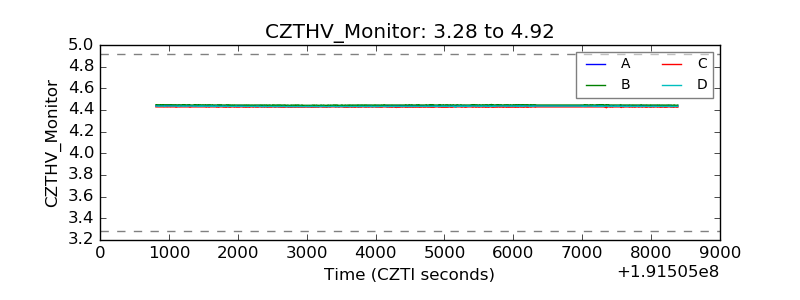 |
| D_VDD | 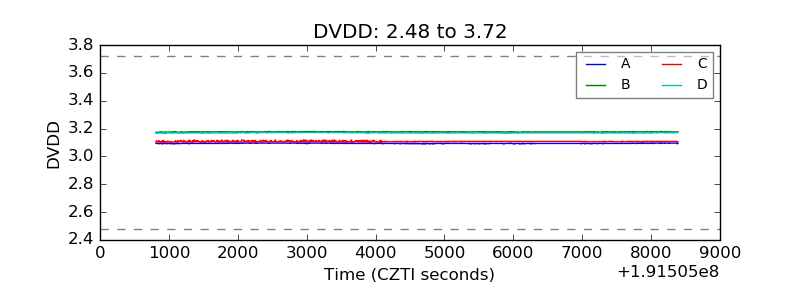 |
| Temperature 1 | 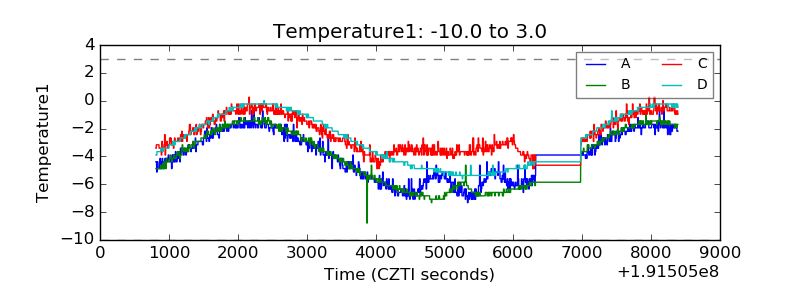 |
| Veto HV Monitor | 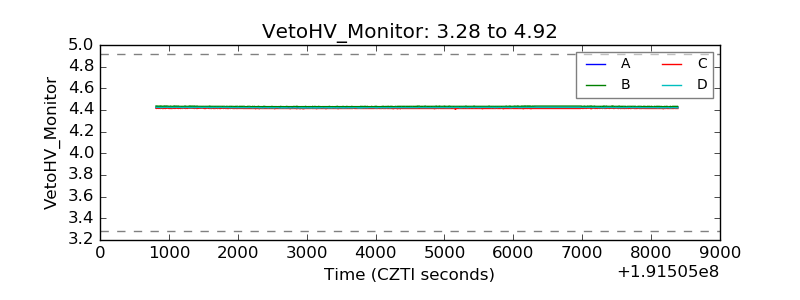 |
| Veto LLD | 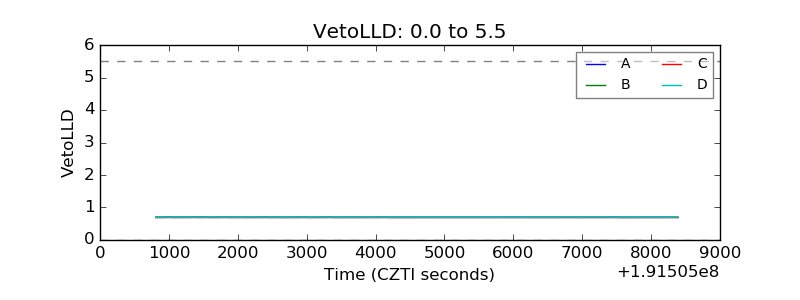 |
| Alpha Counter | 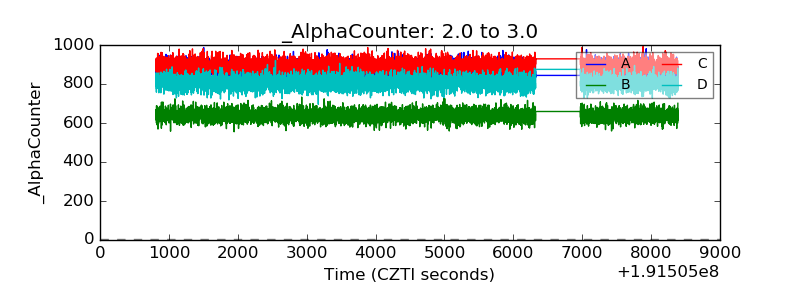 |
| _CPM_Rate | 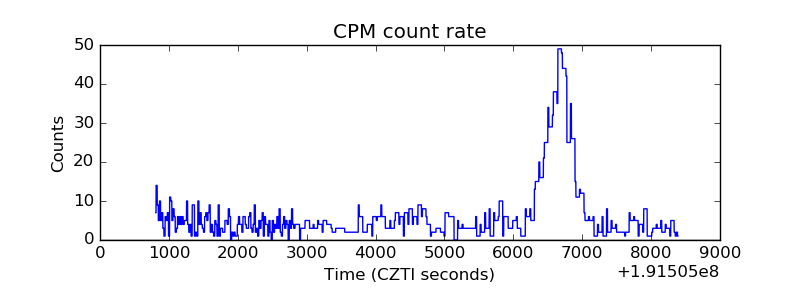 |
| CZT Counter | 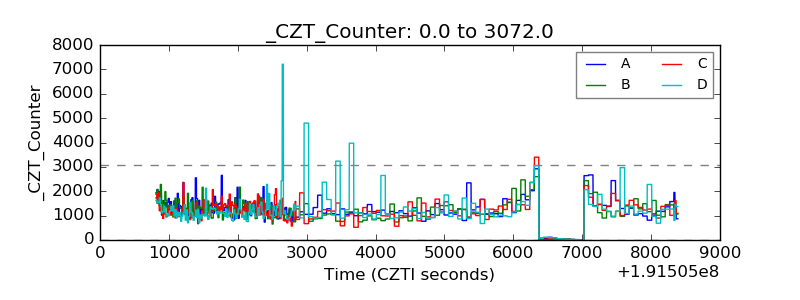 |
| +2.5 Volts monitor |  |
| +5 Volts monitor |  |
| _ROLL_ROT | 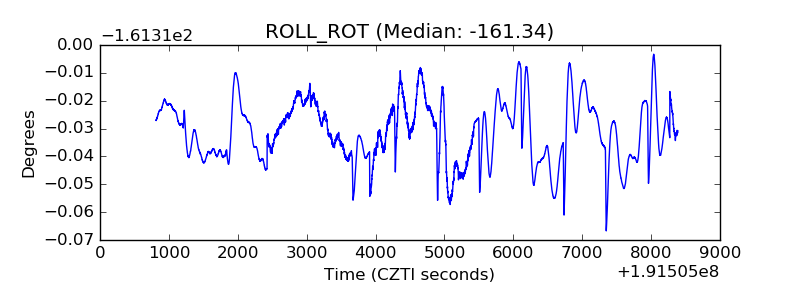 |
| _Roll_DEC | 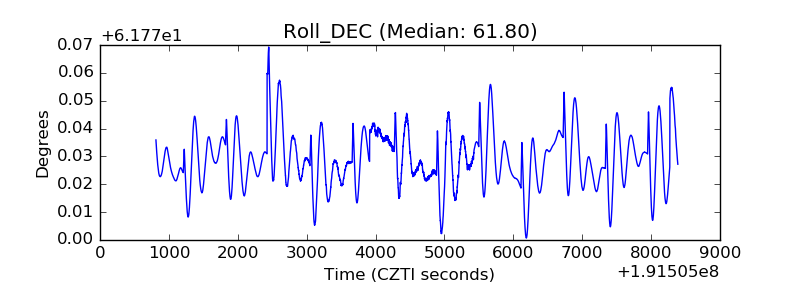 |
| _Roll_RA | 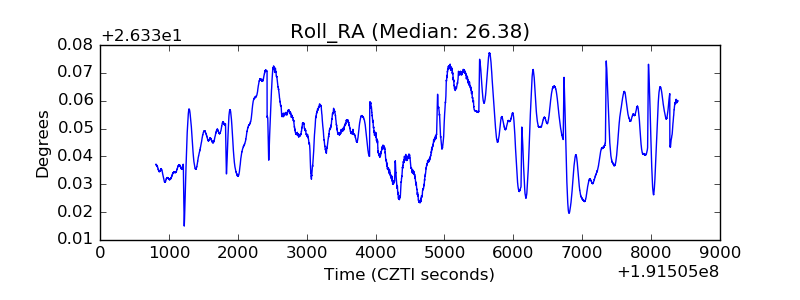 |
| Veto Counter | 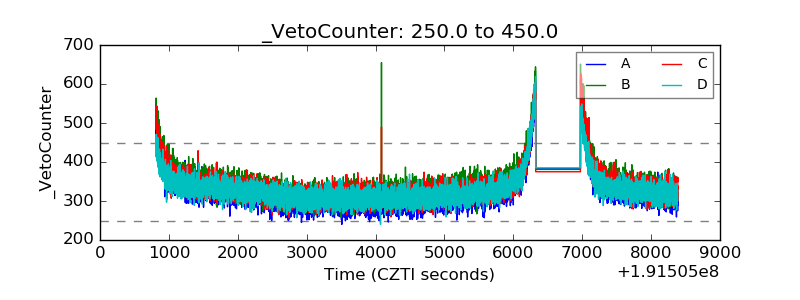 |