| Param | Original file | Final file |
|---|---|---|
| Filename | modeM0/AS1G02_020T01_9000000296_01784cztM0_level2.evt | modeM0/AS1G02_020T01_9000000296_01784cztM0_level2_quad_clean.evt |
| Size (bytes) | 1,301,198,400 | 105,886,080 |
| Size | 1.2 GB | 101.0 MB |
| Events in quadrant A | 9,921,003 | 677,746 |
| Events in quadrant B | 9,473,003 | 688,901 |
| Events in quadrant C | 10,030,832 | 661,602 |
| Events in quadrant D | 9,482,656 | 652,466 |
| Mode M9 | |||
|---|---|---|---|
| Quadrant | BADHDUFLAG | Total packets | Discarded packets |
| A | 0 | 1 | 0 |
| B | 1 | 1 | 0 |
| C | 1 | -1 | -1 |
| D | 1 | -1 | -1 |
| Mode SS | |||
|---|---|---|---|
| Quadrant | BADHDUFLAG | Total packets | Discarded packets |
| A | 0 | 150 | 0 |
| B | 0 | 150 | 0 |
| C | 0 | 150 | 0 |
| D | 0 | 150 | 0 |
| Mode M0 | |||
|---|---|---|---|
| Quadrant | BADHDUFLAG | Total packets | Discarded packets |
| A | 0 | 34867 | 2 |
| B | 0 | 33474 | 2 |
| C | 0 | 35181 | 11 |
| D | 0 | 33557 | 2 |
| Quadrant | Total seconds | Saturated seconds | Saturation percentage |
|---|---|---|---|
| A | 7567 | 8 | 0.105722% |
| B | 7567 | 4 | 0.052861% |
| C | 7565 | 37 | 0.489095% |
| D | 7567 | 113 | 1.493326% |
Noise dominated data is calculated using 1-second bins in cleaned event files. If a bin has >2000 counts, and if more than 50% of those come from <1% of pixels, then it is considered to be noise-dominated and hence unusable.
| Quadrant | # 1 sec bins | Bins with >0 counts | Bins with >2000 counts | High rate bins dominated by noise | Noise dominated (total time) | Noise dominated (detector-on time) | Marked lightcurve |
|---|---|---|---|---|---|---|---|
| A | 7927 | 7568 | 407 | 407 | 5.13% | 5.38% |  |
| B | 7927 | 7568 | 348 | 348 | 4.39% | 4.60% |  |
| C | 7927 | 7567 | 433 | 433 | 5.46% | 5.72% | 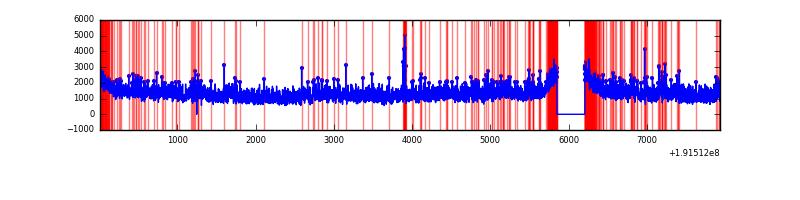 |
| D | 7926 | 7567 | 434 | 434 | 5.48% | 5.74% | 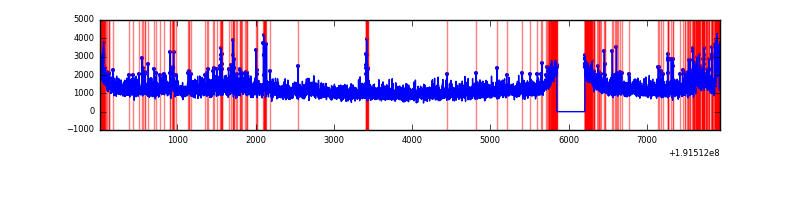 |
Top three noisy pixels from each quadrant. If the there are fewer than three noisy pixels in the level2.evt file, extra rows are filled as -1
| Pixel properties | Quadrant properties | ||||||
|---|---|---|---|---|---|---|---|
| Quadrant | DetID | PixID | Counts | Sigma | Mean | Median | Sigma |
| A | 0 | 231 | 717952 | 1231.07 | 2401 | 2416 | 581.2 |
| A | 10 | 2 | 11363 | 15.39 | 2401 | 2416 | 581.2 |
| A | 8 | 255 | 10820 | 14.46 | 2401 | 2416 | 581.2 |
| B | 0 | 220 | 56790 | 92.83 | 2473 | 2482 | 585.1 |
| B | 0 | 244 | 23549 | 36.01 | 2473 | 2482 | 585.1 |
| B | 0 | 234 | 14063 | 19.79 | 2473 | 2482 | 585.1 |
| C | 8 | 208 | 1125969 | 1786.12 | 2253 | 2337 | 629.1 |
| C | 1 | 192 | 58035 | 88.54 | 2253 | 2337 | 629.1 |
| C | 10 | 82 | 56766 | 86.52 | 2253 | 2337 | 629.1 |
| D | 7 | 85 | 604422 | 882.97 | 2202 | 2281 | 681.9 |
| D | 13 | 72 | 226742 | 329.15 | 2202 | 2281 | 681.9 |
| D | 13 | 169 | 169754 | 245.58 | 2202 | 2281 | 681.9 |
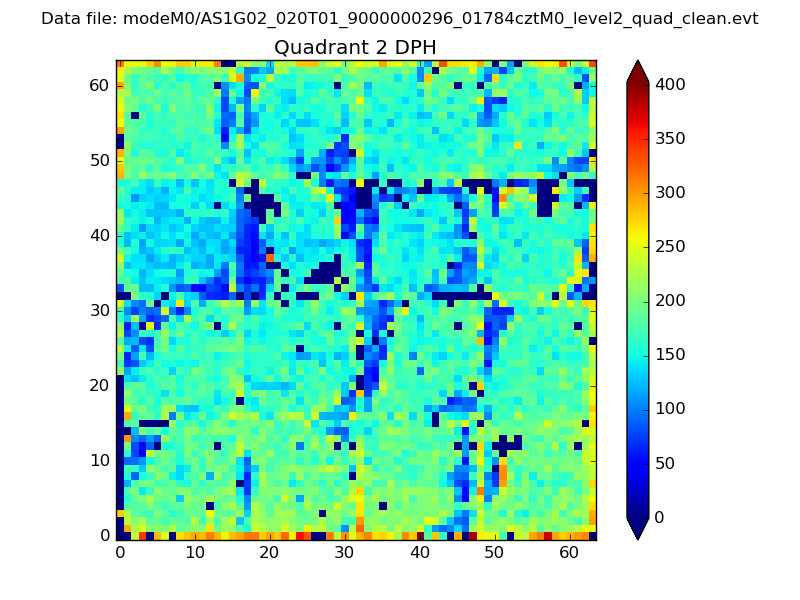
Histogram calculated using DETX and DETY for each event in the final _common_clean file
| Quadrant A | 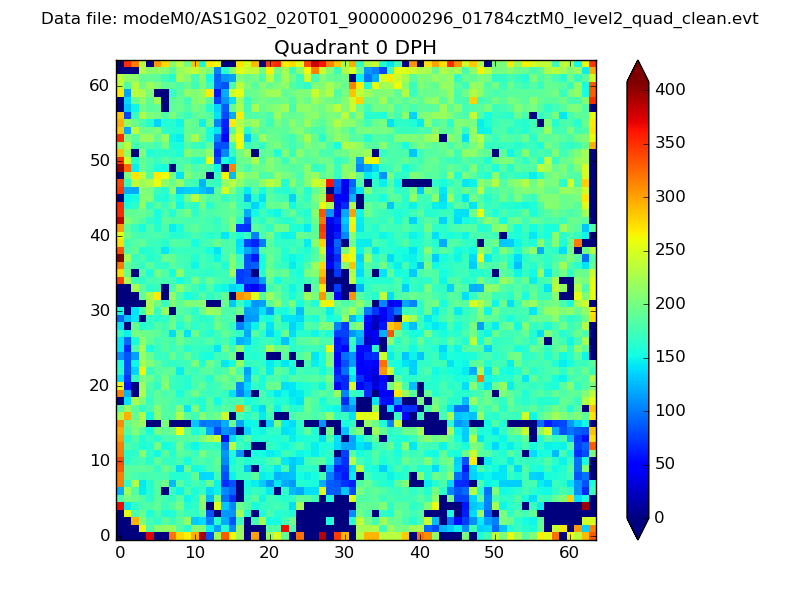 |
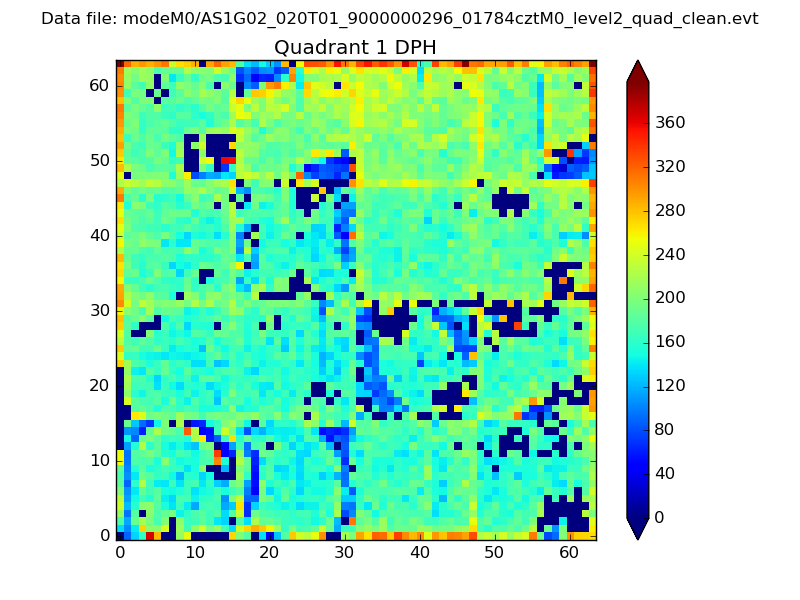 |
Quadrant B |
|---|---|---|---|
| Quadrant D | 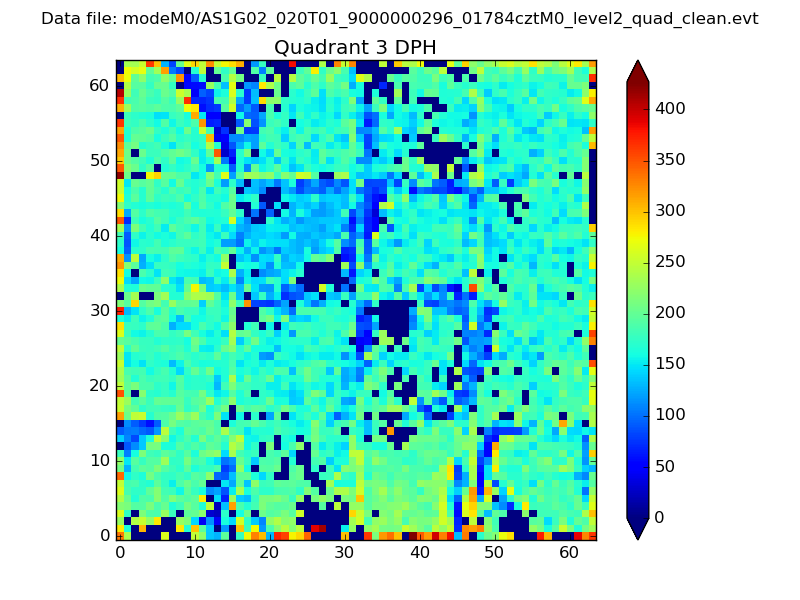 |
 |
Quadrant C |
| Plot type | Count rate plots | Images |
|---|---|---|
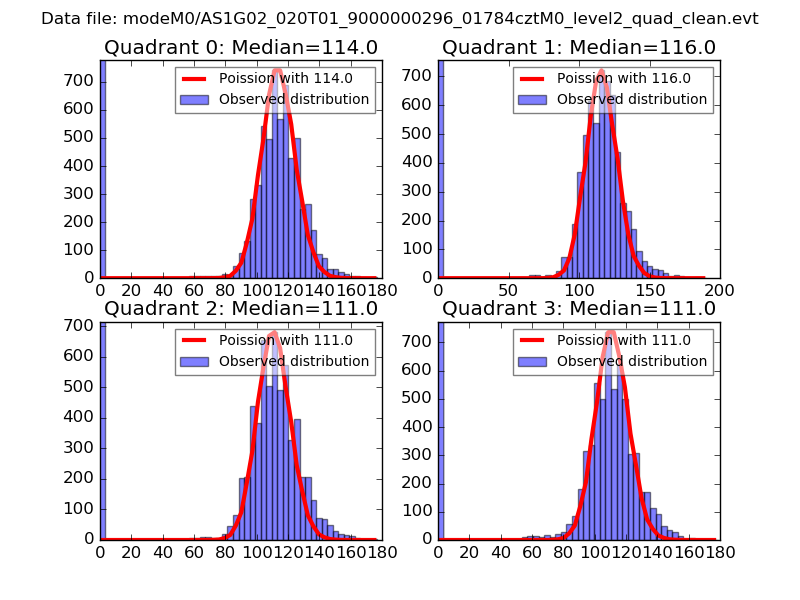
| Comparison with Poisson distribution Blue bars denote a histogram of data divided into 1 sec bins. Red curve is a Poisson curve with rate = median count rate of data. |
 |
 |
| Quadrant-wise count rates Data is divided into 100 sec bins |
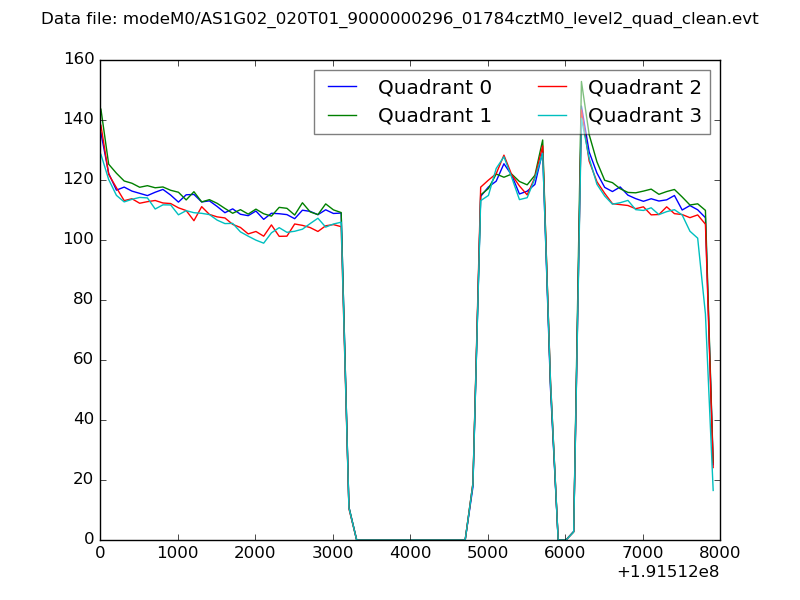 |
|
| Module-wise count rates for Quadrant A Data is divided into 100 sec bins |
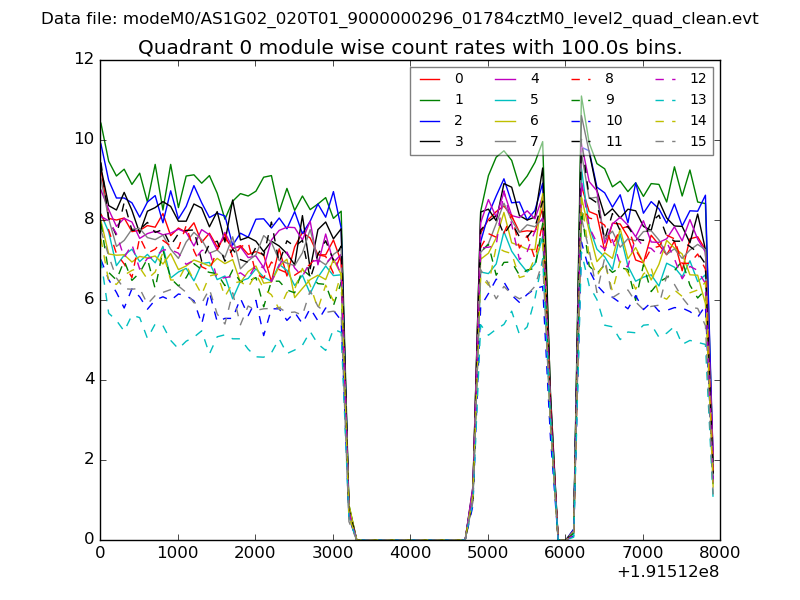 |
 |
| Module-wise count rates for Quadrant B Data is divided into 100 sec bins |
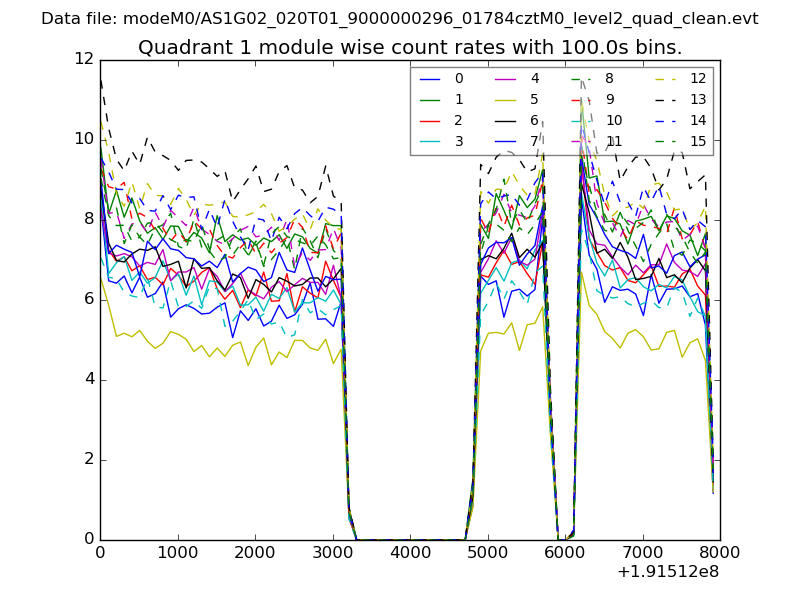 |
 |
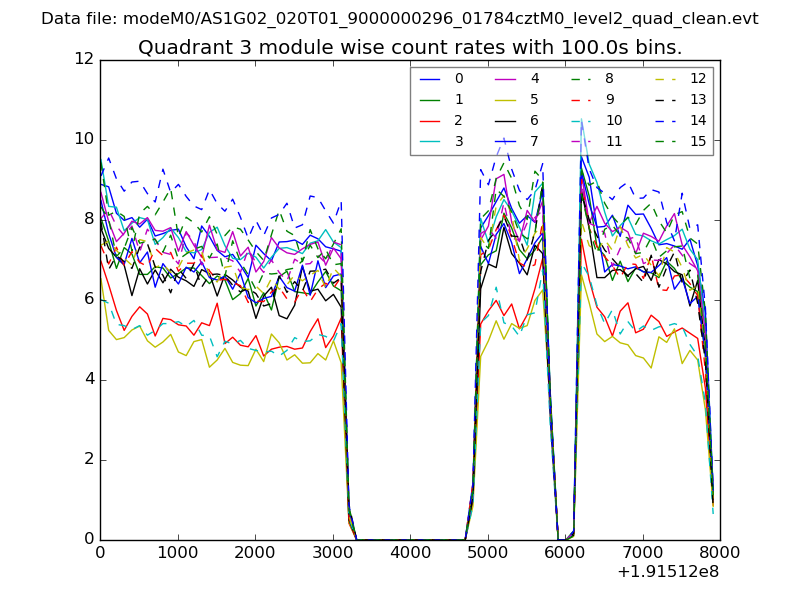
| Module-wise count rates for Quadrant C Data is divided into 100 sec bins |
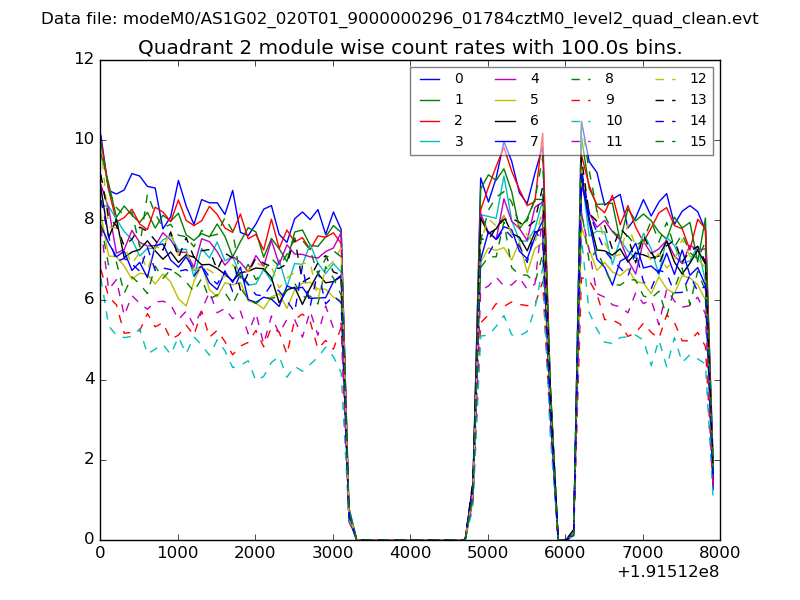 |
 |
| Module-wise count rates for Quadrant D Data is divided into 100 sec bins |
 |
 |
| Parameter | Plot |
|---|---|
| CZT HV Monitor | 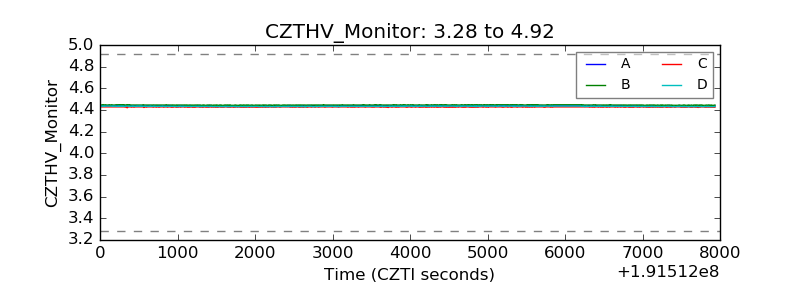 |
| D_VDD | 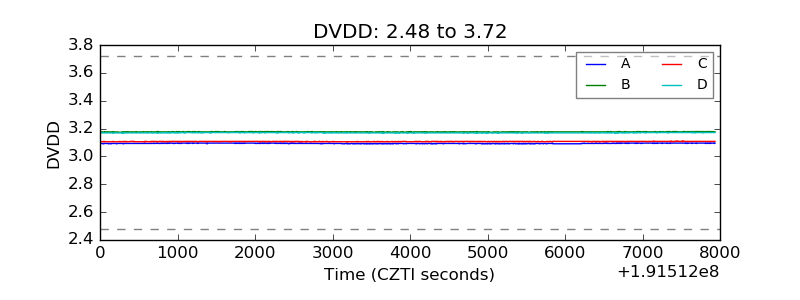 |
| Temperature 1 | 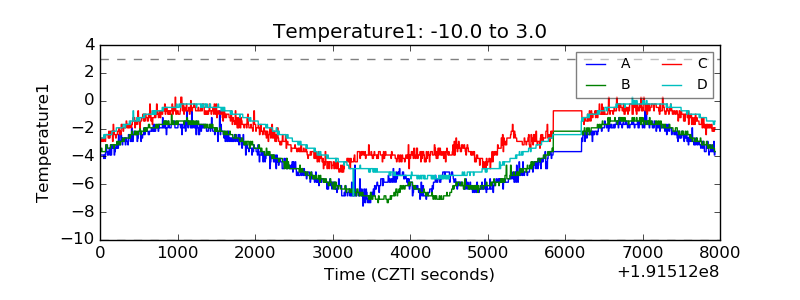 |
| Veto HV Monitor | 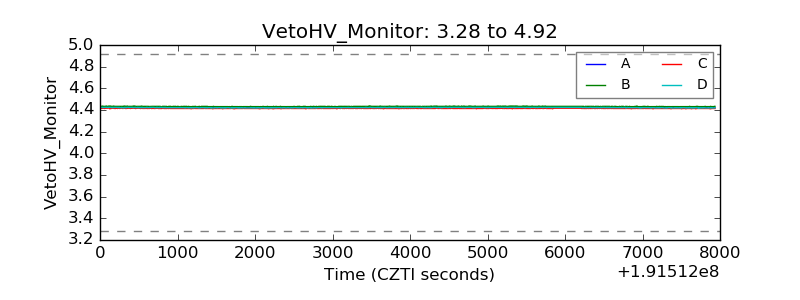 |
| Veto LLD | 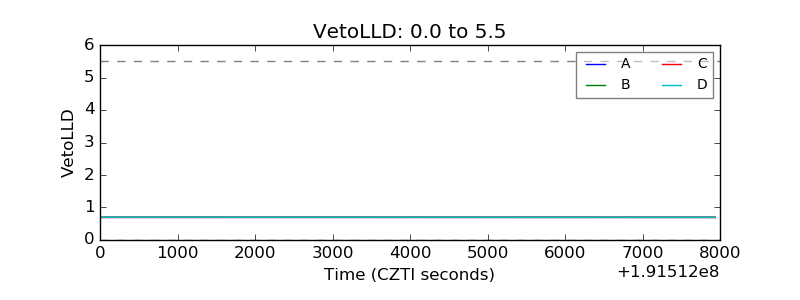 |
| Alpha Counter | 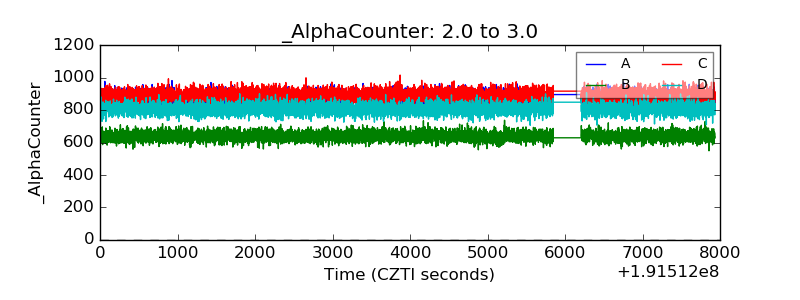 |
| _CPM_Rate | 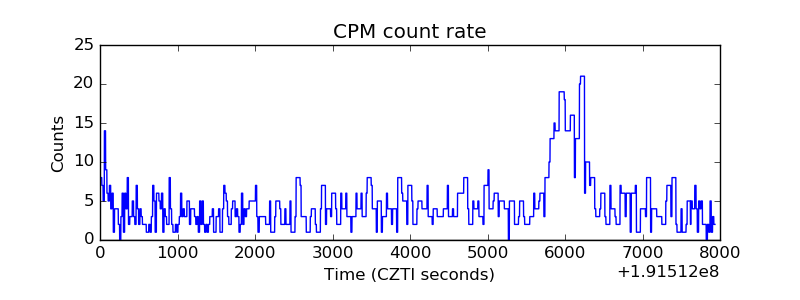 |
| CZT Counter | 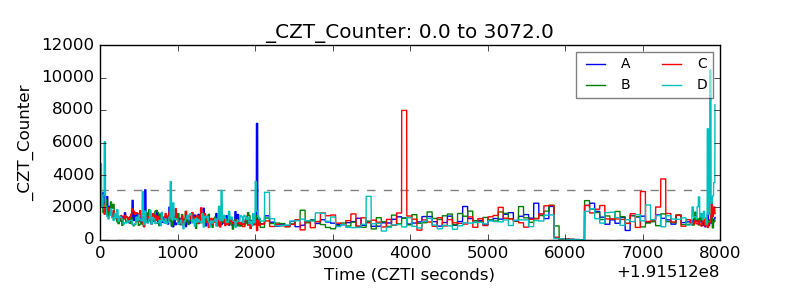 |
| +2.5 Volts monitor |  |
| +5 Volts monitor | 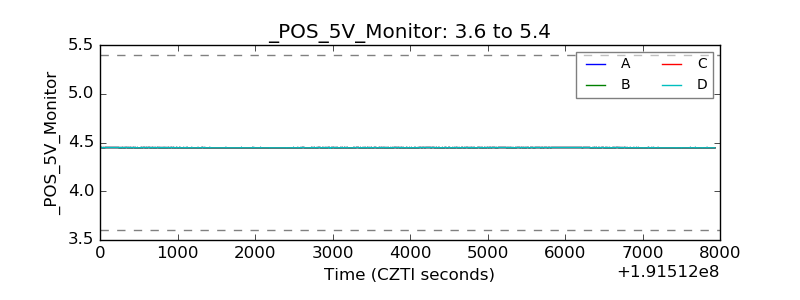 |
| _ROLL_ROT | 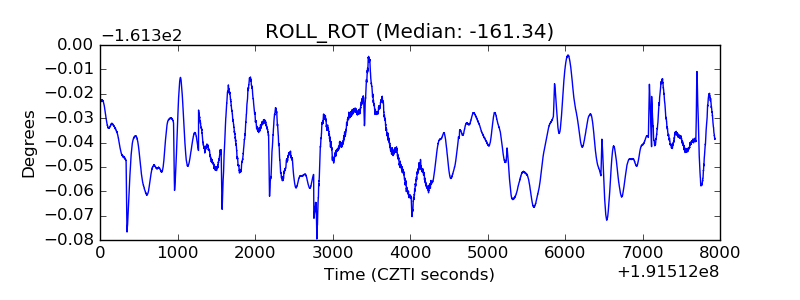 |
| _Roll_DEC | 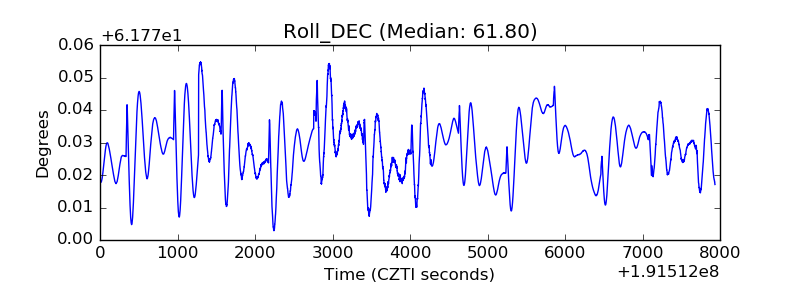 |
| _Roll_RA | 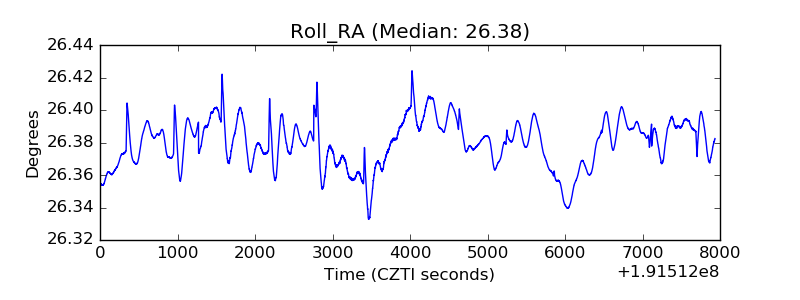 |
| Veto Counter | 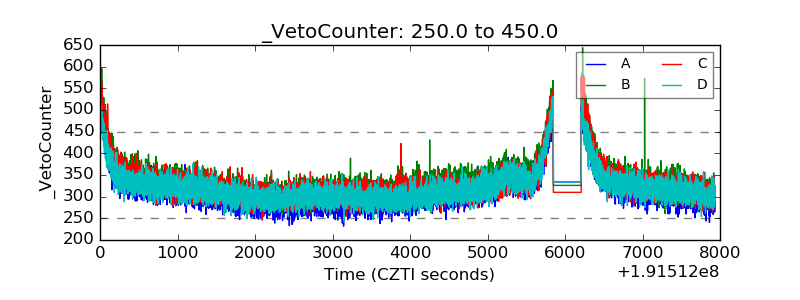 |