| Param | Original file | Final file |
|---|---|---|
| Filename | modeM0/AS1G02_020T01_9000000296_01785cztM0_level2.evt | modeM0/AS1G02_020T01_9000000296_01785cztM0_level2_quad_clean.evt |
| Size (bytes) | 1,159,715,520 | 95,051,520 |
| Size | 1.1 GB | 90.6 MB |
| Events in quadrant A | 8,814,691 | 606,369 |
| Events in quadrant B | 8,632,252 | 615,864 |
| Events in quadrant C | 8,230,541 | 596,496 |
| Events in quadrant D | 8,983,084 | 574,139 |
| Mode M9 | |||
|---|---|---|---|
| Quadrant | BADHDUFLAG | Total packets | Discarded packets |
| A | 0 | 1 | 0 |
| B | 1 | 1 | 0 |
| C | 1 | -1 | -1 |
| D | 1 | -1 | -1 |
| Mode SS | |||
|---|---|---|---|
| Quadrant | BADHDUFLAG | Total packets | Discarded packets |
| A | 0 | 140 | 0 |
| B | 0 | 140 | 0 |
| C | 0 | 140 | 0 |
| D | 0 | 140 | 0 |
| Mode M0 | |||
|---|---|---|---|
| Quadrant | BADHDUFLAG | Total packets | Discarded packets |
| A | 0 | 31146 | 2 |
| B | 0 | 30587 | 2 |
| C | 0 | 29401 | 2 |
| D | 0 | 31668 | 9 |
| Quadrant | Total seconds | Saturated seconds | Saturation percentage |
|---|---|---|---|
| A | 6971 | 8 | 0.114761% |
| B | 6971 | 15 | 0.215177% |
| C | 6971 | 12 | 0.172142% |
| D | 6969 | 234 | 3.357727% |
Noise dominated data is calculated using 1-second bins in cleaned event files. If a bin has >2000 counts, and if more than 50% of those come from <1% of pixels, then it is considered to be noise-dominated and hence unusable.
| Quadrant | # 1 sec bins | Bins with >0 counts | Bins with >2000 counts | High rate bins dominated by noise | Noise dominated (total time) | Noise dominated (detector-on time) | Marked lightcurve |
|---|---|---|---|---|---|---|---|
| A | 7211 | 6973 | 292 | 292 | 4.05% | 4.19% |  |
| B | 7211 | 6973 | 265 | 265 | 3.67% | 3.80% |  |
| C | 7211 | 6973 | 217 | 217 | 3.01% | 3.11% | 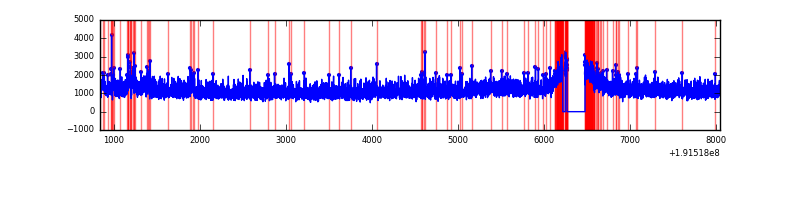 |
| D | 7211 | 6972 | 605 | 605 | 8.39% | 8.68% |  |
Top three noisy pixels from each quadrant. If the there are fewer than three noisy pixels in the level2.evt file, extra rows are filled as -1
| Pixel properties | Quadrant properties | ||||||
|---|---|---|---|---|---|---|---|
| Quadrant | DetID | PixID | Counts | Sigma | Mean | Median | Sigma |
| A | 0 | 231 | 486911 | 928.33 | 2171 | 2186 | 522.1 |
| A | 10 | 2 | 13123 | 20.95 | 2171 | 2186 | 522.1 |
| A | 15 | 233 | 8421 | 11.94 | 2171 | 2186 | 522.1 |
| B | 0 | 220 | 85887 | 156.63 | 2253 | 2262 | 533.9 |
| B | 0 | 234 | 9550 | 13.65 | 2253 | 2262 | 533.9 |
| B | 4 | 200 | 8165 | 11.06 | 2253 | 2262 | 533.9 |
| C | 8 | 208 | 154076 | 264.21 | 2058 | 2136 | 575.1 |
| C | 10 | 82 | 35765 | 58.48 | 2058 | 2136 | 575.1 |
| C | 14 | 48 | 9131 | 12.16 | 2058 | 2136 | 575.1 |
| D | 13 | 72 | 566421 | 912.74 | 1993 | 2058 | 618.3 |
| D | 7 | 85 | 519560 | 836.95 | 1993 | 2058 | 618.3 |
| D | 13 | 169 | 179634 | 287.19 | 1993 | 2058 | 618.3 |
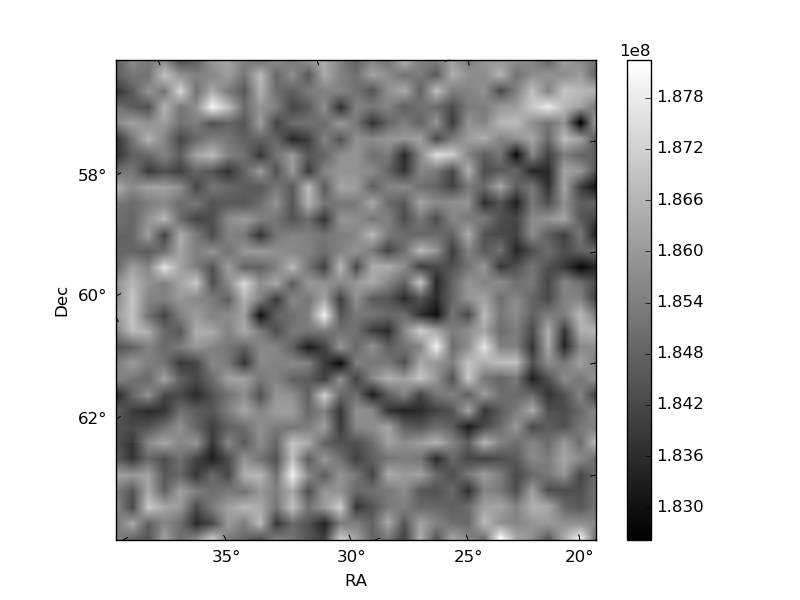
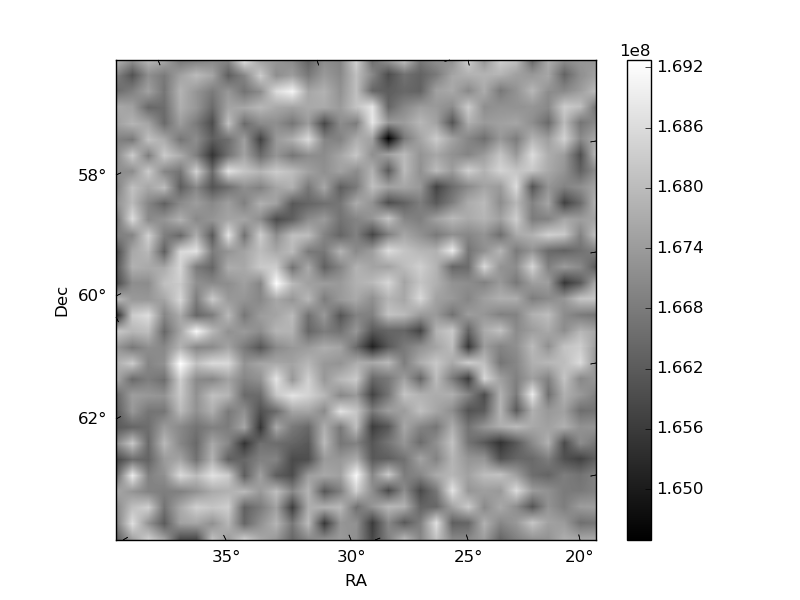
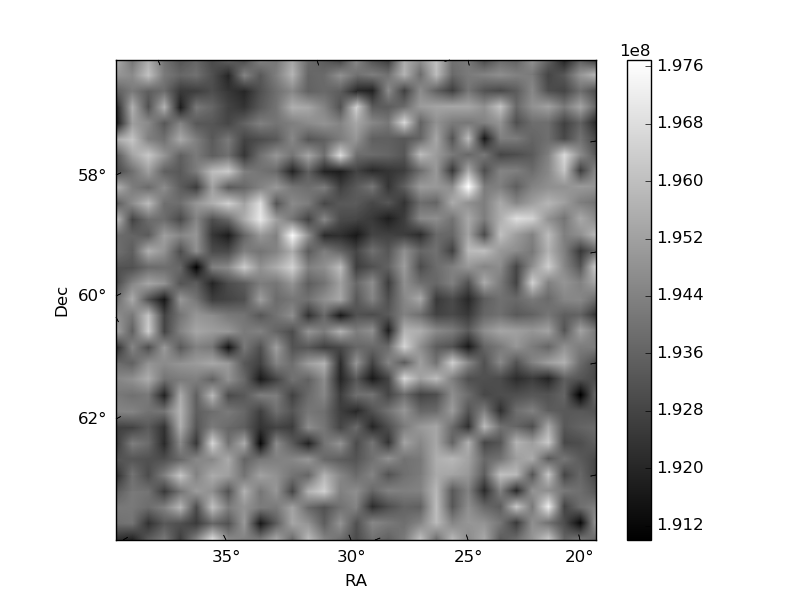
Histogram calculated using DETX and DETY for each event in the final _common_clean file
| Quadrant A | 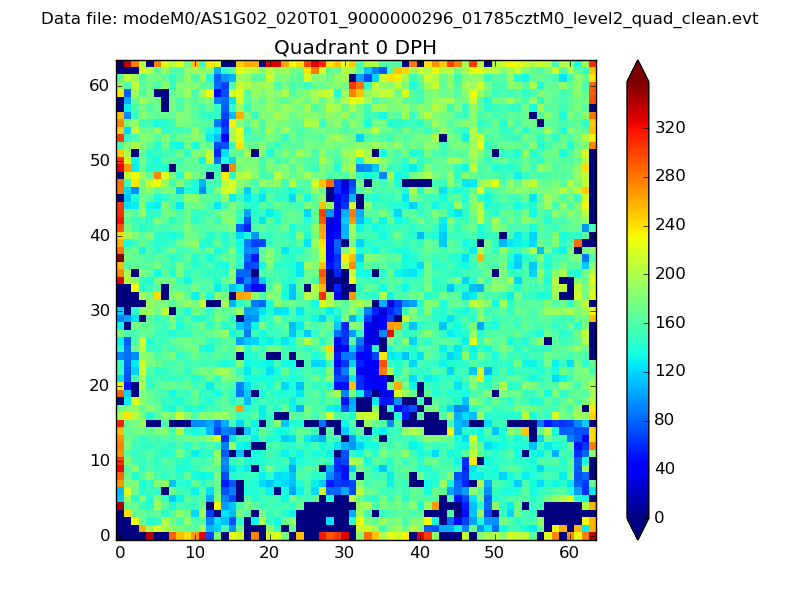 |
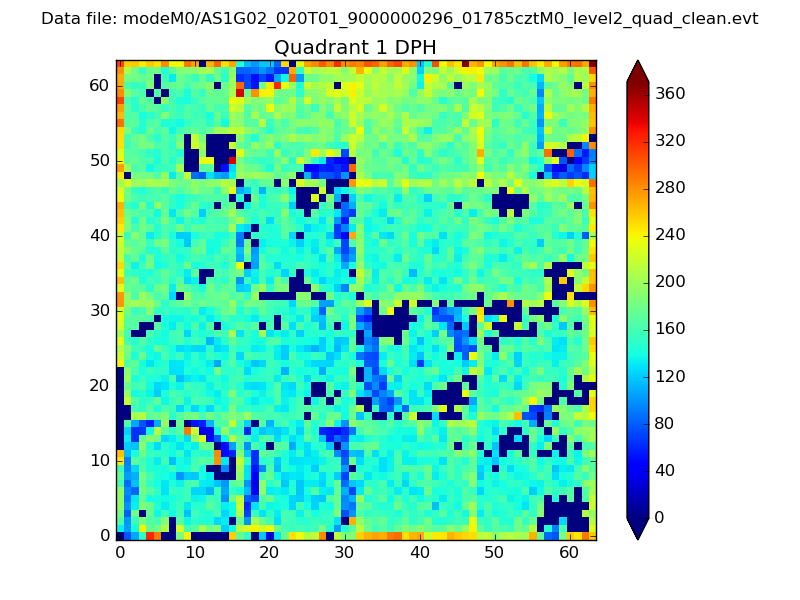 |
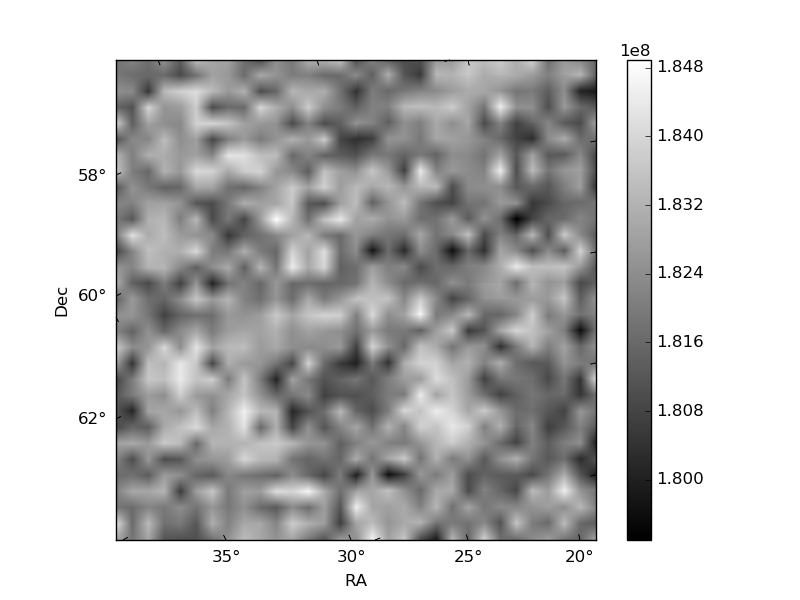
Quadrant B |
|---|---|---|---|
| Quadrant D | 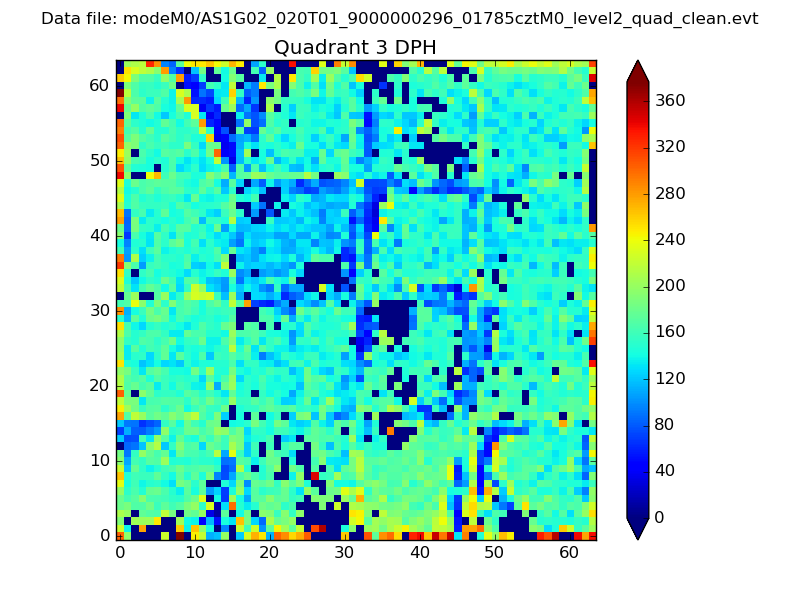 |
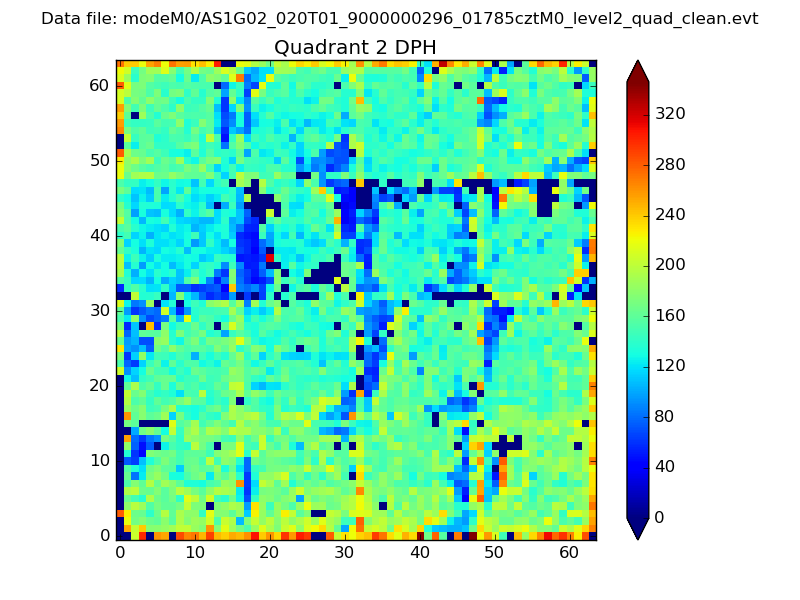 |
Quadrant C |
| Plot type | Count rate plots | Images |
|---|---|---|
| Comparison with Poisson distribution Blue bars denote a histogram of data divided into 1 sec bins. Red curve is a Poisson curve with rate = median count rate of data. |
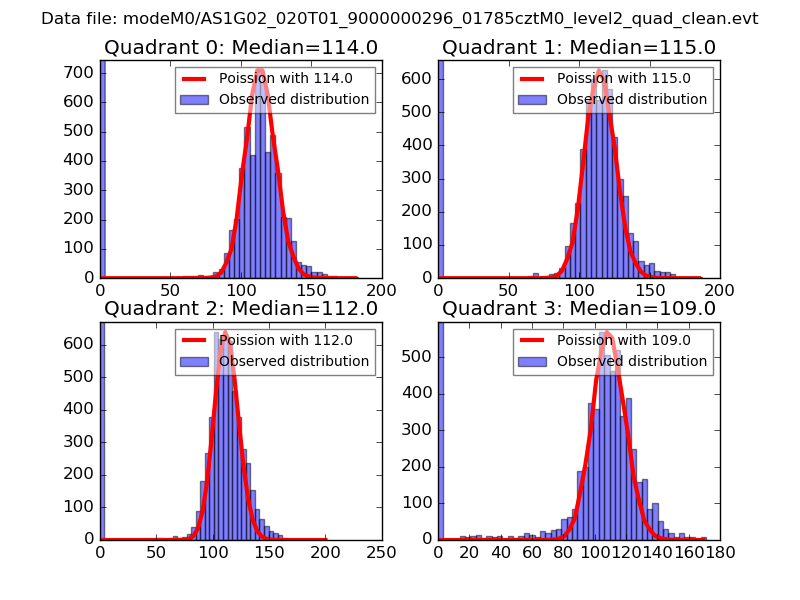 |
 |
| Quadrant-wise count rates Data is divided into 100 sec bins |
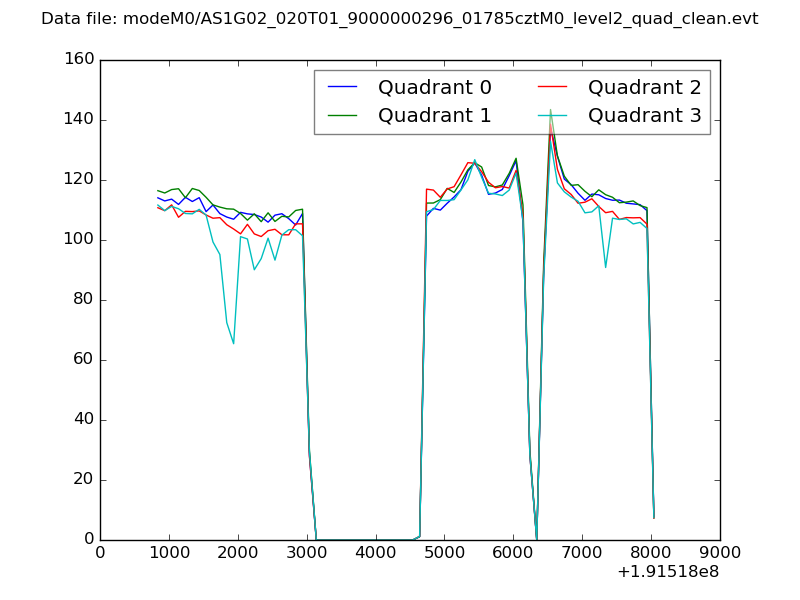 |
|
| Module-wise count rates for Quadrant A Data is divided into 100 sec bins |
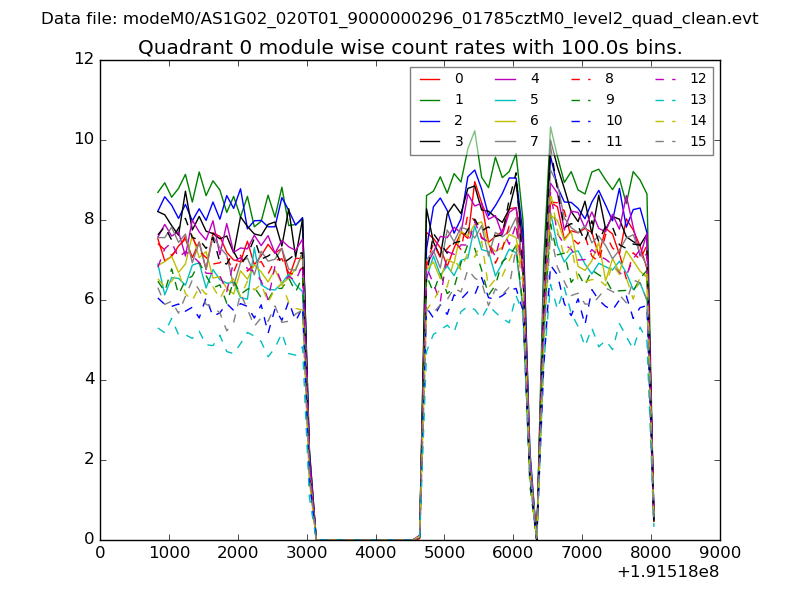 |
 |
| Module-wise count rates for Quadrant B Data is divided into 100 sec bins |
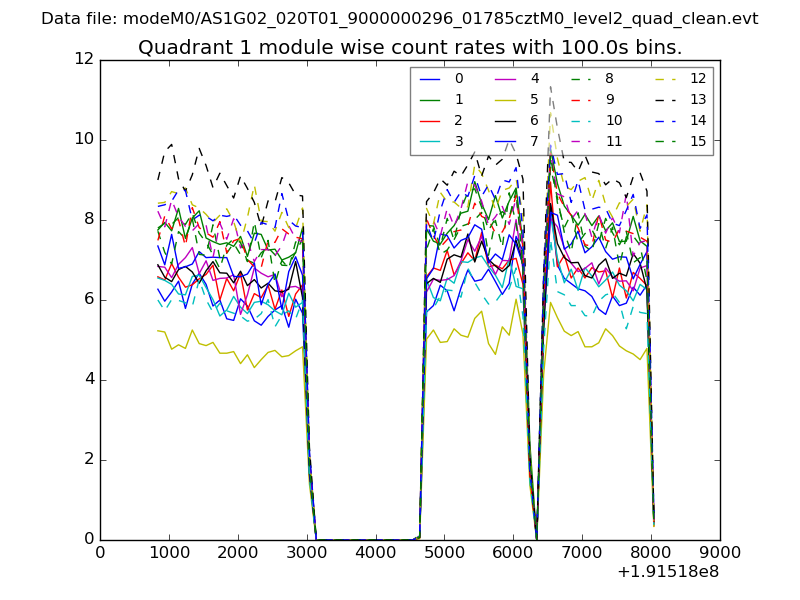 |
 |
| Module-wise count rates for Quadrant C Data is divided into 100 sec bins |
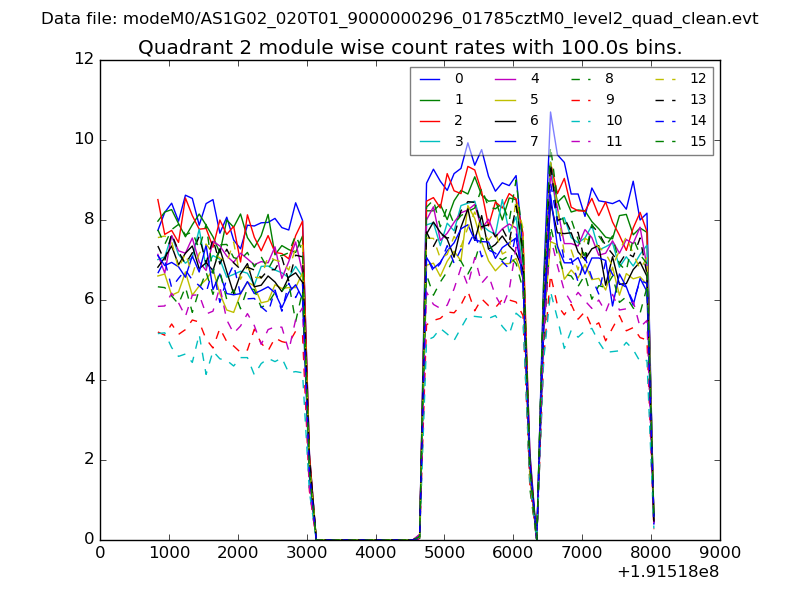 |
 |
| Module-wise count rates for Quadrant D Data is divided into 100 sec bins |
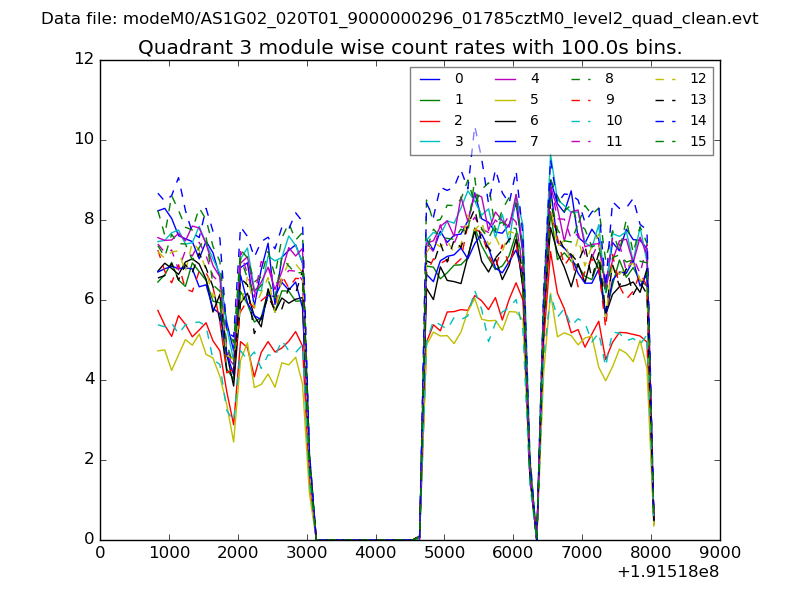 |
 |
| Parameter | Plot |
|---|---|
| CZT HV Monitor | 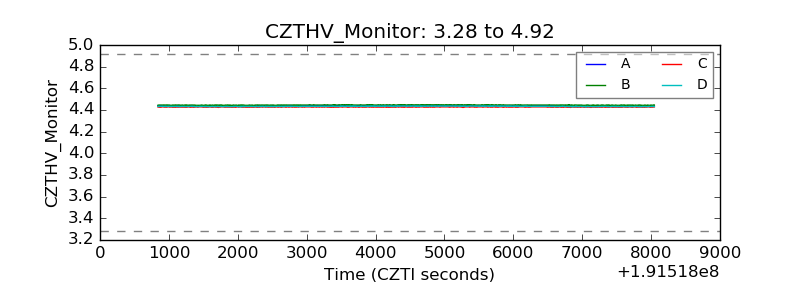 |
| D_VDD | 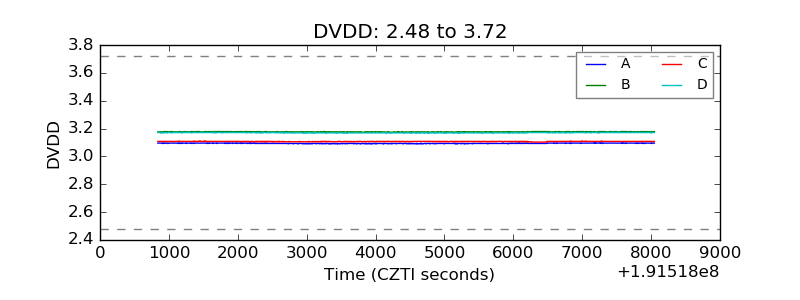 |
| Temperature 1 | 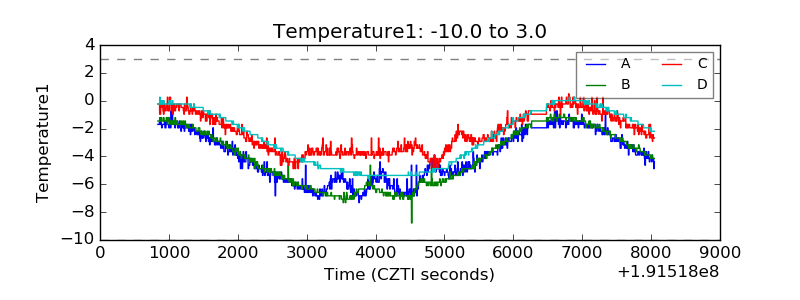 |
| Veto HV Monitor | 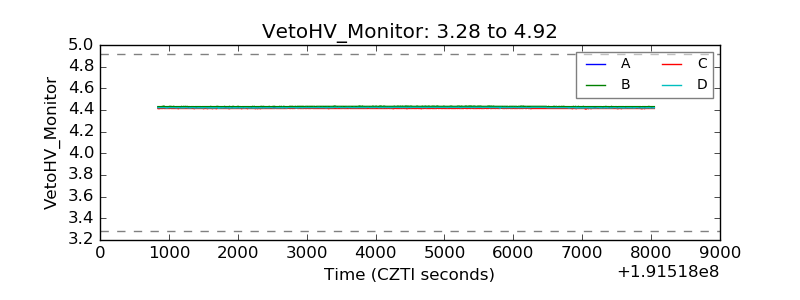 |
| Veto LLD | 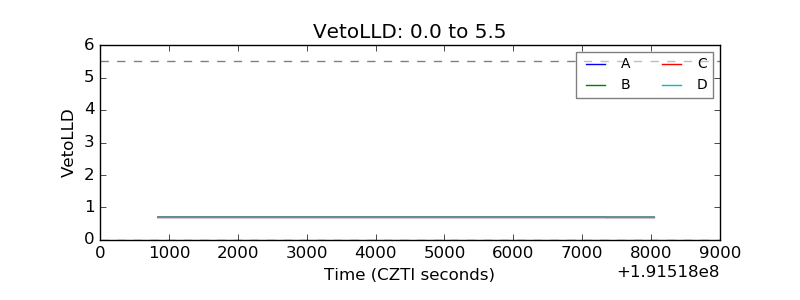 |
| Alpha Counter | 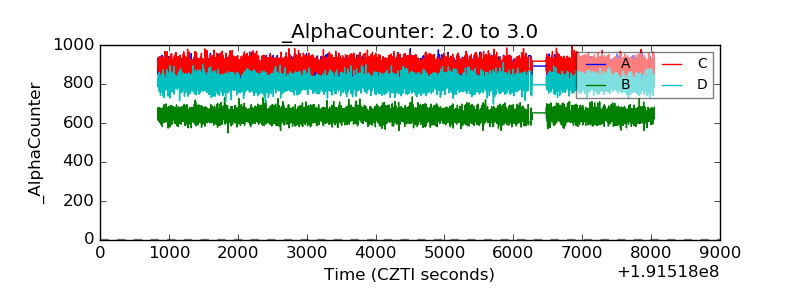 |
| _CPM_Rate | 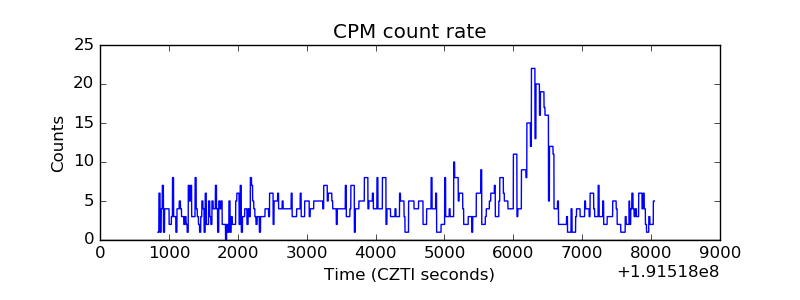 |
| CZT Counter | 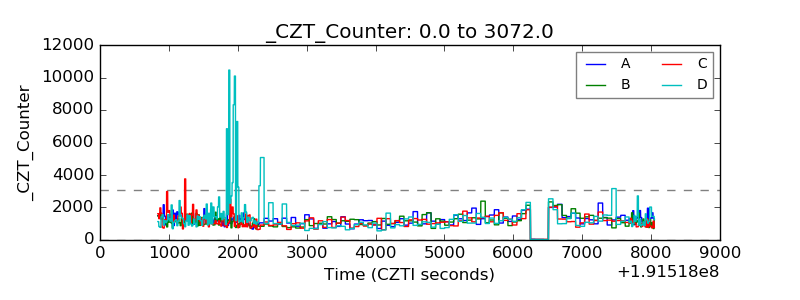 |
| +2.5 Volts monitor | 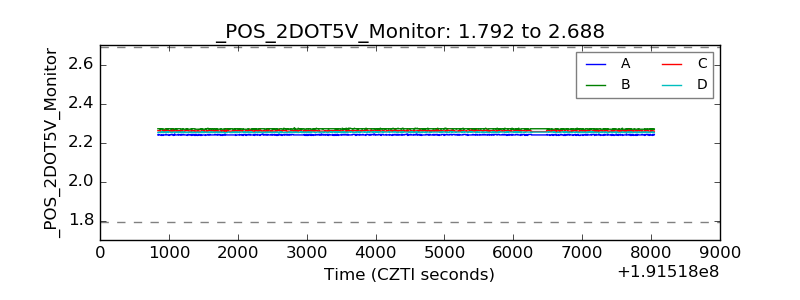 |
| +5 Volts monitor |  |
| _ROLL_ROT | 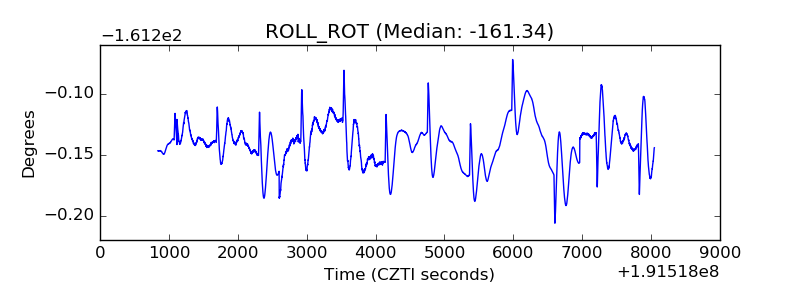 |
| _Roll_DEC | 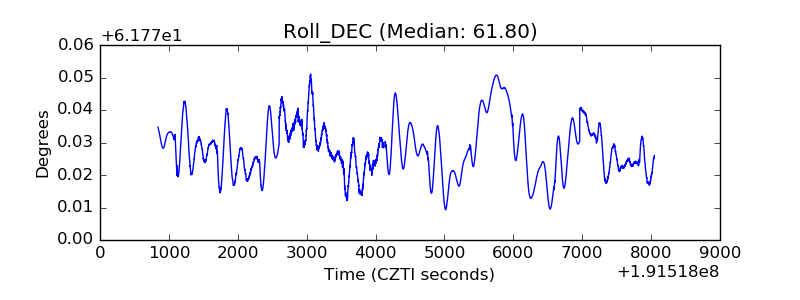 |
| _Roll_RA | 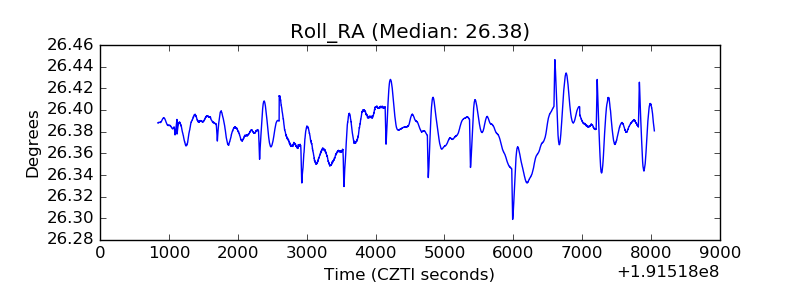 |
| Veto Counter | 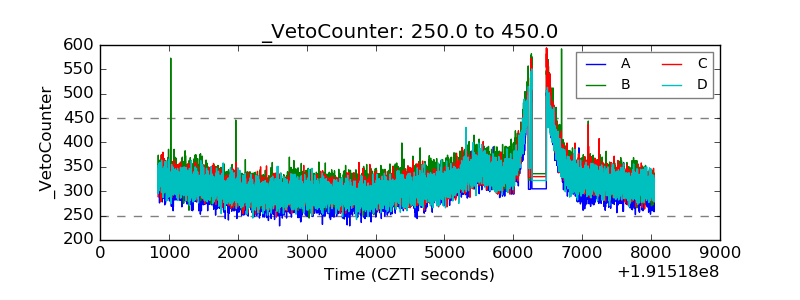 |