| Param | Original file | Final file |
|---|---|---|
| Filename | modeM0/AS1G02_020T01_9000000296_01786cztM0_level2.evt | modeM0/AS1G02_020T01_9000000296_01786cztM0_level2_quad_clean.evt |
| Size (bytes) | 1,157,780,160 | 97,096,320 |
| Size | 1.1 GB | 92.6 MB |
| Events in quadrant A | 8,809,883 | 618,054 |
| Events in quadrant B | 8,696,213 | 628,510 |
| Events in quadrant C | 8,193,296 | 607,368 |
| Events in quadrant D | 8,895,171 | 593,499 |
| Mode M9 | |||
|---|---|---|---|
| Quadrant | BADHDUFLAG | Total packets | Discarded packets |
| A | 0 | 1 | 0 |
| B | 1 | 1 | 0 |
| C | 1 | -1 | -1 |
| D | 1 | -1 | -1 |
| Mode SS | |||
|---|---|---|---|
| Quadrant | BADHDUFLAG | Total packets | Discarded packets |
| A | 0 | 144 | 0 |
| B | 0 | 144 | 0 |
| C | 0 | 144 | 0 |
| D | 0 | 144 | 0 |
| Mode M0 | |||
|---|---|---|---|
| Quadrant | BADHDUFLAG | Total packets | Discarded packets |
| A | 0 | 31236 | 10 |
| B | 0 | 30856 | 1 |
| C | 0 | 29287 | 1 |
| D | 0 | 31514 | 10 |
| Quadrant | Total seconds | Saturated seconds | Saturation percentage |
|---|---|---|---|
| A | 7071 | 4 | 0.056569% |
| B | 7073 | 5 | 0.070691% |
| C | 7073 | 5 | 0.070691% |
| D | 7071 | 147 | 2.078914% |
Noise dominated data is calculated using 1-second bins in cleaned event files. If a bin has >2000 counts, and if more than 50% of those come from <1% of pixels, then it is considered to be noise-dominated and hence unusable.
| Quadrant | # 1 sec bins | Bins with >0 counts | Bins with >2000 counts | High rate bins dominated by noise | Noise dominated (total time) | Noise dominated (detector-on time) | Marked lightcurve |
|---|---|---|---|---|---|---|---|
| A | 7448 | 7073 | 248 | 248 | 3.33% | 3.51% | 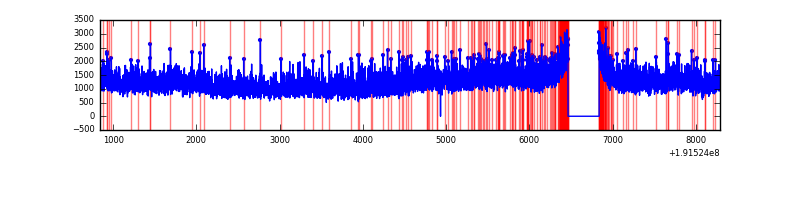 |
| B | 7448 | 7074 | 216 | 216 | 2.90% | 3.05% | 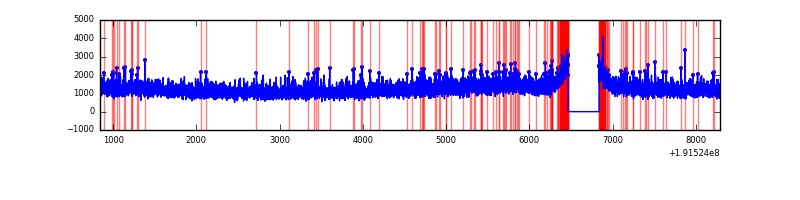 |
| C | 7448 | 7074 | 166 | 166 | 2.23% | 2.35% | 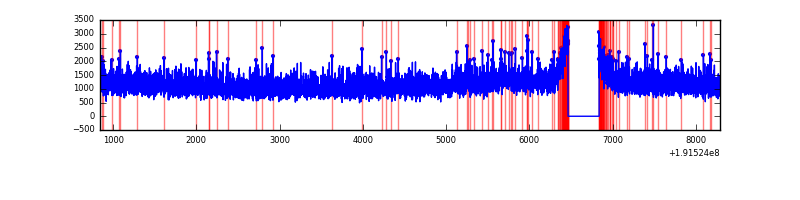 |
| D | 7448 | 7073 | 488 | 488 | 6.55% | 6.90% | 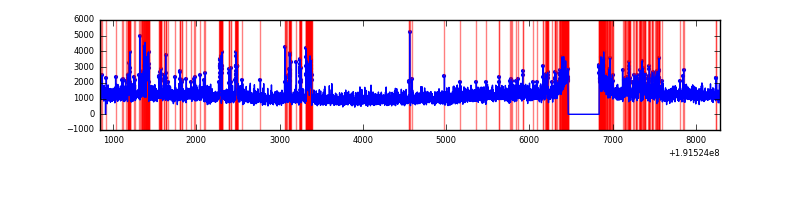 |
Top three noisy pixels from each quadrant. If the there are fewer than three noisy pixels in the level2.evt file, extra rows are filled as -1
| Pixel properties | Quadrant properties | ||||||
|---|---|---|---|---|---|---|---|
| Quadrant | DetID | PixID | Counts | Sigma | Mean | Median | Sigma |
| A | 0 | 231 | 440778 | 838.09 | 2180 | 2192 | 523.3 |
| A | 13 | 9 | 16247 | 26.86 | 2180 | 2192 | 523.3 |
| A | 10 | 2 | 13241 | 21.11 | 2180 | 2192 | 523.3 |
| B | 0 | 220 | 69616 | 125.93 | 2275 | 2281 | 534.7 |
| B | 15 | 85 | 10163 | 14.74 | 2275 | 2281 | 534.7 |
| B | 4 | 52 | 6596 | 8.07 | 2275 | 2281 | 534.7 |
| C | 15 | 246 | 23068 | 35.94 | 2088 | 2168 | 581.5 |
| C | 10 | 82 | 13409 | 19.33 | 2088 | 2168 | 581.5 |
| C | 14 | 48 | 8865 | 11.52 | 2088 | 2168 | 581.5 |
| D | 7 | 85 | 369354 | 585.42 | 2023 | 2093 | 627.3 |
| D | 13 | 169 | 250882 | 396.57 | 2023 | 2093 | 627.3 |
| D | 7 | 204 | 228153 | 360.34 | 2023 | 2093 | 627.3 |
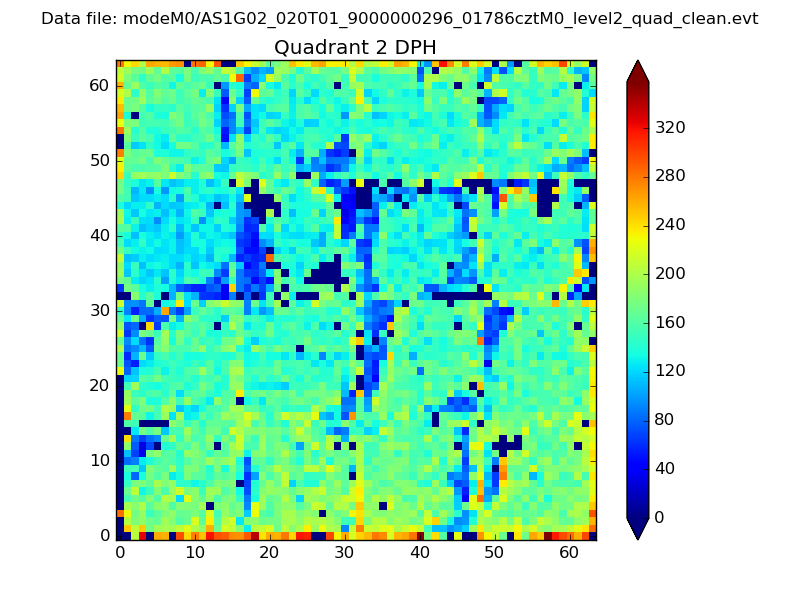
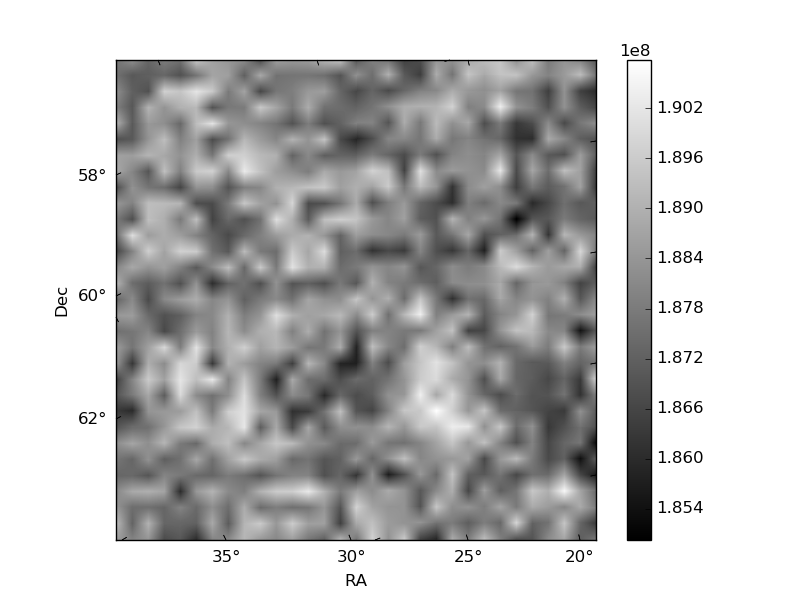
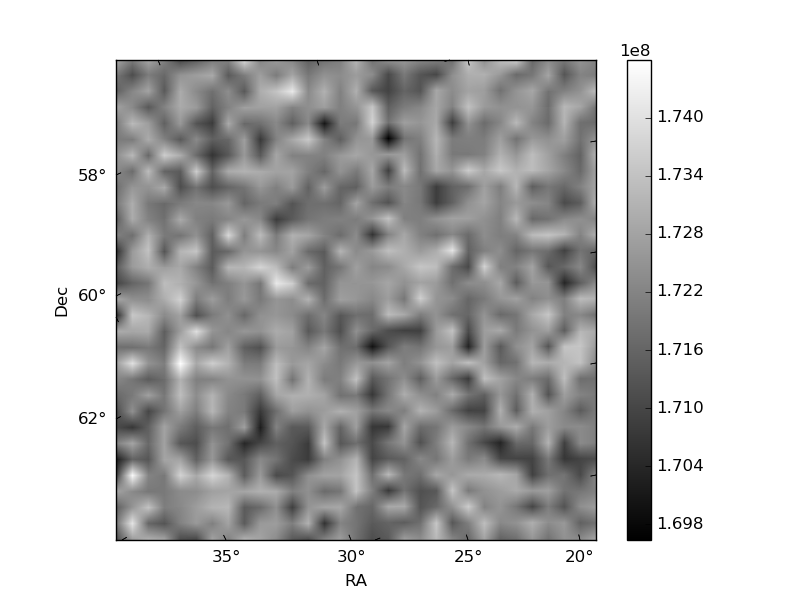
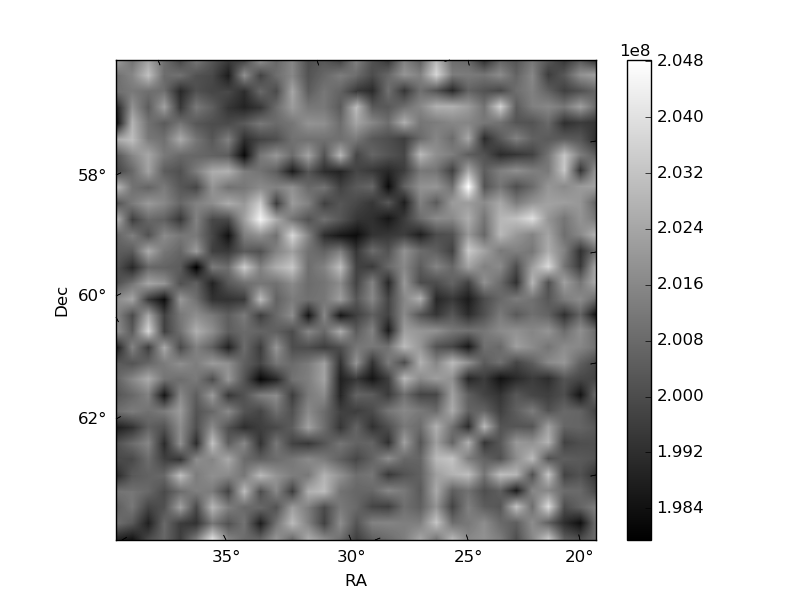
Histogram calculated using DETX and DETY for each event in the final _common_clean file
| Quadrant A | 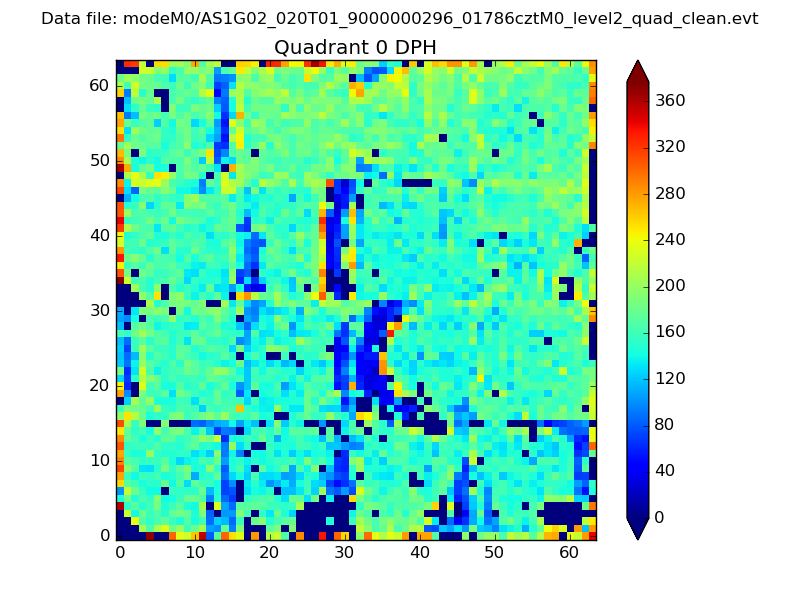 |
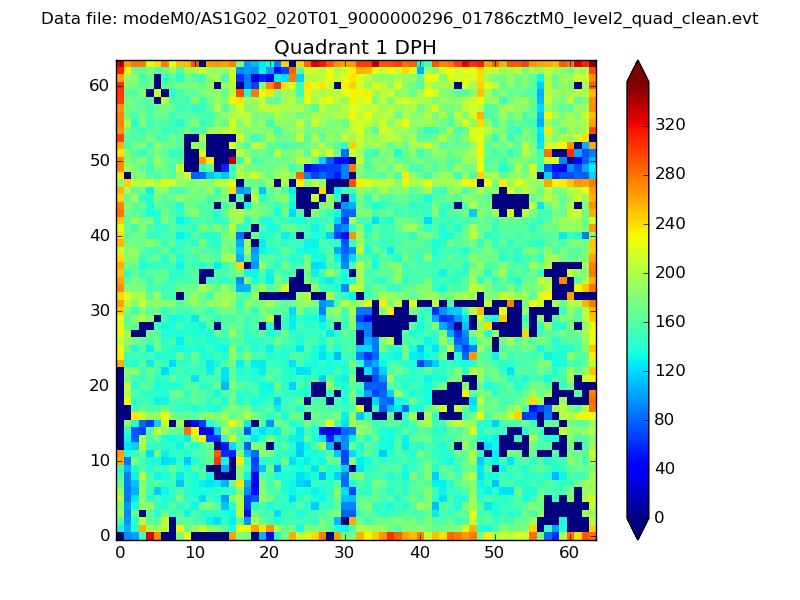 |
Quadrant B |
|---|---|---|---|
| Quadrant D | 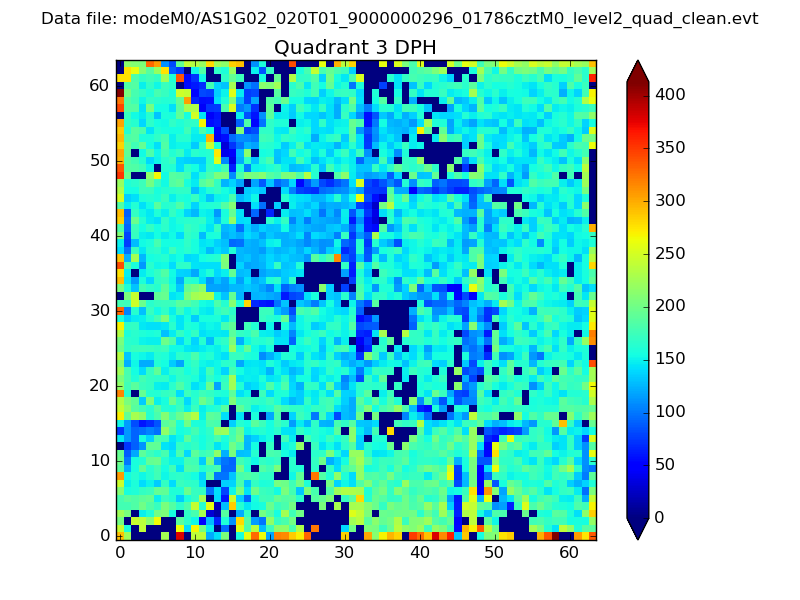 |
 |
Quadrant C |
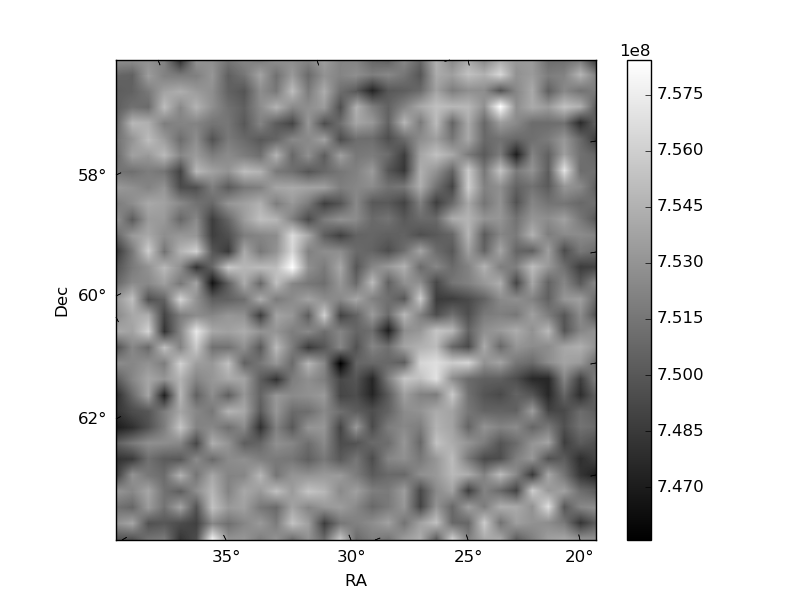
| Plot type | Count rate plots | Images |
|---|---|---|
| Comparison with Poisson distribution Blue bars denote a histogram of data divided into 1 sec bins. Red curve is a Poisson curve with rate = median count rate of data. |
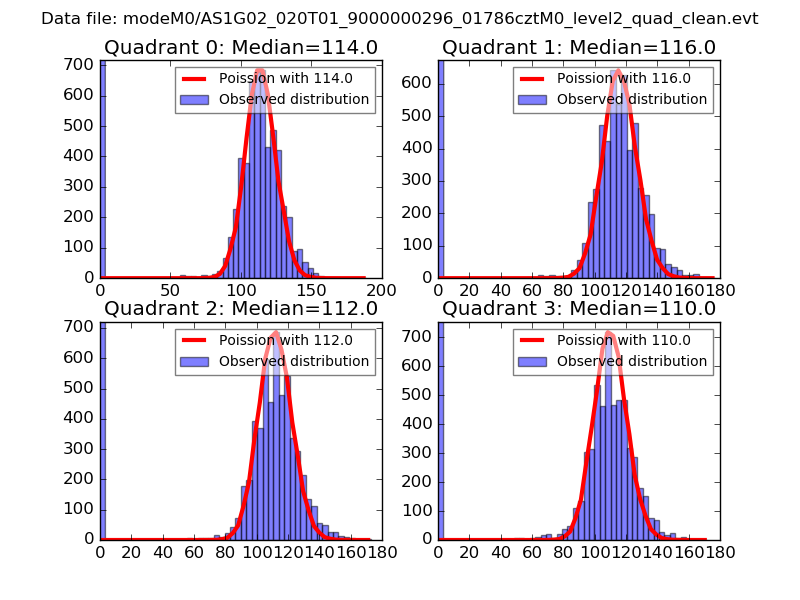 |
 |
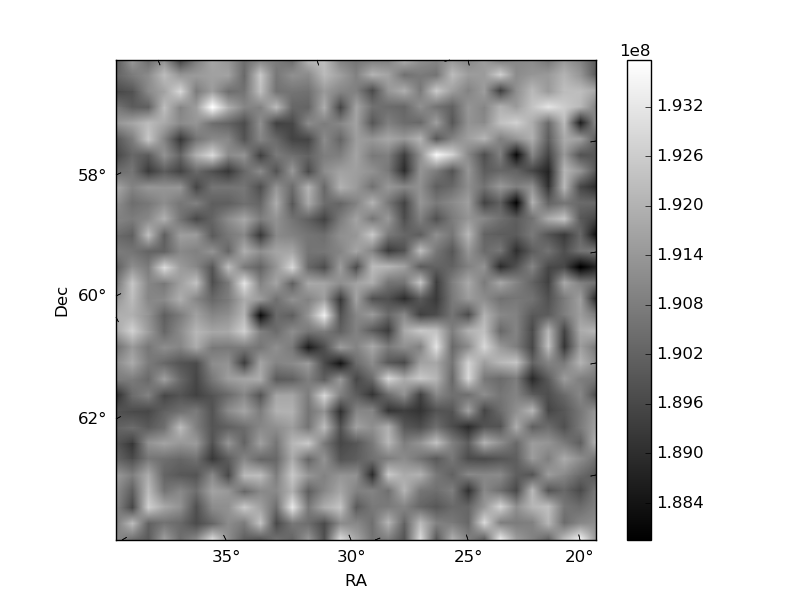
| Quadrant-wise count rates Data is divided into 100 sec bins |
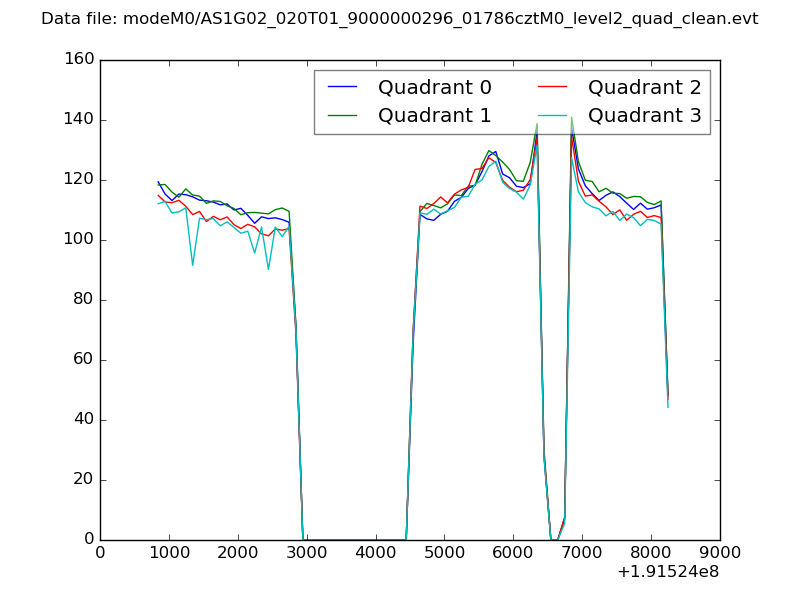 |
|
| Module-wise count rates for Quadrant A Data is divided into 100 sec bins |
 |
 |
| Module-wise count rates for Quadrant B Data is divided into 100 sec bins |
 |
 |
| Module-wise count rates for Quadrant C Data is divided into 100 sec bins |
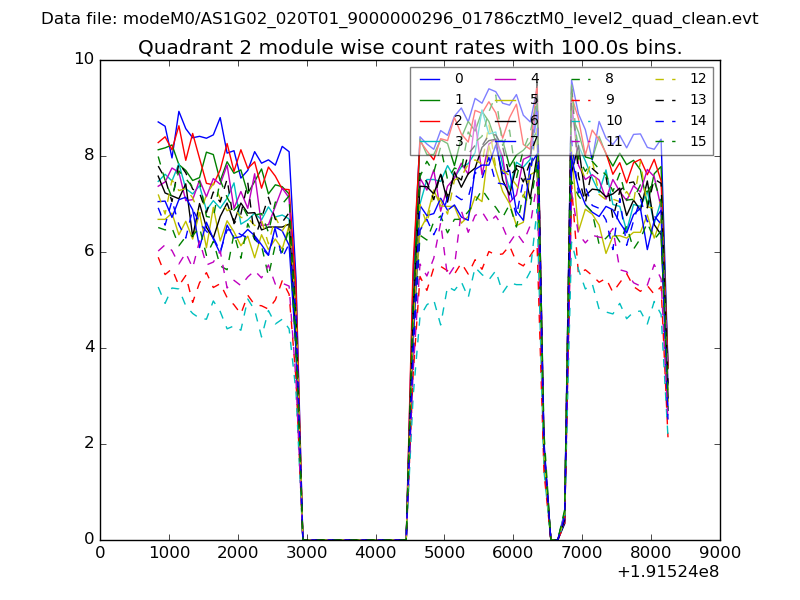 |
 |
| Module-wise count rates for Quadrant D Data is divided into 100 sec bins |
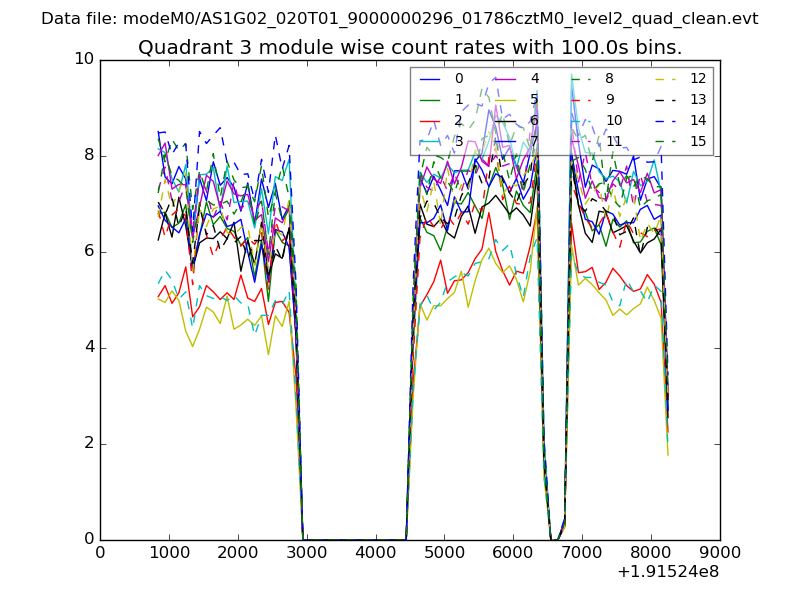 |
 |
| Parameter | Plot |
|---|---|
| CZT HV Monitor | 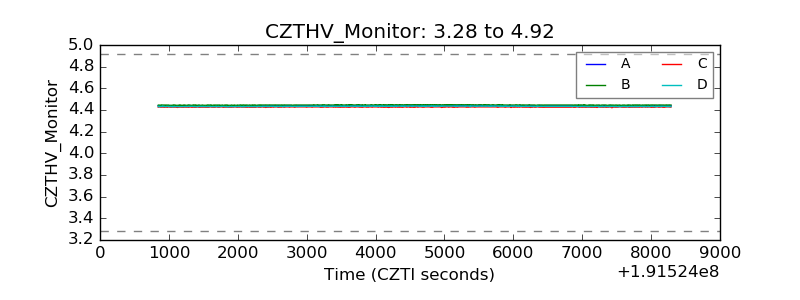 |
| D_VDD | 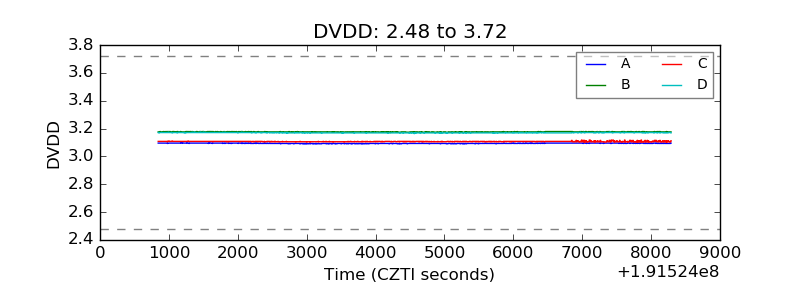 |
| Temperature 1 | 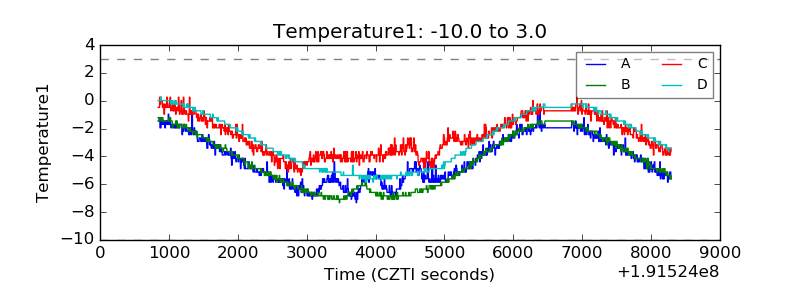 |
| Veto HV Monitor | 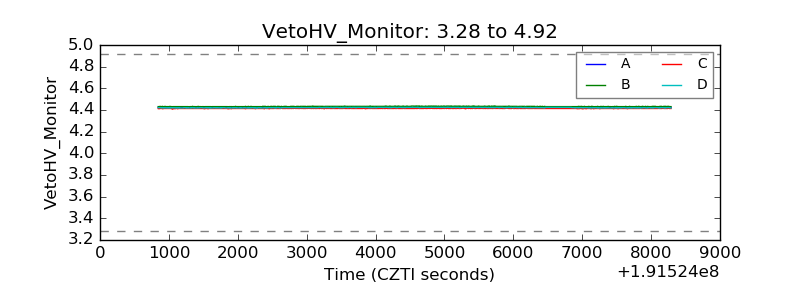 |
| Veto LLD | 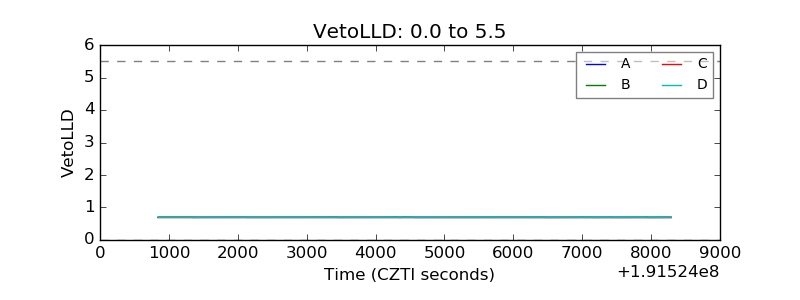 |
| Alpha Counter | 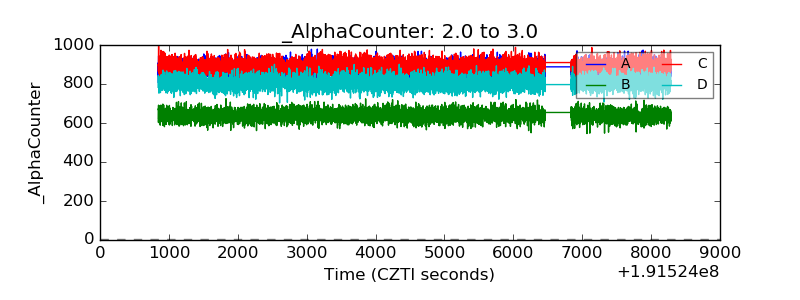 |
| _CPM_Rate | 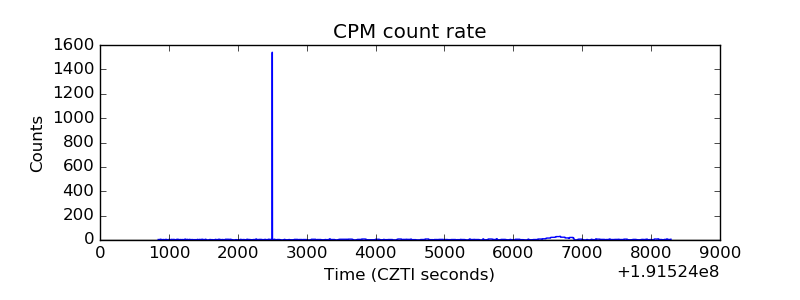 |
| CZT Counter | 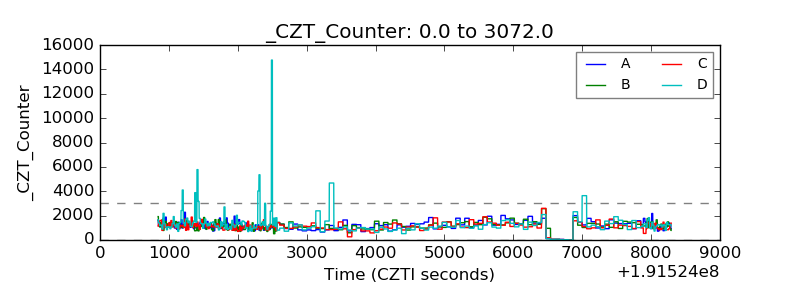 |
| +2.5 Volts monitor |  |
| +5 Volts monitor |  |
| _ROLL_ROT | 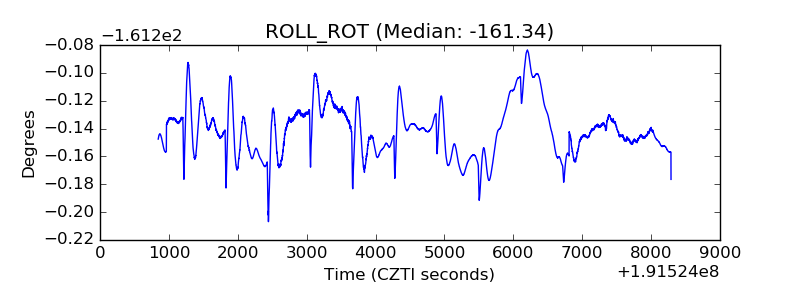 |
| _Roll_DEC | 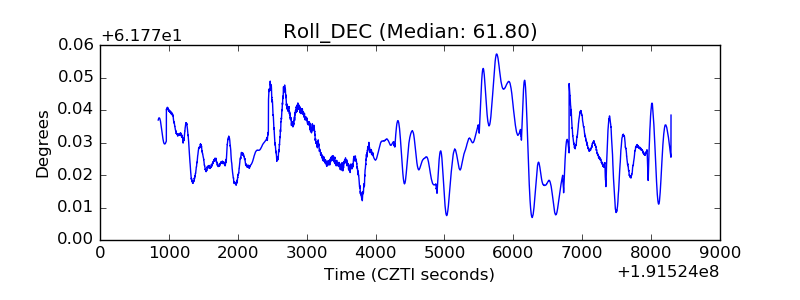 |
| _Roll_RA | 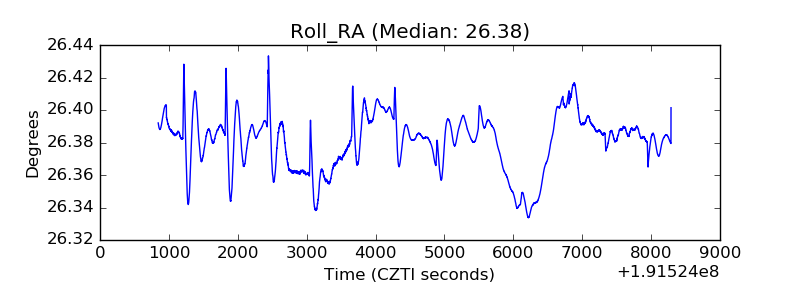 |
| Veto Counter | 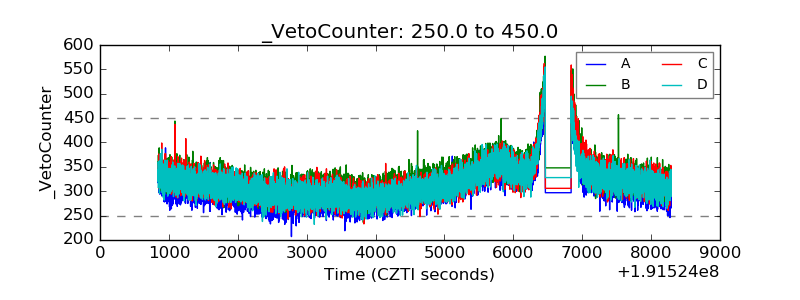 |