| Param | Original file | Final file |
|---|---|---|
| Filename | modeM0/AS1G02_020T01_9000000296_01788cztM0_level2.evt | modeM0/AS1G02_020T01_9000000296_01788cztM0_level2_quad_clean.evt |
| Size (bytes) | 1,107,345,600 | 86,109,120 |
| Size | 1.0 GB | 82.1 MB |
| Events in quadrant A | 8,086,019 | 545,675 |
| Events in quadrant B | 8,339,854 | 554,004 |
| Events in quadrant C | 7,898,296 | 538,298 |
| Events in quadrant D | 8,760,425 | 494,883 |
| Mode M9 | |||
|---|---|---|---|
| Quadrant | BADHDUFLAG | Total packets | Discarded packets |
| A | 0 | 1 | 0 |
| B | 1 | 1 | 0 |
| C | 1 | -1 | -1 |
| D | 1 | -1 | -1 |
| Mode SS | |||
|---|---|---|---|
| Quadrant | BADHDUFLAG | Total packets | Discarded packets |
| A | 0 | 134 | 0 |
| B | 0 | 134 | 0 |
| C | 0 | 134 | 0 |
| D | 0 | 134 | 0 |
| Mode M0 | |||
|---|---|---|---|
| Quadrant | BADHDUFLAG | Total packets | Discarded packets |
| A | 0 | 28863 | 13 |
| B | 0 | 29597 | 1 |
| C | 0 | 28325 | 1 |
| D | 0 | 30925 | 1 |
| Quadrant | Total seconds | Saturated seconds | Saturation percentage |
|---|---|---|---|
| A | 6817 | 7 | 0.102684% |
| B | 6819 | 2 | 0.029330% |
| C | 6819 | 2 | 0.029330% |
| D | 6819 | 430 | 6.305910% |
Noise dominated data is calculated using 1-second bins in cleaned event files. If a bin has >2000 counts, and if more than 50% of those come from <1% of pixels, then it is considered to be noise-dominated and hence unusable.
| Quadrant | # 1 sec bins | Bins with >0 counts | Bins with >2000 counts | High rate bins dominated by noise | Noise dominated (total time) | Noise dominated (detector-on time) | Marked lightcurve |
|---|---|---|---|---|---|---|---|
| A | 7529 | 6819 | 156 | 156 | 2.07% | 2.29% | 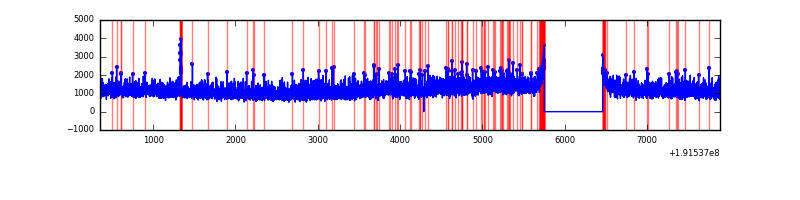 |
| B | 7529 | 6819 | 160 | 160 | 2.13% | 2.35% | 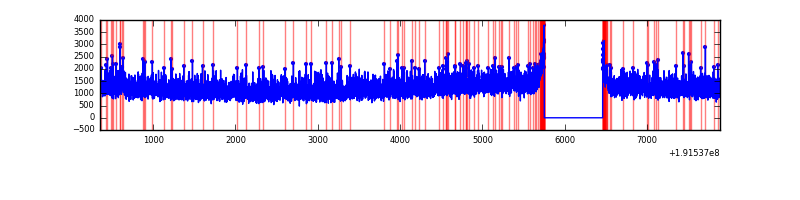 |
| C | 7529 | 6820 | 118 | 118 | 1.57% | 1.73% | 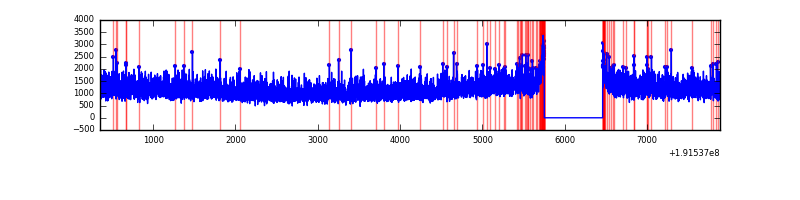 |
| D | 7529 | 6820 | 690 | 690 | 9.16% | 10.12% | 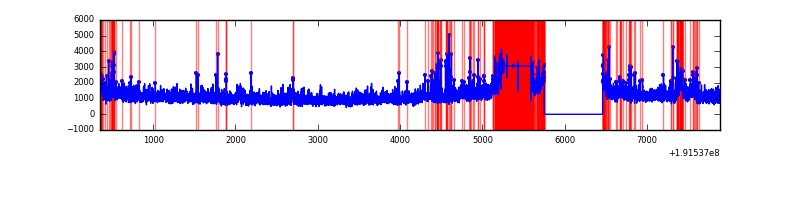 |
Top three noisy pixels from each quadrant. If the there are fewer than three noisy pixels in the level2.evt file, extra rows are filled as -1
| Pixel properties | Quadrant properties | ||||||
|---|---|---|---|---|---|---|---|
| Quadrant | DetID | PixID | Counts | Sigma | Mean | Median | Sigma |
| A | 15 | 236 | 52132 | 99.08 | 2096 | 2111 | 504.9 |
| A | 0 | 231 | 11063 | 17.73 | 2096 | 2111 | 504.9 |
| A | 10 | 2 | 9533 | 14.7 | 2096 | 2111 | 504.9 |
| B | 0 | 244 | 26205 | 46.76 | 2183 | 2191 | 513.6 |
| B | 4 | 216 | 22382 | 39.31 | 2183 | 2191 | 513.6 |
| B | 4 | 200 | 11605 | 18.33 | 2183 | 2191 | 513.6 |
| C | 9 | 236 | 21484 | 34.45 | 2017 | 2092 | 562.9 |
| C | 10 | 82 | 9725 | 13.56 | 2017 | 2092 | 562.9 |
| C | -1 | -1 | -1 | -1.0 | 2017 | 2092 | 562.9 |
| D | 2 | 16 | 1124574 | 1958.6 | 1852 | 1920 | 573.2 |
| D | 7 | 85 | 293693 | 509.03 | 1852 | 1920 | 573.2 |
| D | 10 | 172 | 140999 | 242.64 | 1852 | 1920 | 573.2 |
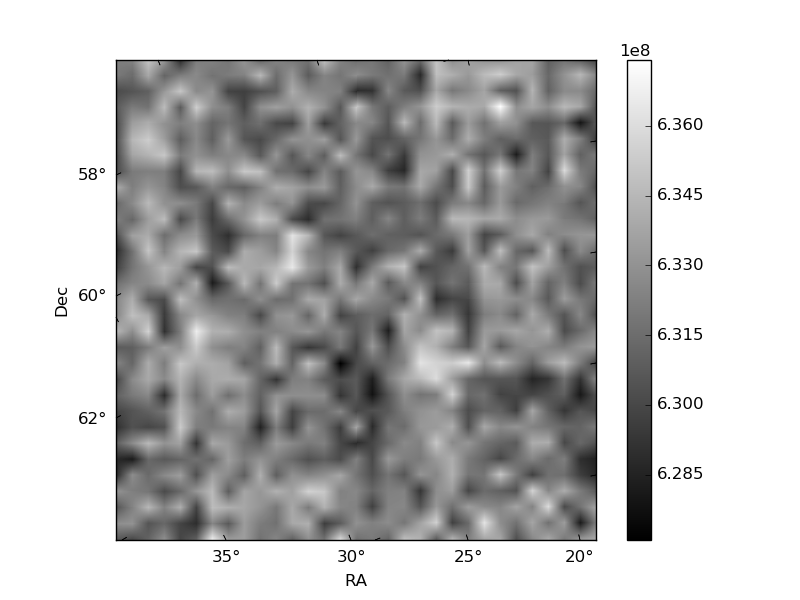
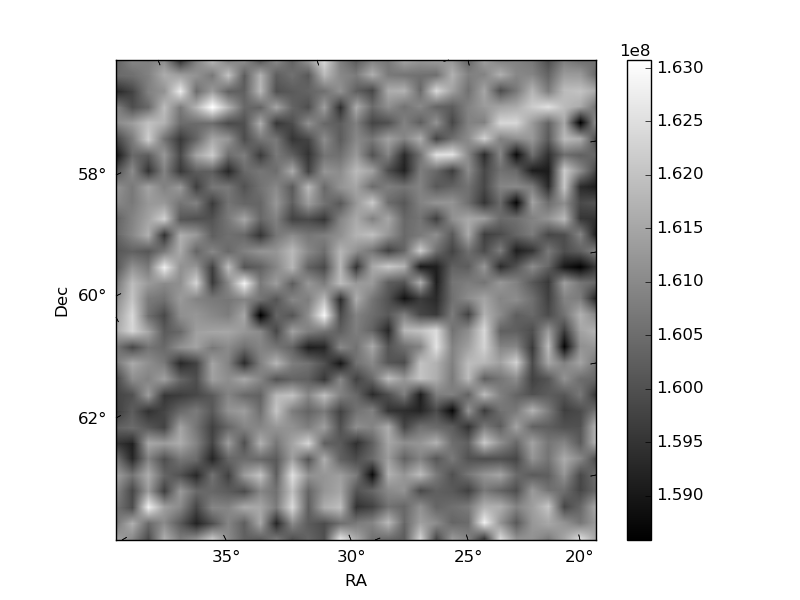
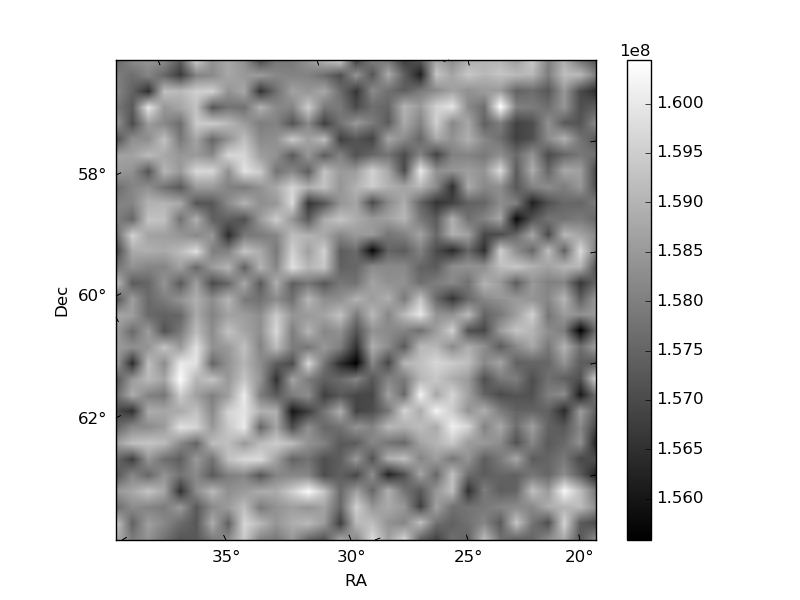
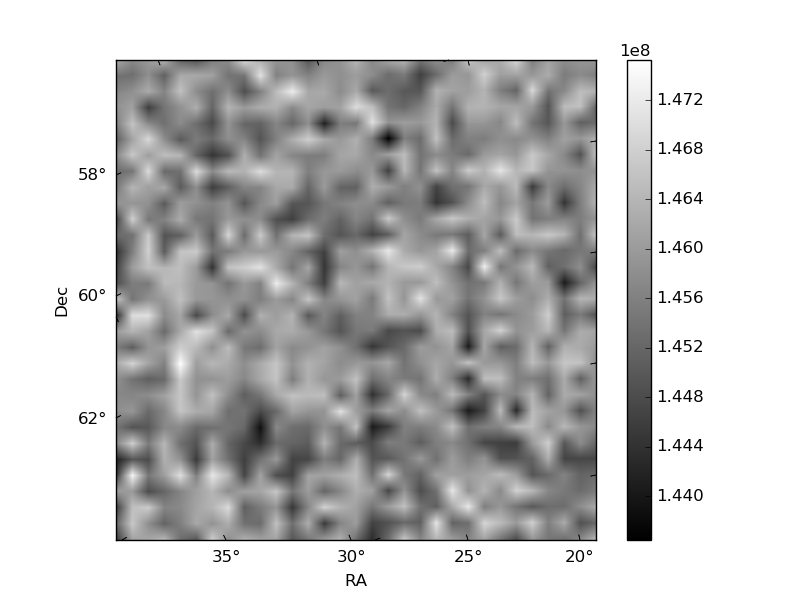
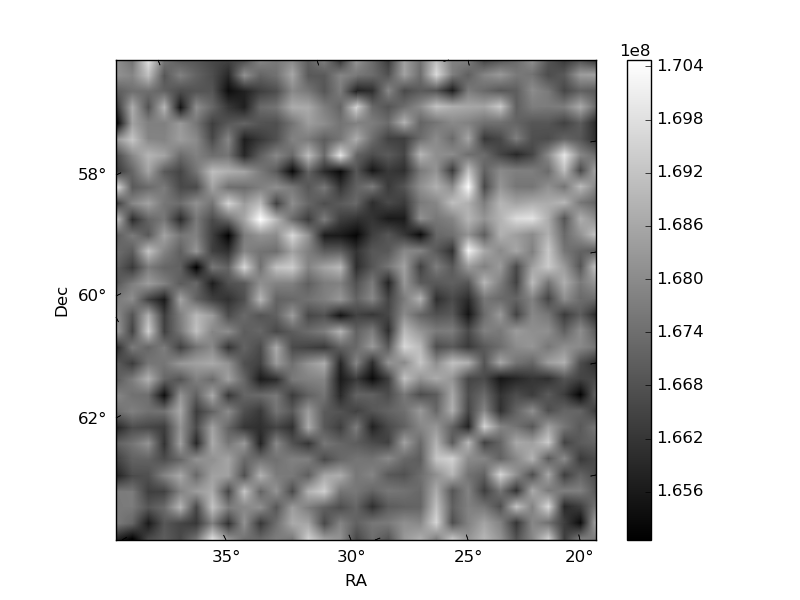
Histogram calculated using DETX and DETY for each event in the final _common_clean file
| Quadrant A | 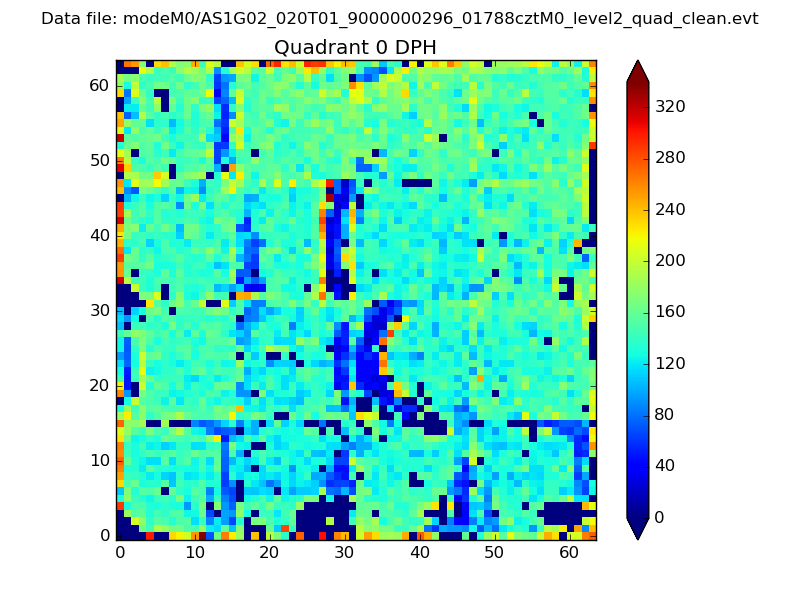 |
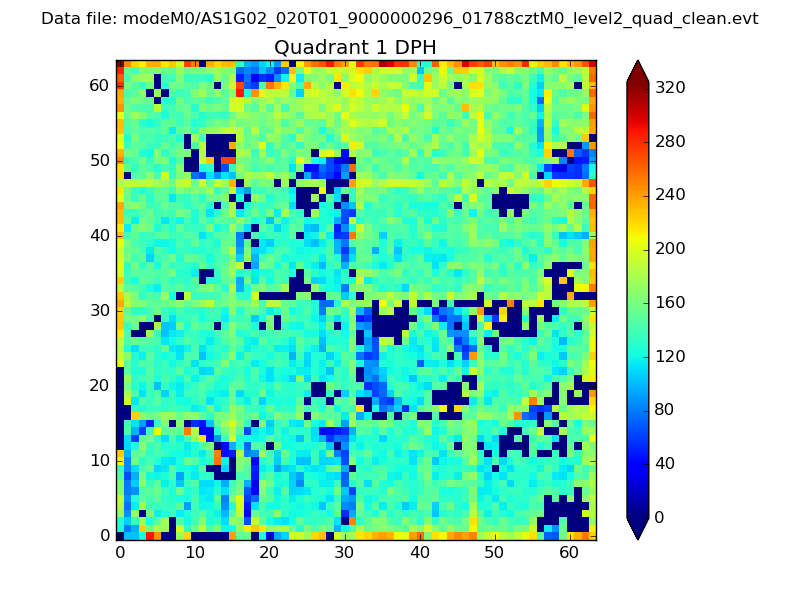 |
Quadrant B |
|---|---|---|---|
| Quadrant D |  |
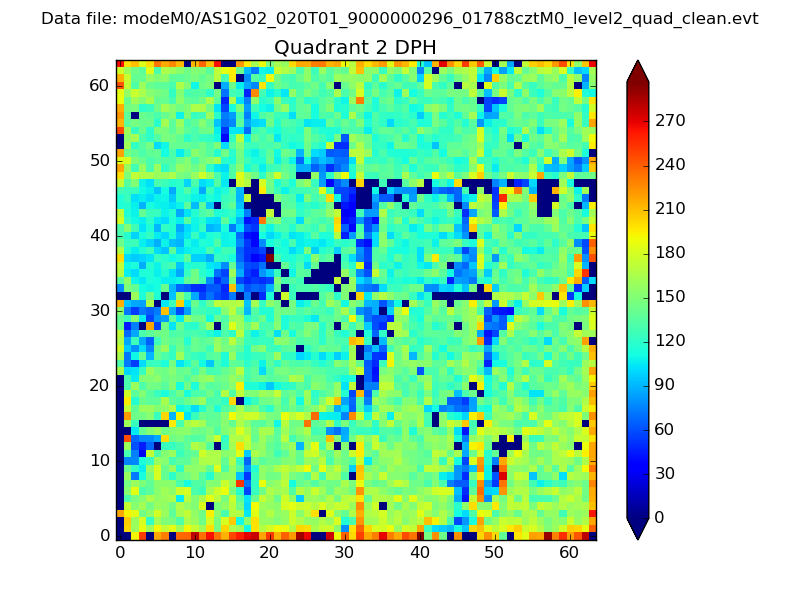 |
Quadrant C |
| Plot type | Count rate plots | Images |
|---|---|---|
| Comparison with Poisson distribution Blue bars denote a histogram of data divided into 1 sec bins. Red curve is a Poisson curve with rate = median count rate of data. |
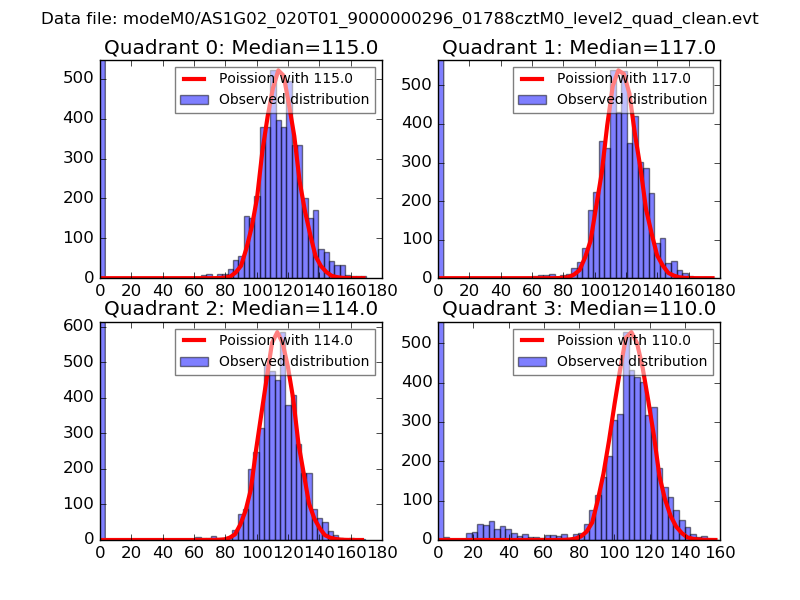 |
 |
| Quadrant-wise count rates Data is divided into 100 sec bins |
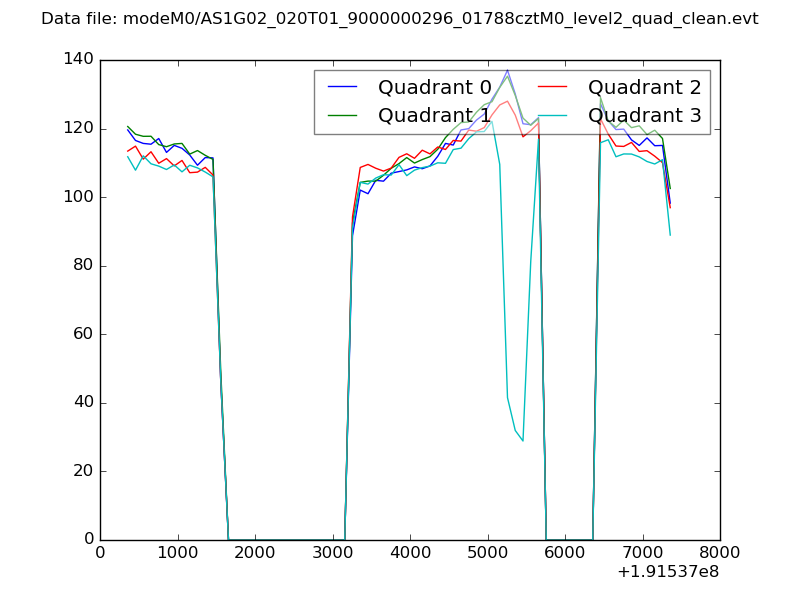 |
|
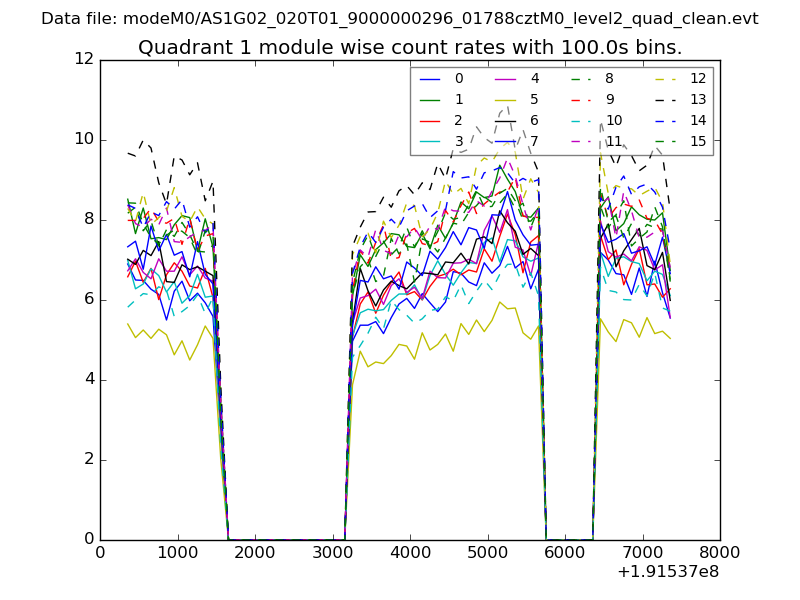
| Module-wise count rates for Quadrant A Data is divided into 100 sec bins |
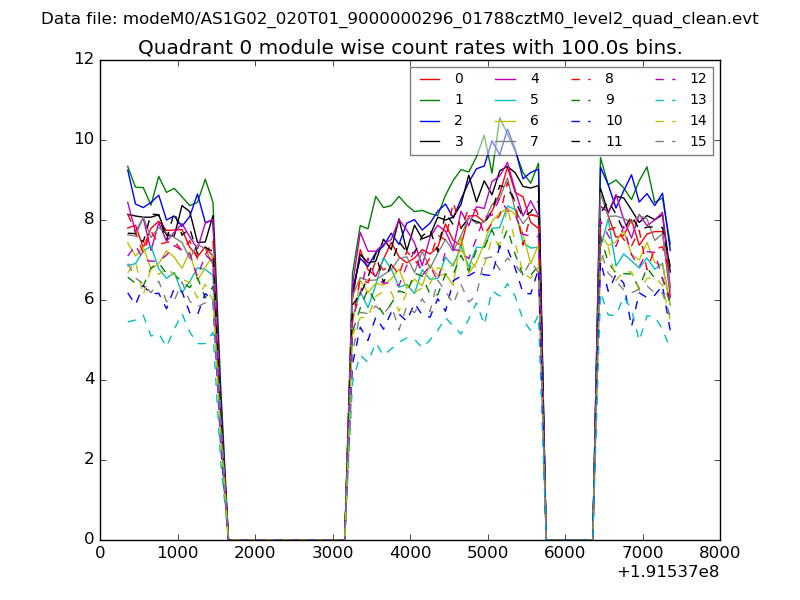 |
 |
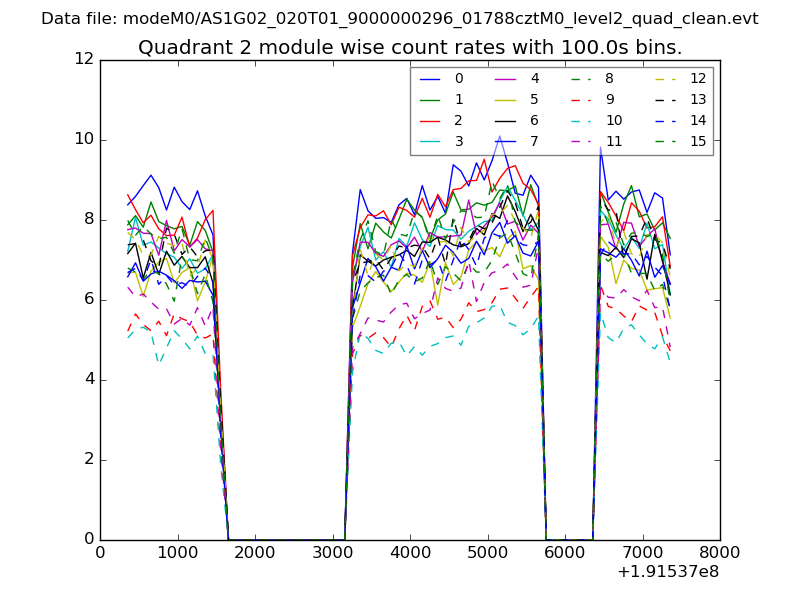
| Module-wise count rates for Quadrant B Data is divided into 100 sec bins |
 |
 |
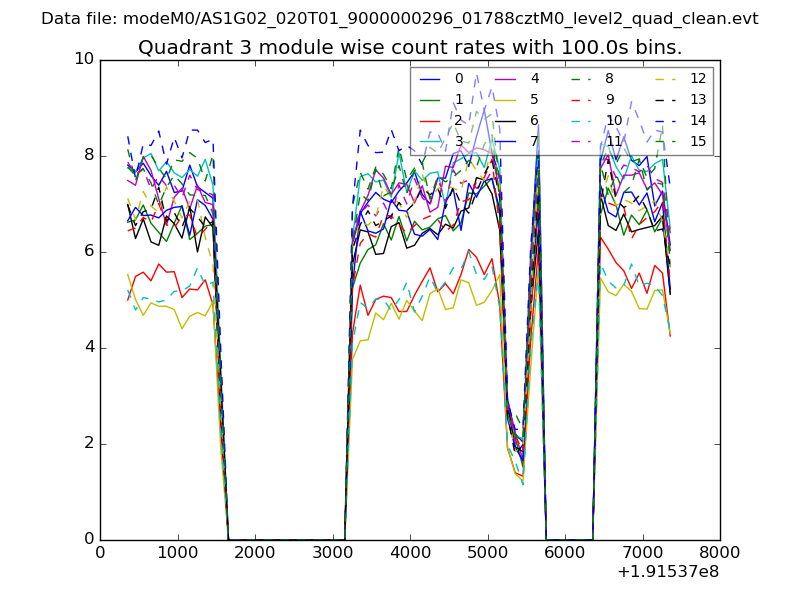
| Module-wise count rates for Quadrant C Data is divided into 100 sec bins |
 |
 |
| Module-wise count rates for Quadrant D Data is divided into 100 sec bins |
 |
 |
| Parameter | Plot |
|---|---|
| CZT HV Monitor | 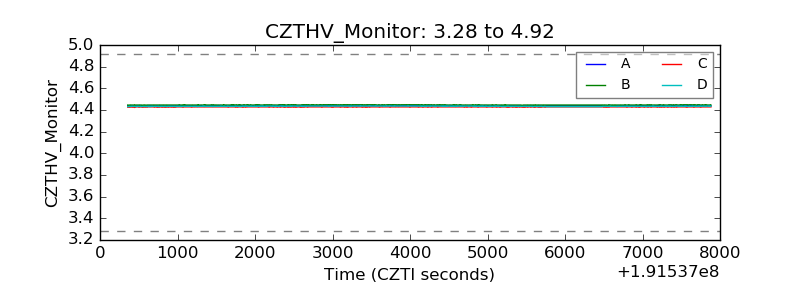 |
| D_VDD | 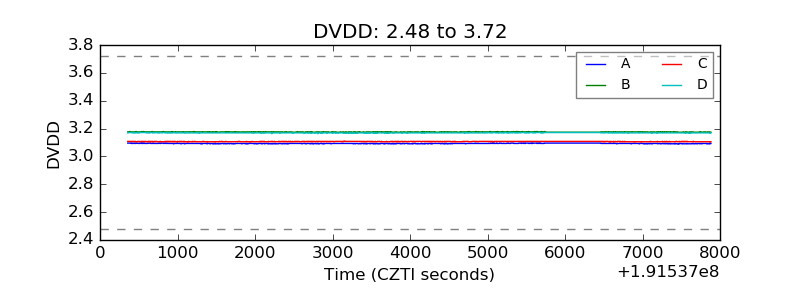 |
| Temperature 1 | 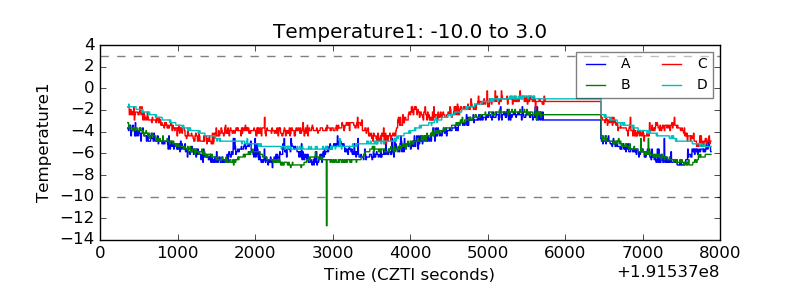 |
| Veto HV Monitor |  |
| Veto LLD | 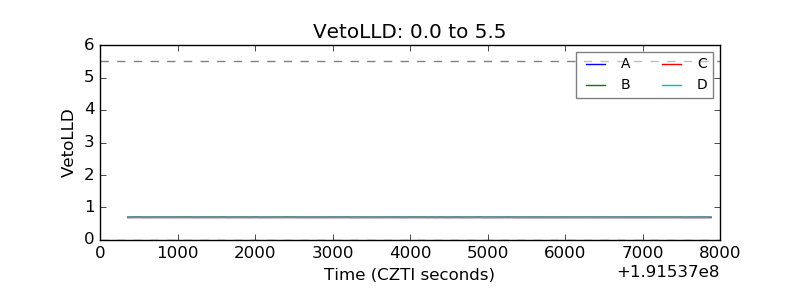 |
| Alpha Counter | 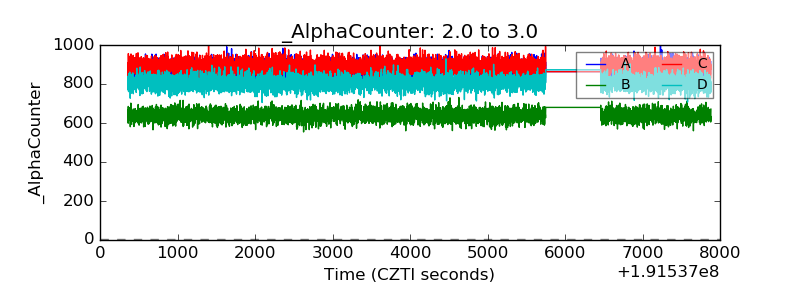 |
| _CPM_Rate | 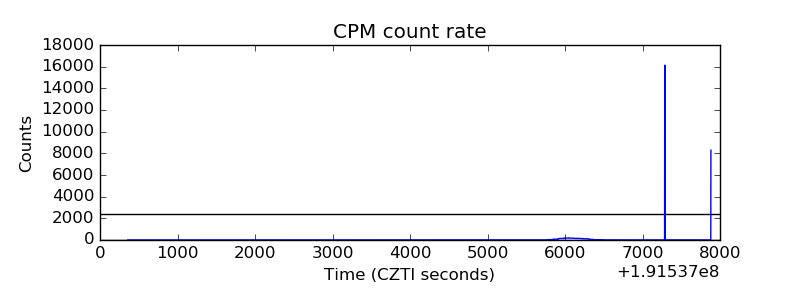 |
| CZT Counter | 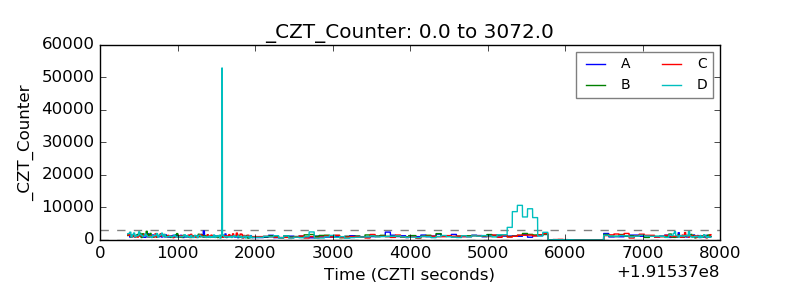 |
| +2.5 Volts monitor |  |
| +5 Volts monitor |  |
| _ROLL_ROT | 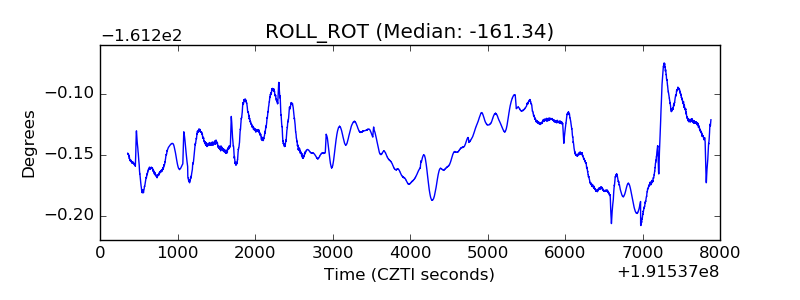 |
| _Roll_DEC | 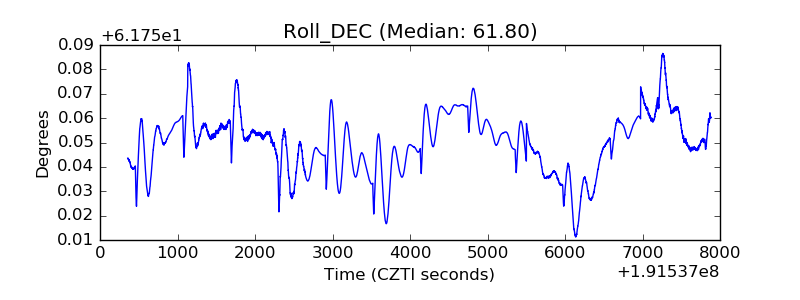 |
| _Roll_RA | 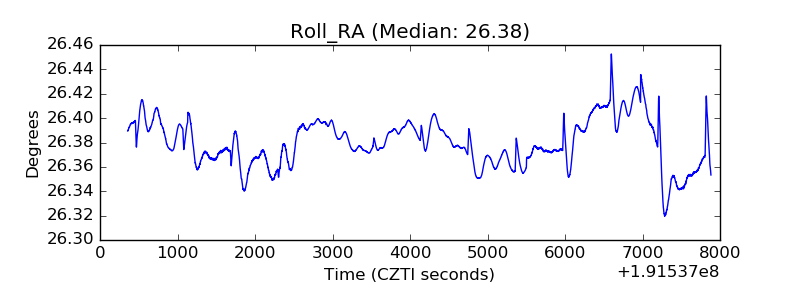 |
| Veto Counter | 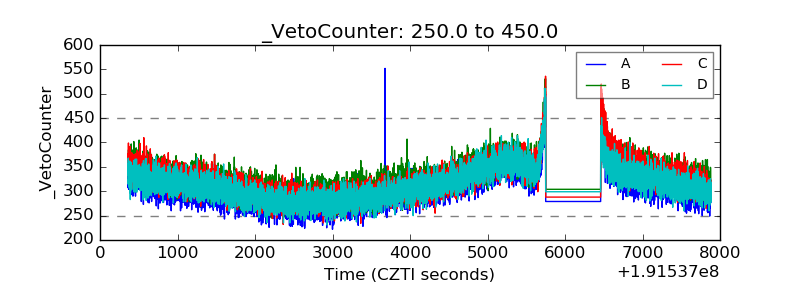 |