| Param | Original file | Final file |
|---|---|---|
| Filename | modeM0/AS1G02_020T01_9000000296_01789cztM0_level2.evt | modeM0/AS1G02_020T01_9000000296_01789cztM0_level2_quad_clean.evt |
| Size (bytes) | 1,187,979,840 | 22,682,880 |
| Size | 1.1 GB | 21.6 MB |
| Events in quadrant A | 8,790,498 | 49,846 |
| Events in quadrant B | 9,117,889 | 50,057 |
| Events in quadrant C | 8,609,674 | 48,691 |
| Events in quadrant D | 8,973,779 | 25,850 |
| Mode M9 | |||
|---|---|---|---|
| Quadrant | BADHDUFLAG | Total packets | Discarded packets |
| A | 0 | 1 | 0 |
| B | 1 | 1 | 0 |
| C | 1 | -1 | -1 |
| D | 1 | -1 | -1 |
| Mode SS | |||
|---|---|---|---|
| Quadrant | BADHDUFLAG | Total packets | Discarded packets |
| A | 0 | 144 | 0 |
| B | 0 | 144 | 0 |
| C | 0 | 144 | 0 |
| D | 0 | 145 | 1 |
| Mode M0 | |||
|---|---|---|---|
| Quadrant | BADHDUFLAG | Total packets | Discarded packets |
| A | 0 | 31328 | 2 |
| B | 0 | 32291 | 2 |
| C | 0 | 30817 | 16 |
| D | 0 | 31911 | 2 |
| Quadrant | Total seconds | Saturated seconds | Saturation percentage |
|---|---|---|---|
| A | 7351 | 8 | 0.108829% |
| B | 7351 | 9 | 0.122432% |
| C | 7349 | 3 | 0.040822% |
| D | 7351 | 272 | 3.700177% |
Noise dominated data is calculated using 1-second bins in cleaned event files. If a bin has >2000 counts, and if more than 50% of those come from <1% of pixels, then it is considered to be noise-dominated and hence unusable.
| Quadrant | # 1 sec bins | Bins with >0 counts | Bins with >2000 counts | High rate bins dominated by noise | Noise dominated (total time) | Noise dominated (detector-on time) | Marked lightcurve |
|---|---|---|---|---|---|---|---|
| A | 8957 | 7354 | 156 | 156 | 1.74% | 2.12% | 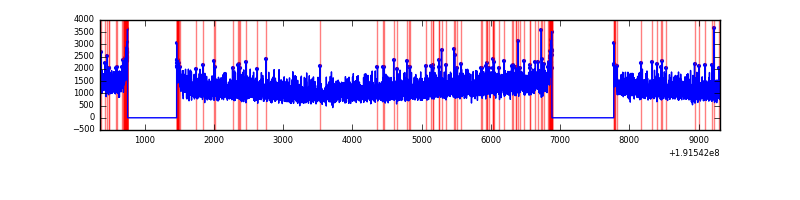 |
| B | 8957 | 7353 | 206 | 206 | 2.30% | 2.80% | 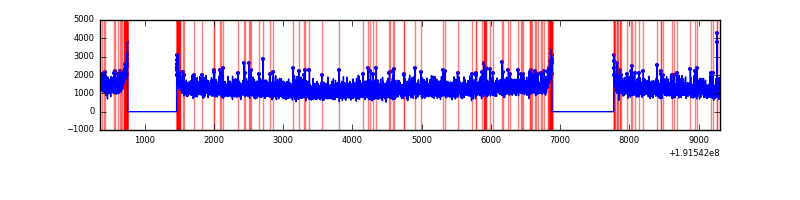 |
| C | 8957 | 7354 | 182 | 182 | 2.03% | 2.47% | 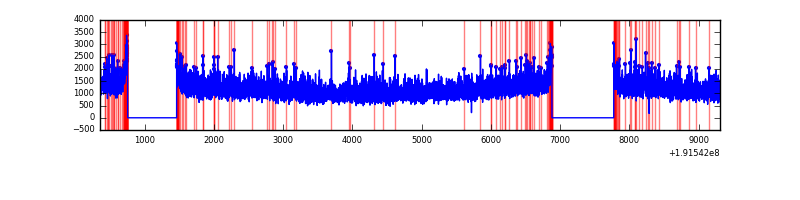 |
| D | 8957 | 7354 | 499 | 499 | 5.57% | 6.79% |  |
Top three noisy pixels from each quadrant. If the there are fewer than three noisy pixels in the level2.evt file, extra rows are filled as -1
| Pixel properties | Quadrant properties | ||||||
|---|---|---|---|---|---|---|---|
| Quadrant | DetID | PixID | Counts | Sigma | Mean | Median | Sigma |
| A | 0 | 231 | 46125 | 79.99 | 2285 | 2297 | 547.9 |
| A | 10 | 2 | 7059 | 8.69 | 2285 | 2297 | 547.9 |
| A | 15 | 236 | 5568 | 5.97 | 2285 | 2297 | 547.9 |
| B | 15 | 85 | 18495 | 28.7 | 2392 | 2400 | 560.9 |
| B | 15 | 255 | 13100 | 19.08 | 2392 | 2400 | 560.9 |
| B | 4 | 200 | 12384 | 17.8 | 2392 | 2400 | 560.9 |
| C | 14 | 223 | 41788 | 64.69 | 2189 | 2269 | 610.9 |
| C | 9 | 236 | 29359 | 44.34 | 2189 | 2269 | 610.9 |
| C | -1 | -1 | -1 | -1.0 | 2189 | 2269 | 610.9 |
| D | 2 | 16 | 825824 | 1284.09 | 2060 | 2130 | 641.5 |
| D | 13 | 169 | 118114 | 180.81 | 2060 | 2130 | 641.5 |
| D | 7 | 85 | 104653 | 159.83 | 2060 | 2130 | 641.5 |
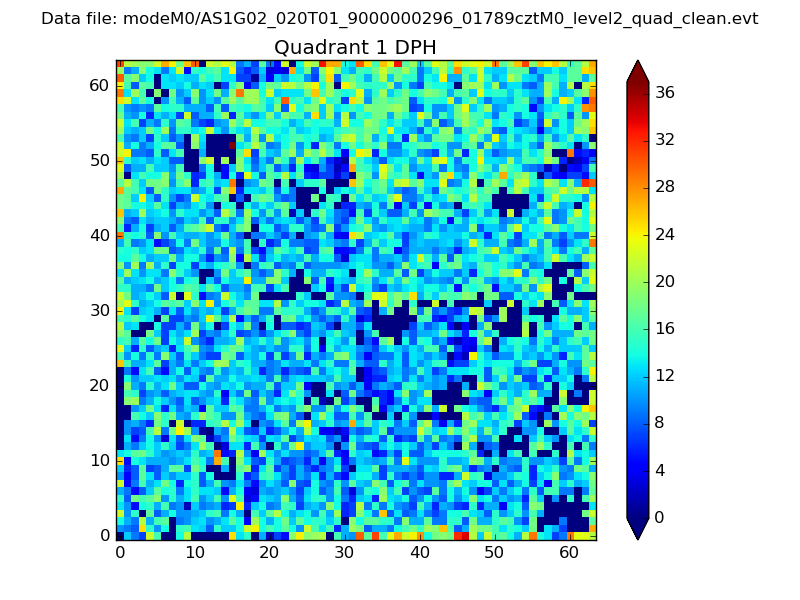
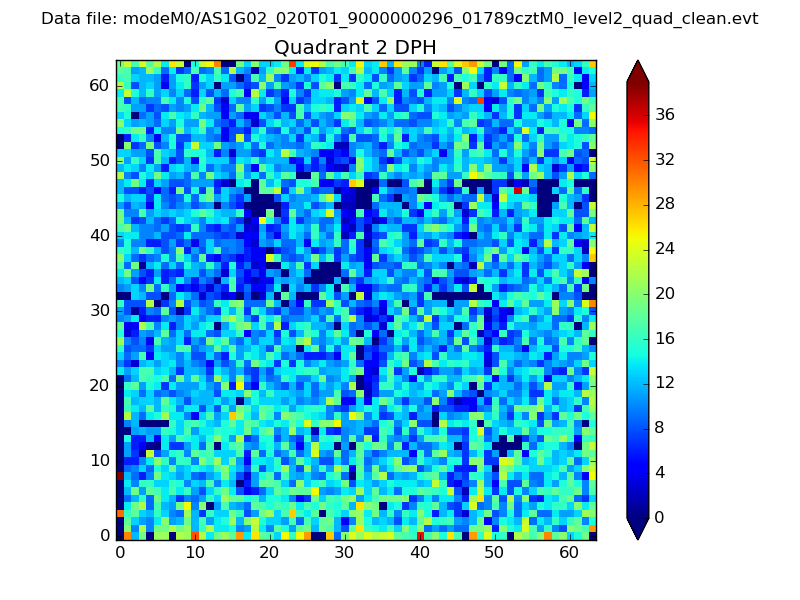
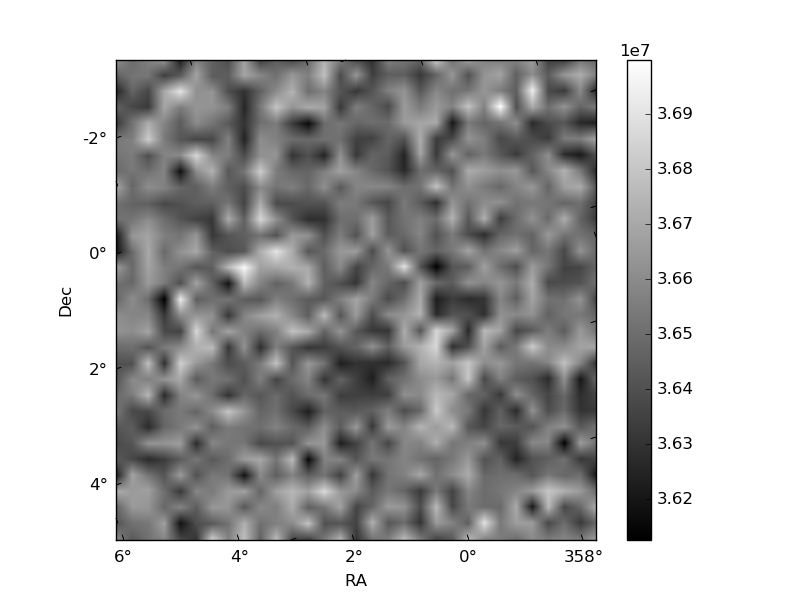
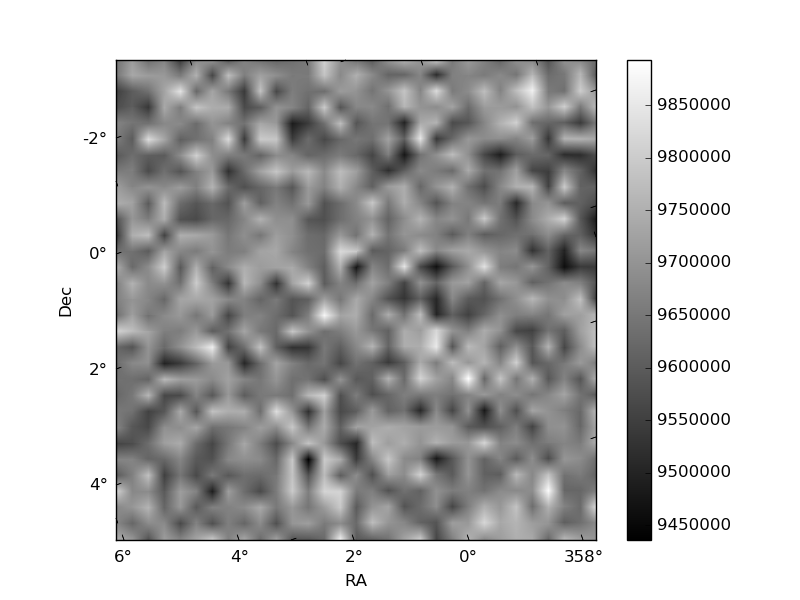
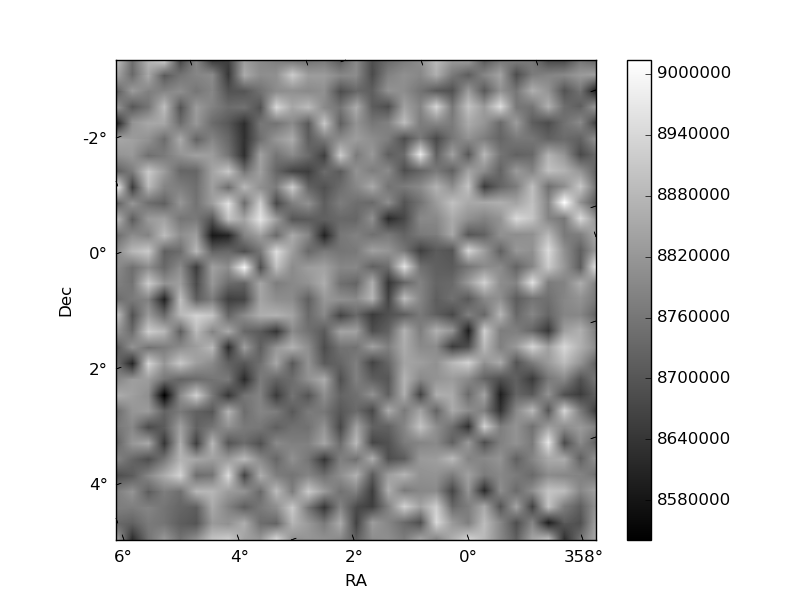
Histogram calculated using DETX and DETY for each event in the final _common_clean file
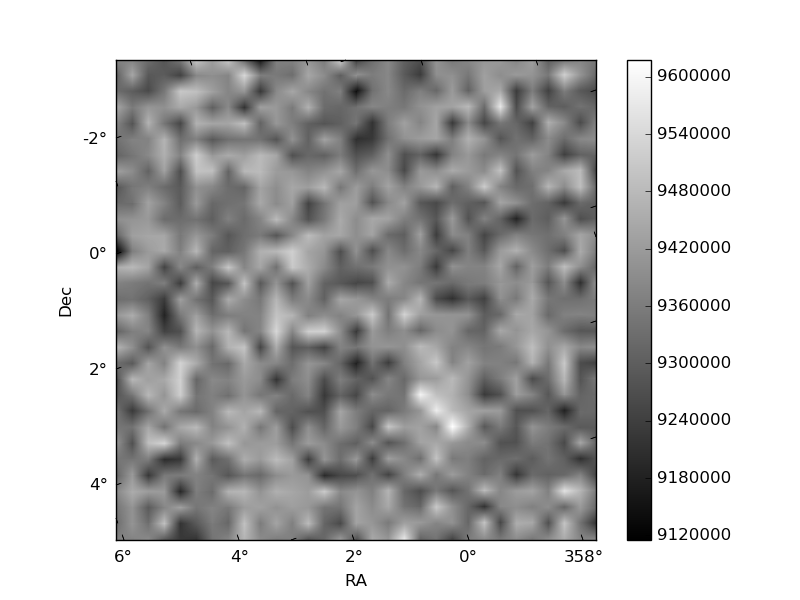
| Quadrant A | 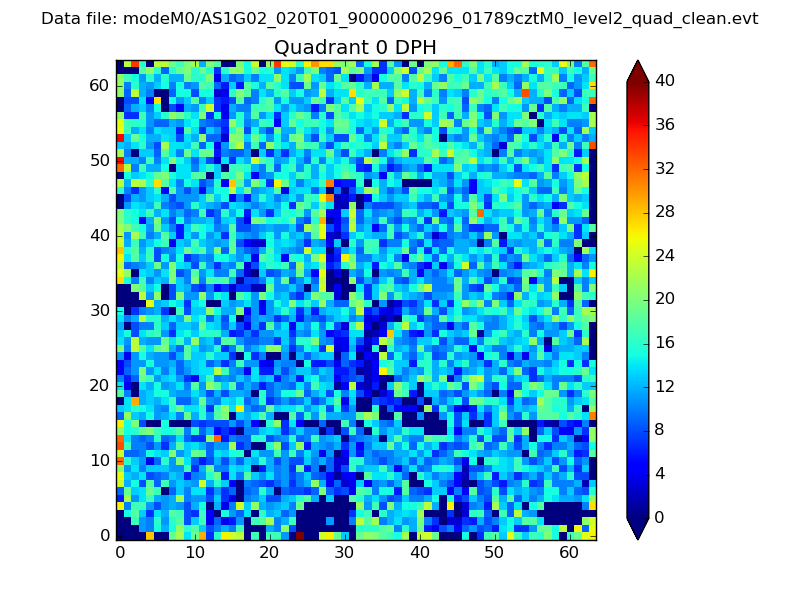 |
 |
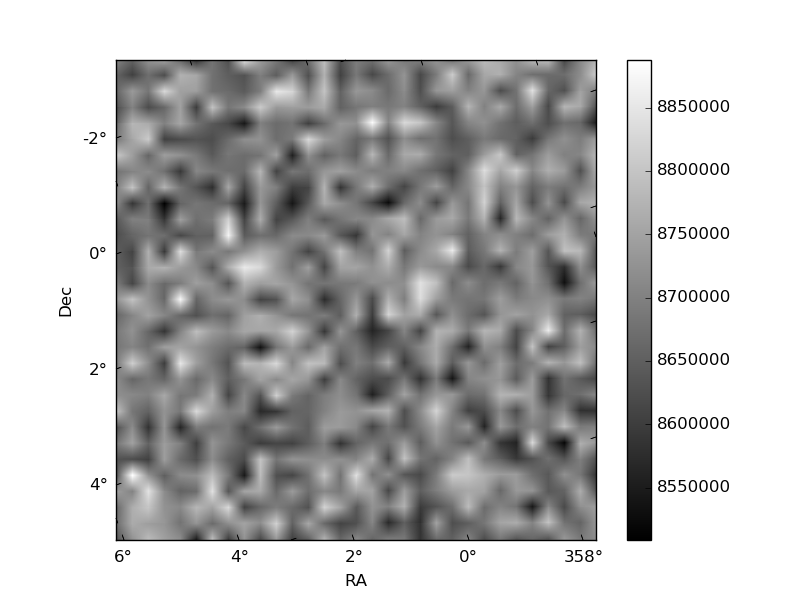
Quadrant B |
|---|---|---|---|
| Quadrant D | 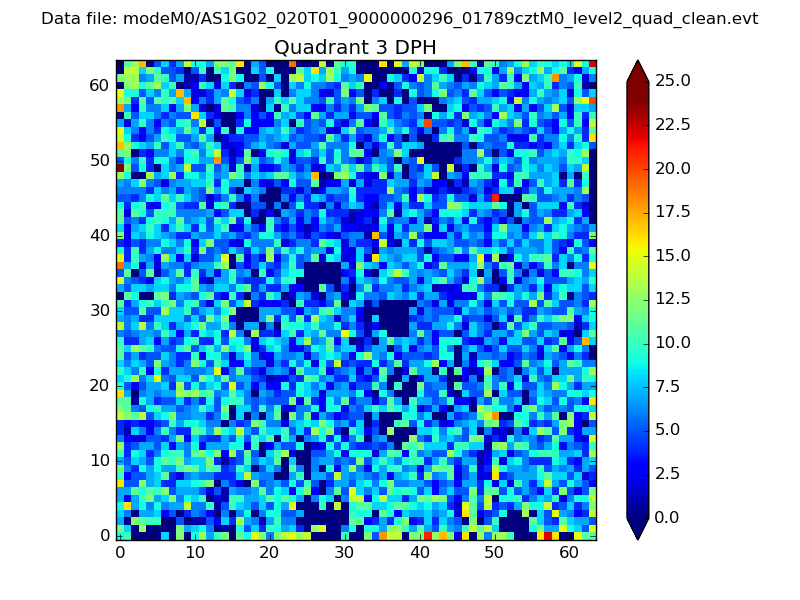 |
 |
Quadrant C |
| Plot type | Count rate plots | Images |
|---|---|---|
| Comparison with Poisson distribution Blue bars denote a histogram of data divided into 1 sec bins. Red curve is a Poisson curve with rate = median count rate of data. |
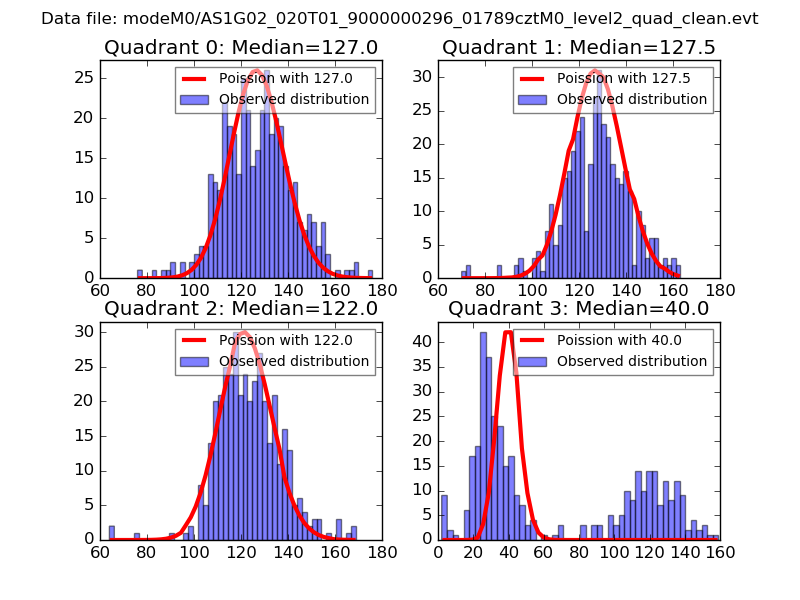 |
 |
| Quadrant-wise count rates Data is divided into 100 sec bins |
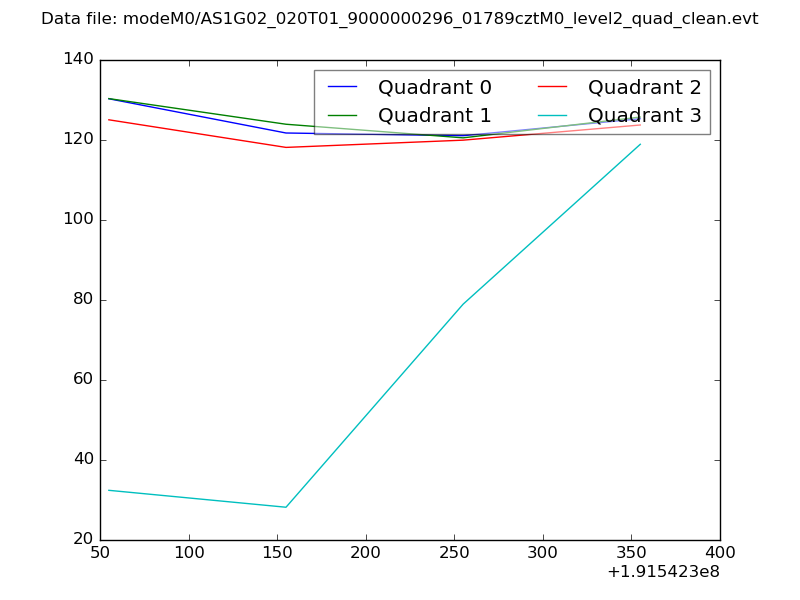 |
|
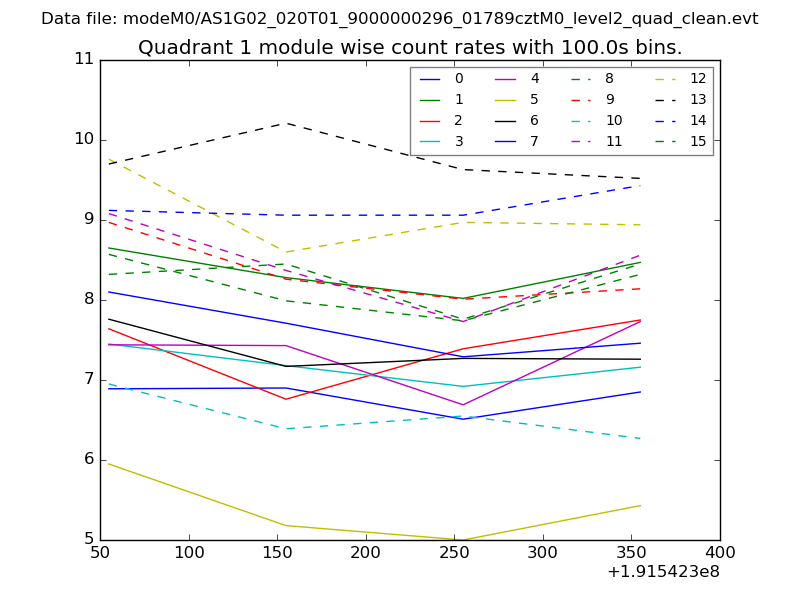
| Module-wise count rates for Quadrant A Data is divided into 100 sec bins |
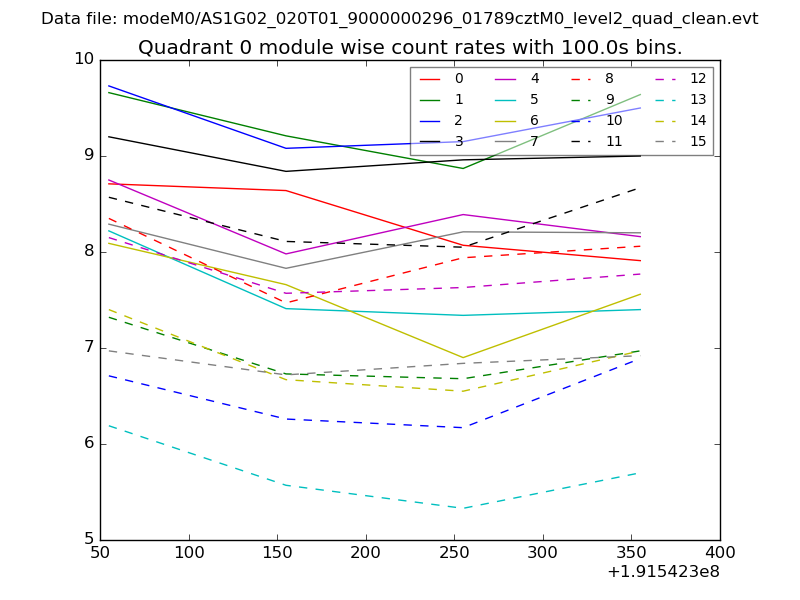 |
 |
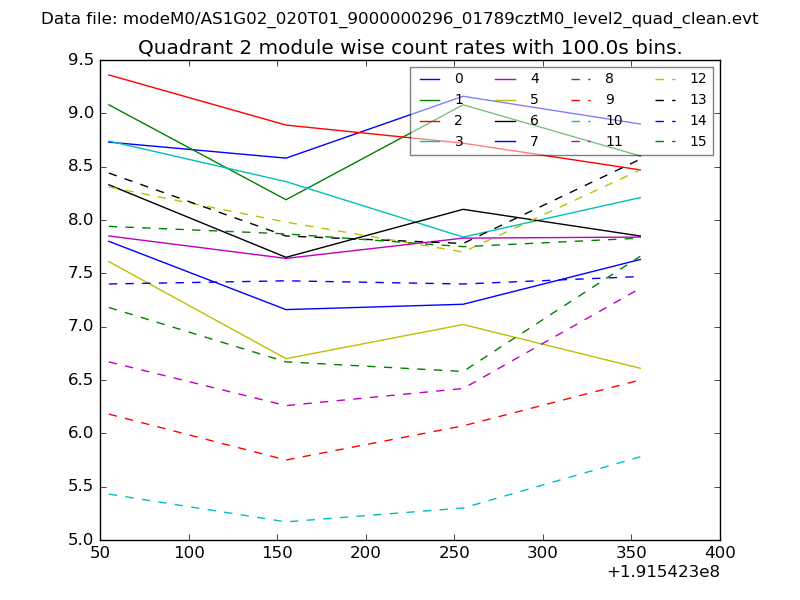
| Module-wise count rates for Quadrant B Data is divided into 100 sec bins |
 |
 |
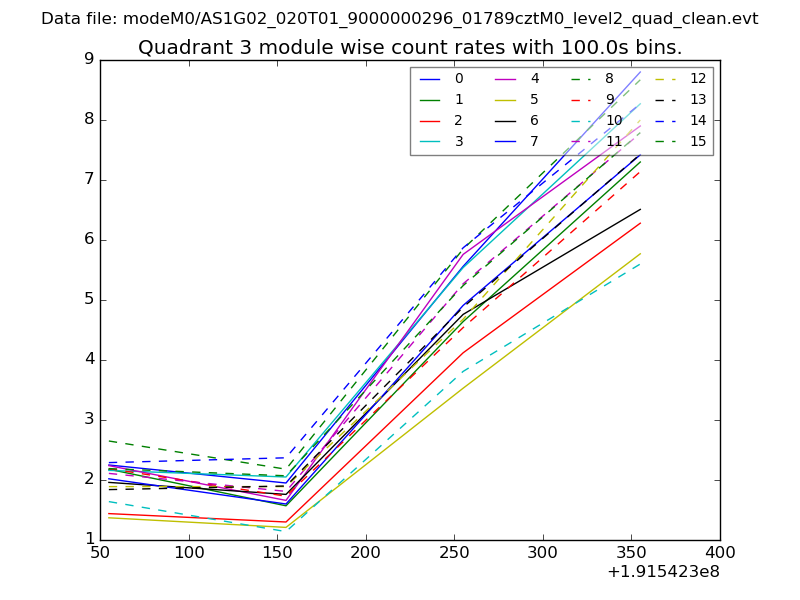
| Module-wise count rates for Quadrant C Data is divided into 100 sec bins |
 |
 |
| Module-wise count rates for Quadrant D Data is divided into 100 sec bins |
 |
 |
| Parameter | Plot |
|---|---|
| CZT HV Monitor | 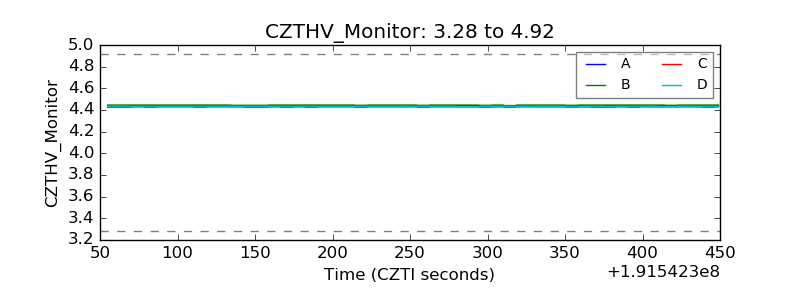 |
| D_VDD | 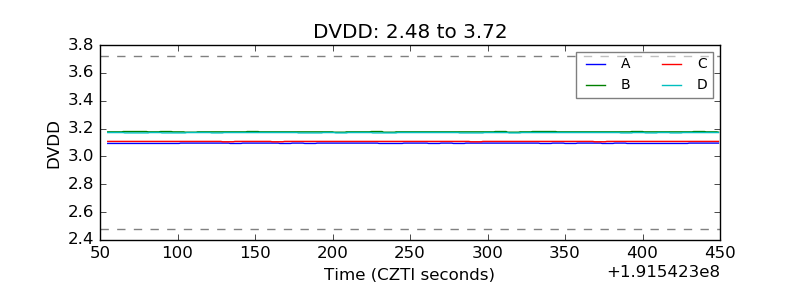 |
| Temperature 1 | 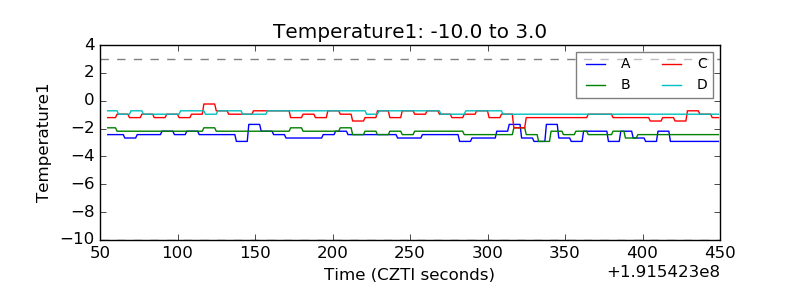 |
| Veto HV Monitor | 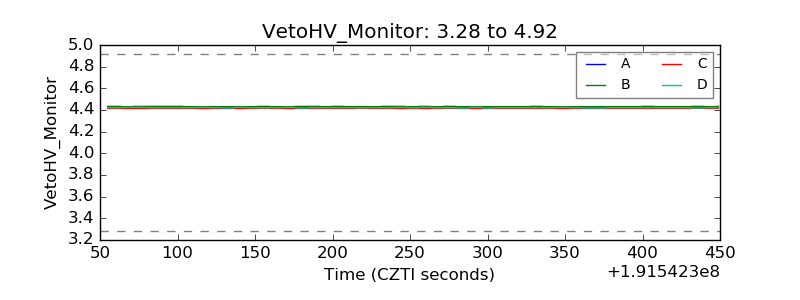 |
| Veto LLD | 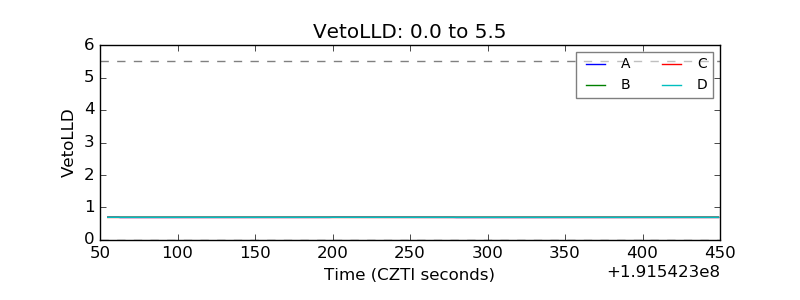 |
| Alpha Counter | 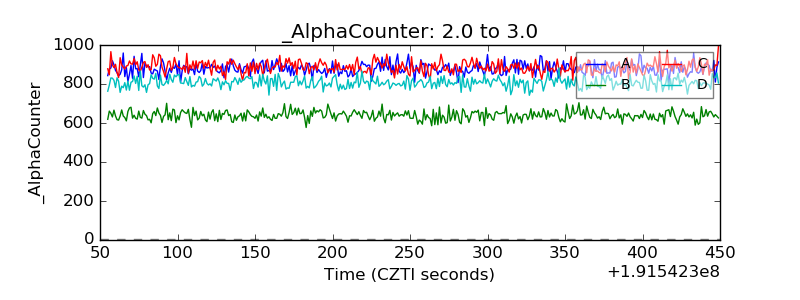 |
| _CPM_Rate | 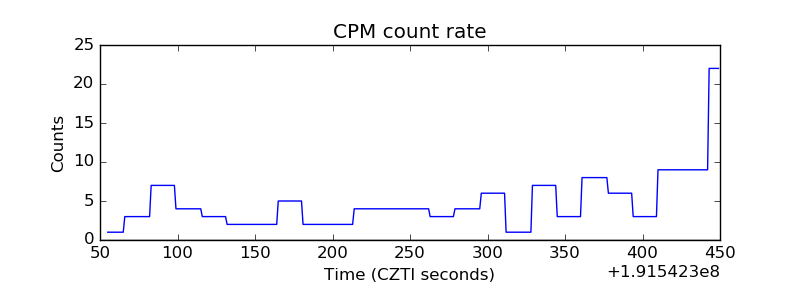 |
| CZT Counter | 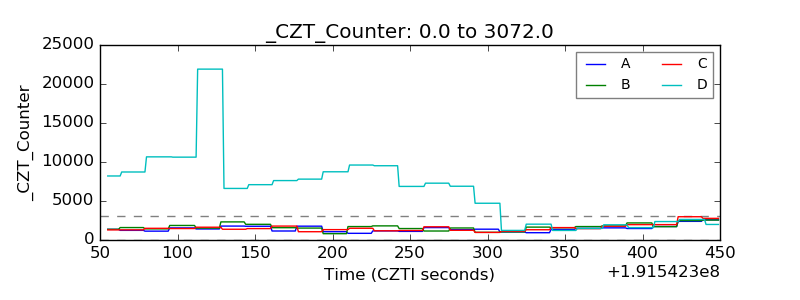 |
| +2.5 Volts monitor |  |
| +5 Volts monitor | 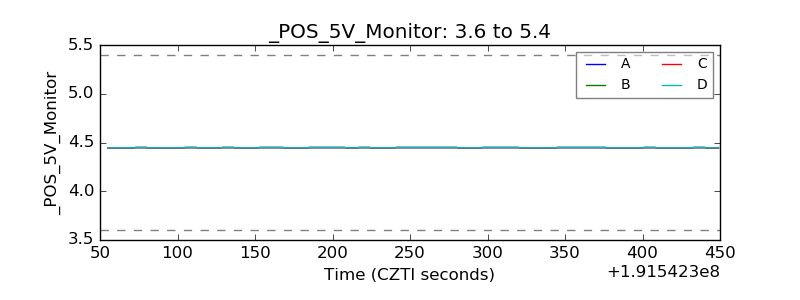 |
| _ROLL_ROT | 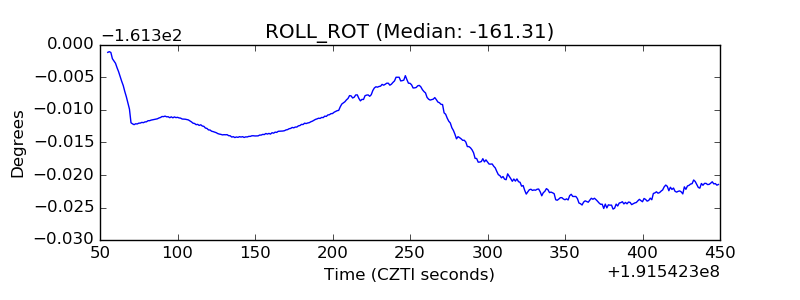 |
| _Roll_DEC | 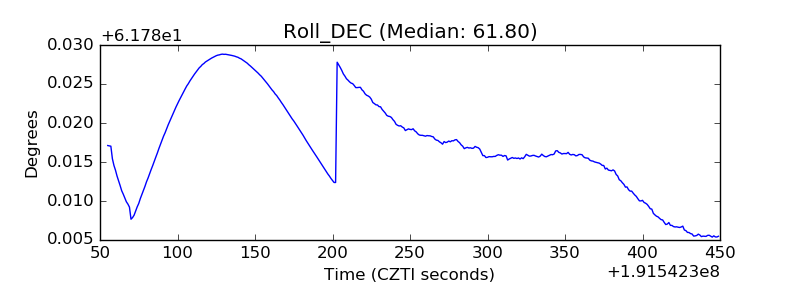 |
| _Roll_RA | 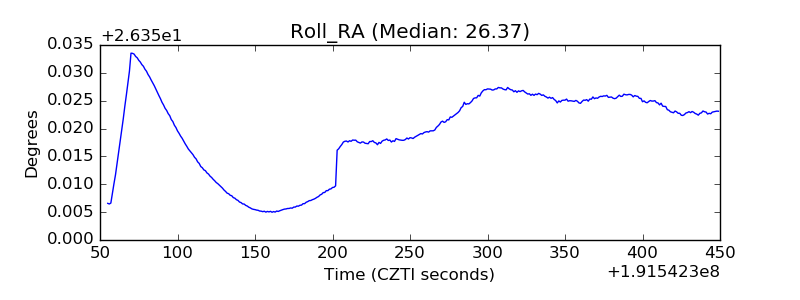 |
| Veto Counter | 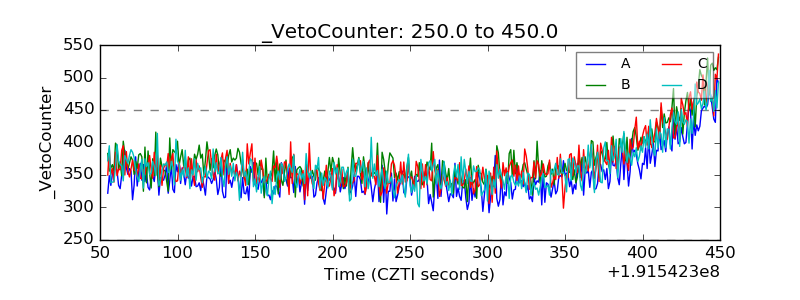 |