| Param | Original file | Final file |
|---|---|---|
| Filename | modeM0/AS1G02_020T01_9000000296_01793cztM0_level2.evt | modeM0/AS1G02_020T01_9000000296_01793cztM0_level2_quad_clean.evt |
| Size (bytes) | 1,080,446,400 | 82,722,240 |
| Size | 1.0 GB | 78.9 MB |
| Events in quadrant A | 8,213,825 | 513,645 |
| Events in quadrant B | 8,445,200 | 522,995 |
| Events in quadrant C | 7,854,765 | 509,336 |
| Events in quadrant D | 7,769,511 | 497,860 |
| Mode M9 | |||
|---|---|---|---|
| Quadrant | BADHDUFLAG | Total packets | Discarded packets |
| A | 0 | 1 | 0 |
| B | 1 | 1 | 0 |
| C | 1 | -1 | -1 |
| D | 1 | -1 | -1 |
| Mode SS | |||
|---|---|---|---|
| Quadrant | BADHDUFLAG | Total packets | Discarded packets |
| A | 0 | 132 | 0 |
| B | 0 | 132 | 0 |
| C | 0 | 132 | 0 |
| D | 0 | 132 | 0 |
| Mode M0 | |||
|---|---|---|---|
| Quadrant | BADHDUFLAG | Total packets | Discarded packets |
| A | 0 | 29083 | 2 |
| B | 0 | 29830 | 10 |
| C | 0 | 28073 | 2 |
| D | 0 | 27781 | 2 |
| Quadrant | Total seconds | Saturated seconds | Saturation percentage |
|---|---|---|---|
| A | 6614 | 58 | 0.876928% |
| B | 6612 | 67 | 1.013309% |
| C | 6614 | 51 | 0.771092% |
| D | 6614 | 71 | 1.073480% |
Noise dominated data is calculated using 1-second bins in cleaned event files. If a bin has >2000 counts, and if more than 50% of those come from <1% of pixels, then it is considered to be noise-dominated and hence unusable.
| Quadrant | # 1 sec bins | Bins with >0 counts | Bins with >2000 counts | High rate bins dominated by noise | Noise dominated (total time) | Noise dominated (detector-on time) | Marked lightcurve |
|---|---|---|---|---|---|---|---|
| A | 8919 | 6615 | 275 | 275 | 3.08% | 4.16% |  |
| B | 8919 | 6614 | 306 | 306 | 3.43% | 4.63% | 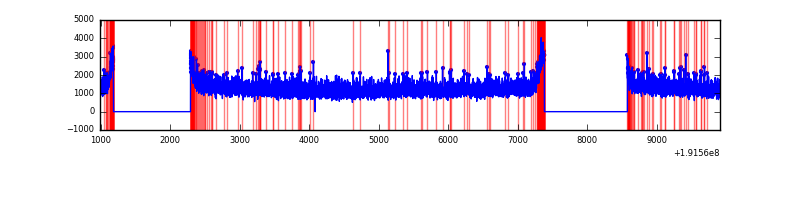 |
| C | 8919 | 6615 | 238 | 238 | 2.67% | 3.60% |  |
| D | 8919 | 6615 | 300 | 300 | 3.36% | 4.54% | 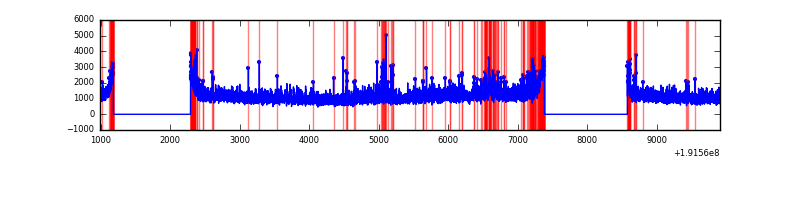 |
Top three noisy pixels from each quadrant. If the there are fewer than three noisy pixels in the level2.evt file, extra rows are filled as -1
| Pixel properties | Quadrant properties | ||||||
|---|---|---|---|---|---|---|---|
| Quadrant | DetID | PixID | Counts | Sigma | Mean | Median | Sigma |
| A | 0 | 231 | 46175 | 86.45 | 2135 | 2150 | 509.2 |
| A | 15 | 143 | 5676 | 6.92 | 2135 | 2150 | 509.2 |
| A | 13 | 9 | 5519 | 6.62 | 2135 | 2150 | 509.2 |
| B | 4 | 200 | 11599 | 17.89 | 2224 | 2237 | 523.3 |
| B | 0 | 234 | 7894 | 10.81 | 2224 | 2237 | 523.3 |
| B | 0 | 244 | 6532 | 8.21 | 2224 | 2237 | 523.3 |
| C | 10 | 82 | 78703 | 138.26 | 1989 | 2055 | 554.4 |
| C | 9 | 236 | 8816 | 12.2 | 1989 | 2055 | 554.4 |
| C | 14 | 223 | 7513 | 9.85 | 1989 | 2055 | 554.4 |
| D | 10 | 199 | 245299 | 409.09 | 1919 | 1987 | 594.8 |
| D | 13 | 169 | 211660 | 352.53 | 1919 | 1987 | 594.8 |
| D | 7 | 85 | 66849 | 109.05 | 1919 | 1987 | 594.8 |
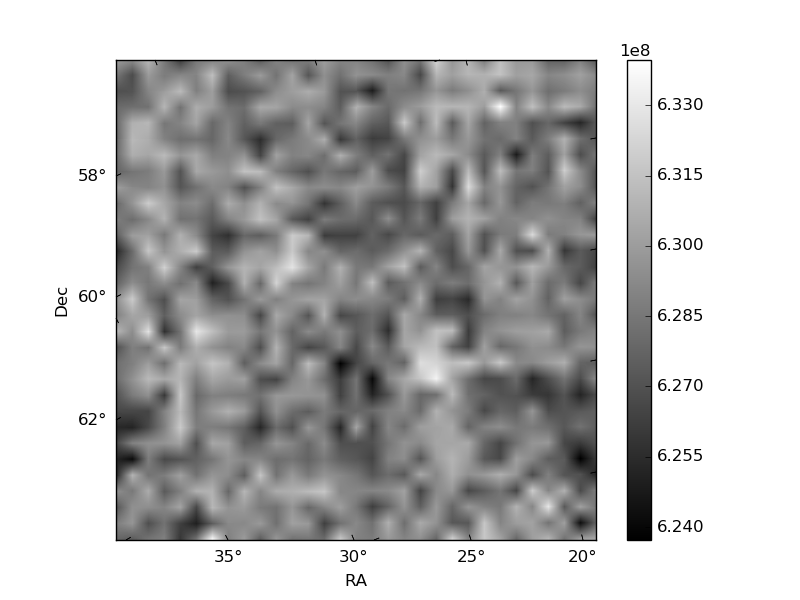
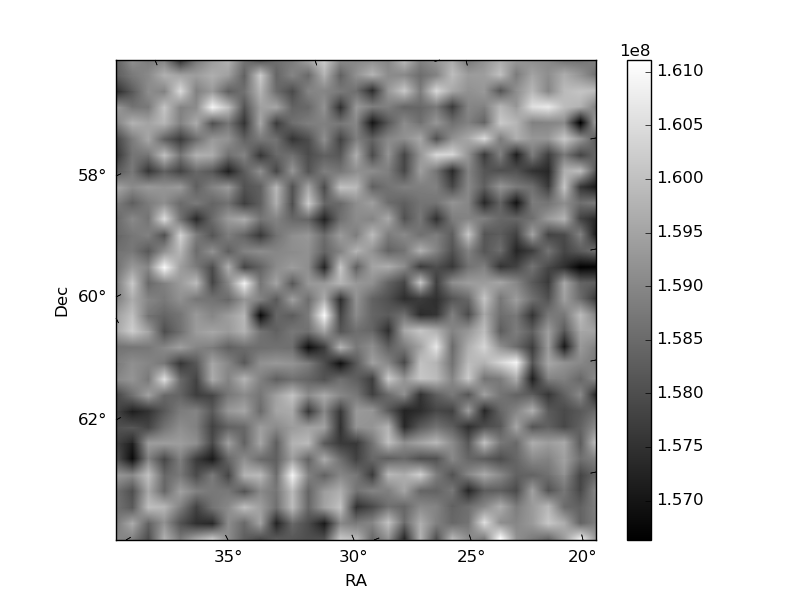
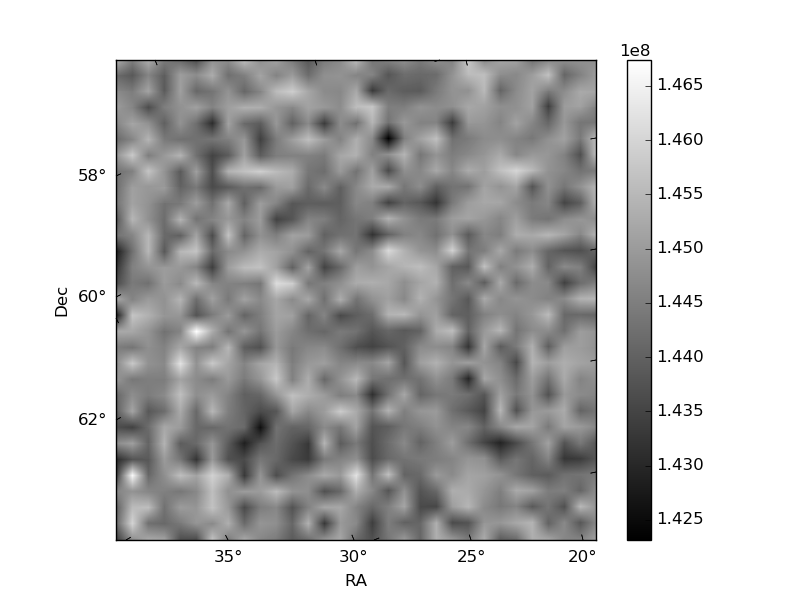
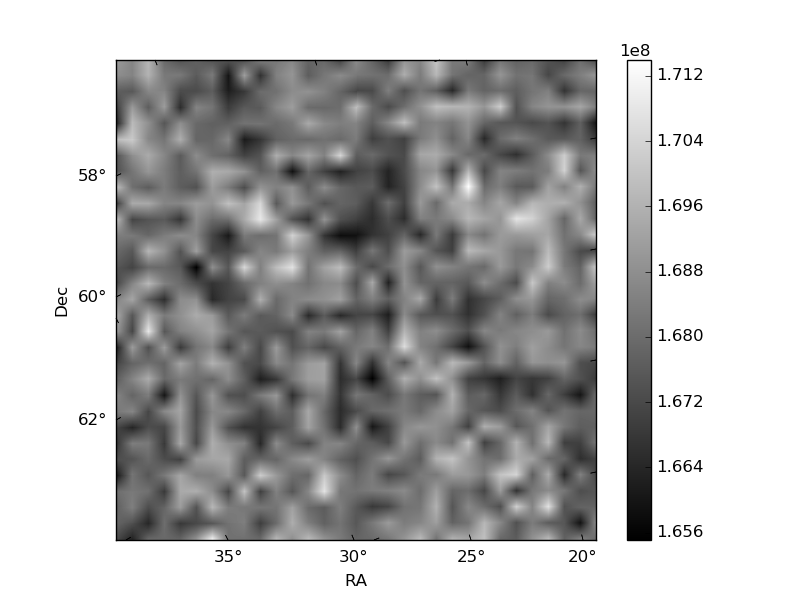
Histogram calculated using DETX and DETY for each event in the final _common_clean file
| Quadrant A | 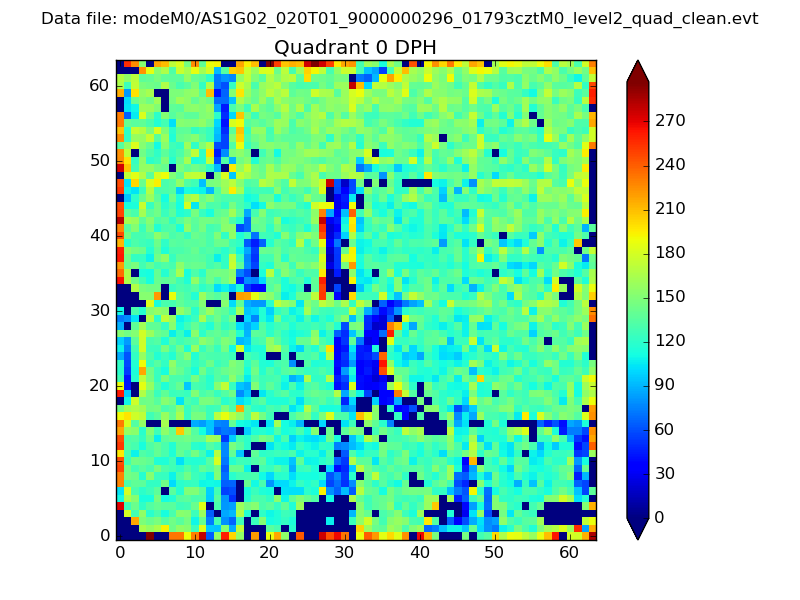 |
 |
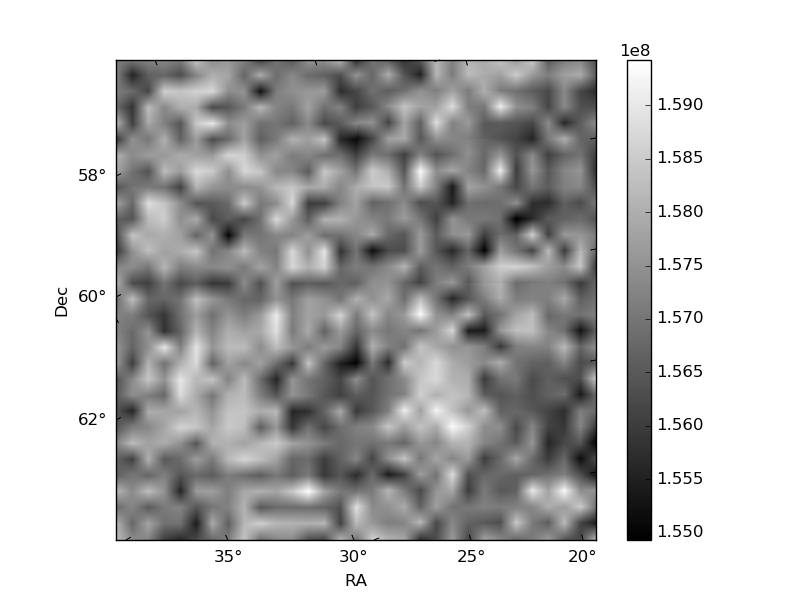
Quadrant B |
|---|---|---|---|
| Quadrant D | 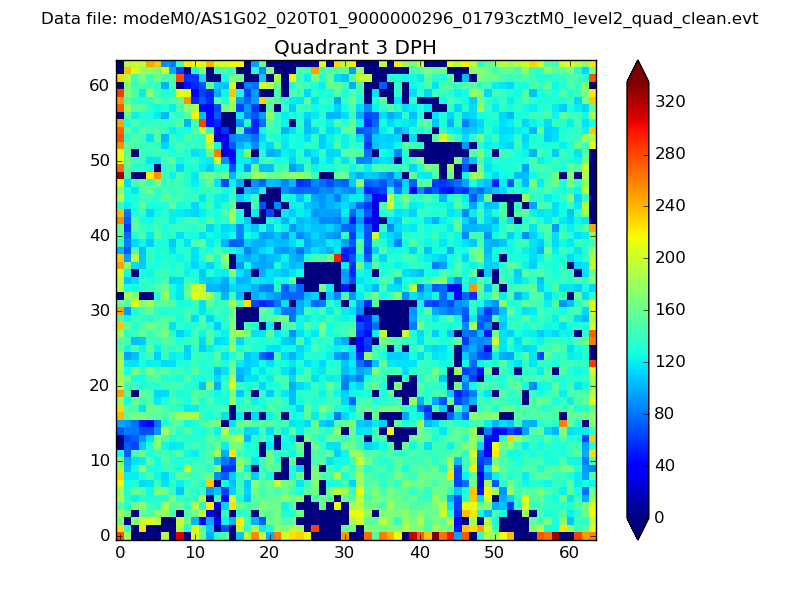 |
 |
Quadrant C |
| Plot type | Count rate plots | Images |
|---|---|---|
| Comparison with Poisson distribution Blue bars denote a histogram of data divided into 1 sec bins. Red curve is a Poisson curve with rate = median count rate of data. |
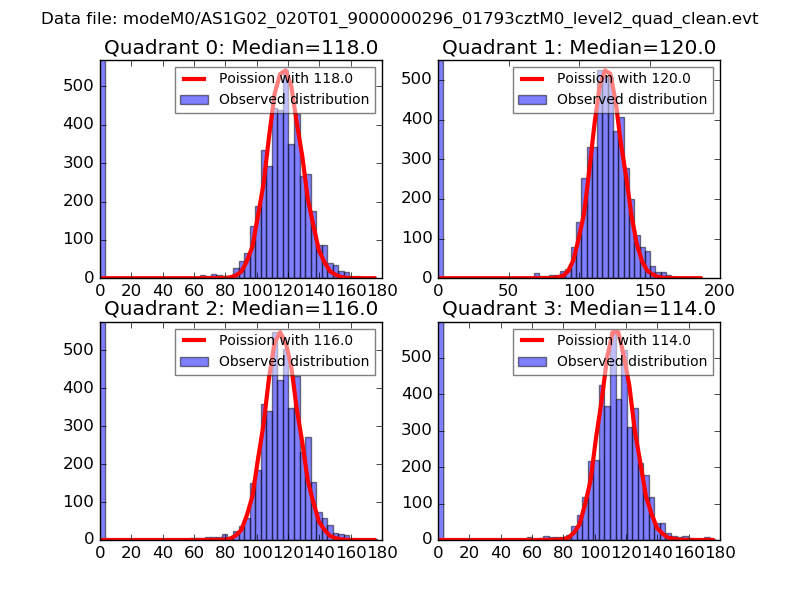 |
 |
| Quadrant-wise count rates Data is divided into 100 sec bins |
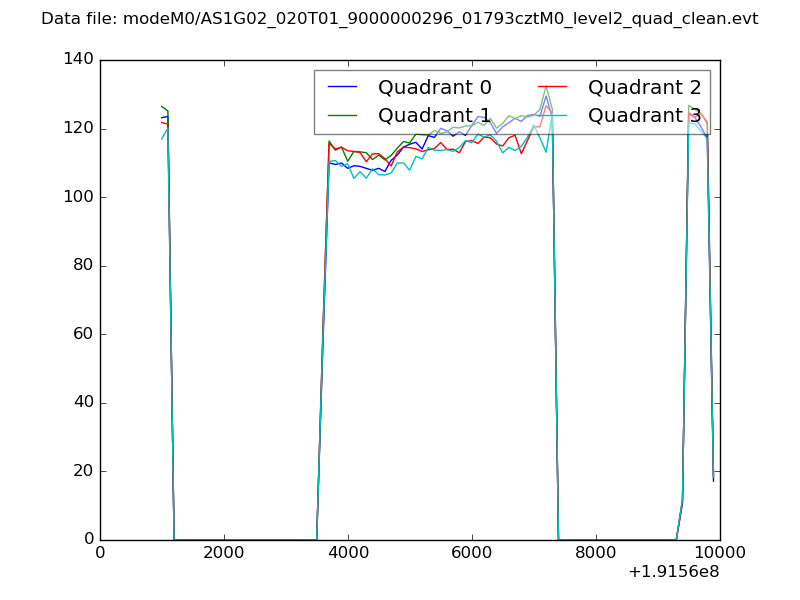 |
|
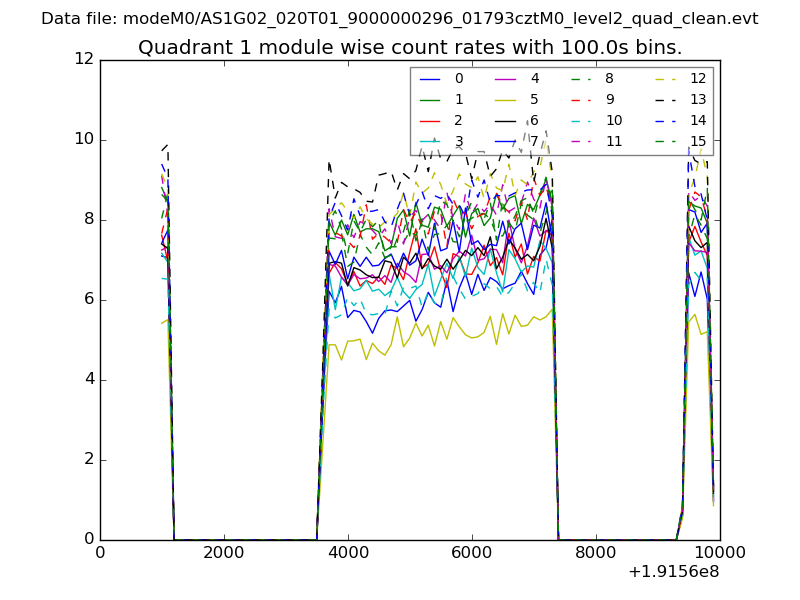
| Module-wise count rates for Quadrant A Data is divided into 100 sec bins |
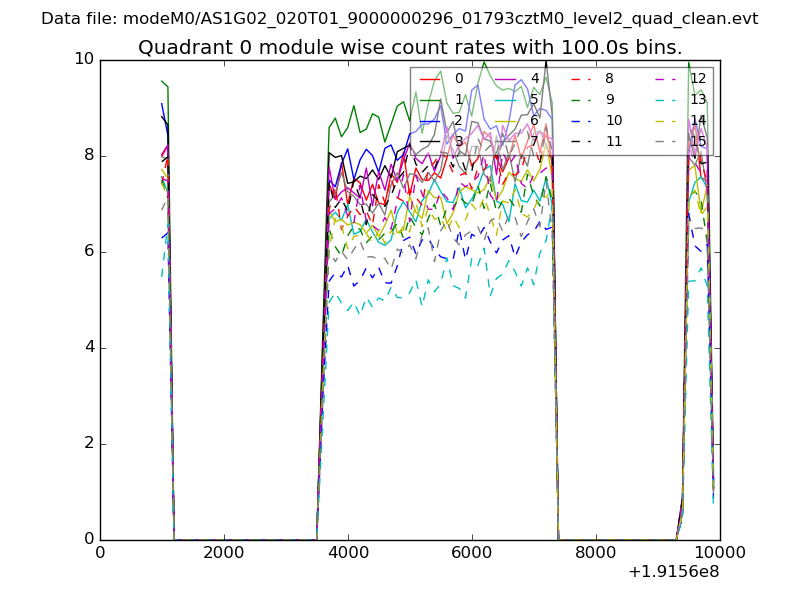 |
 |
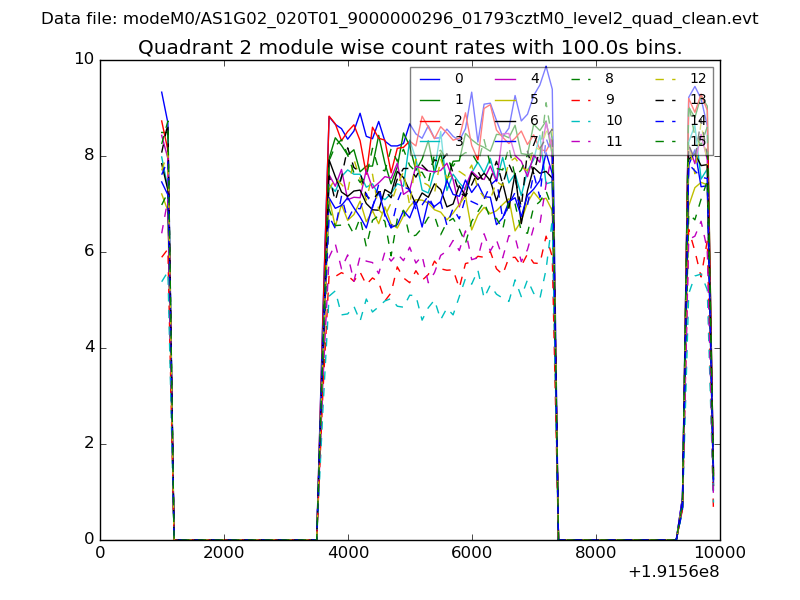
| Module-wise count rates for Quadrant B Data is divided into 100 sec bins |
 |
 |
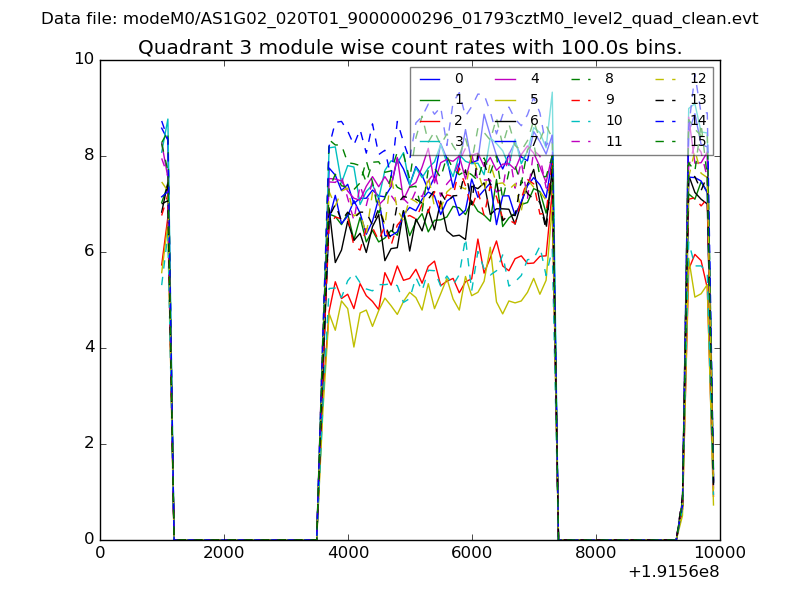
| Module-wise count rates for Quadrant C Data is divided into 100 sec bins |
 |
 |
| Module-wise count rates for Quadrant D Data is divided into 100 sec bins |
 |
 |
| Parameter | Plot |
|---|---|
| CZT HV Monitor | 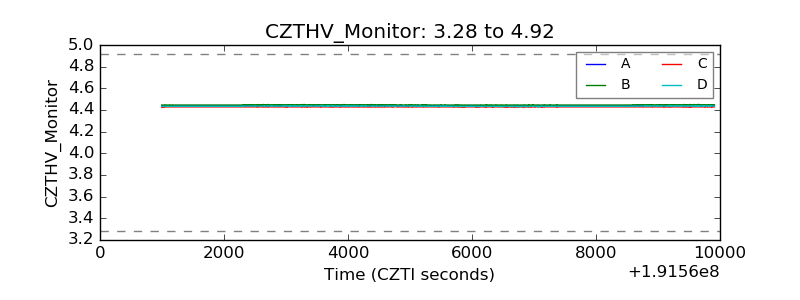 |
| D_VDD | 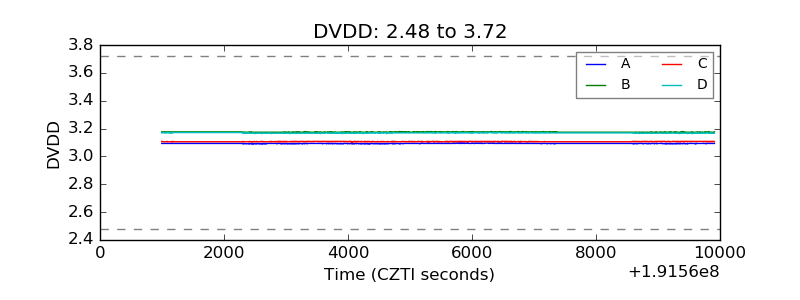 |
| Temperature 1 | 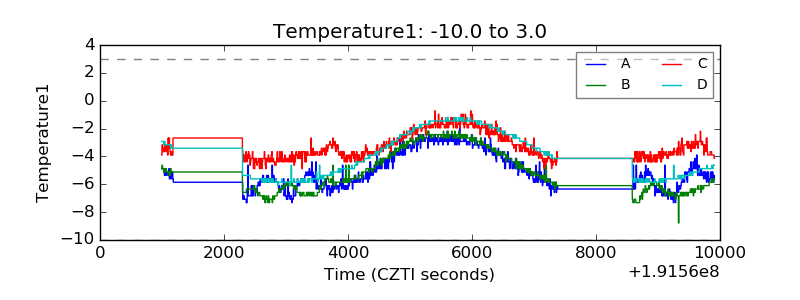 |
| Veto HV Monitor | 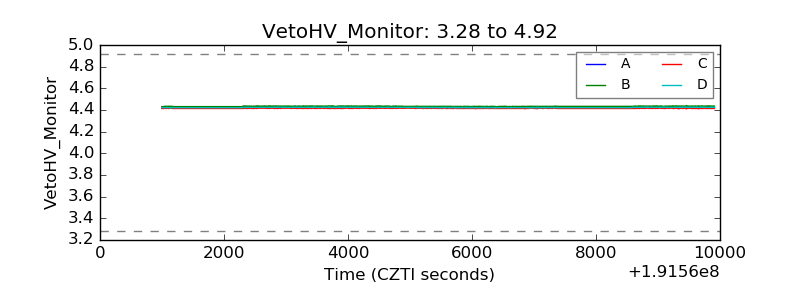 |
| Veto LLD | 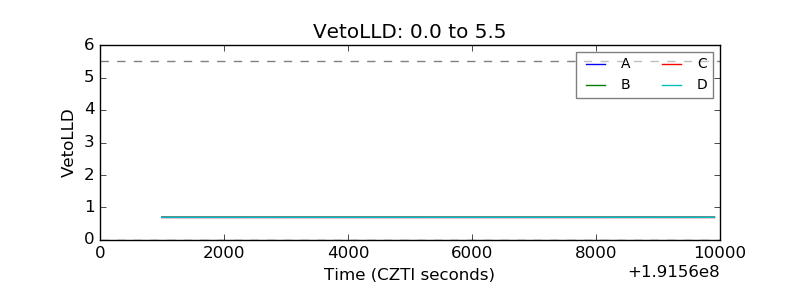 |
| Alpha Counter | 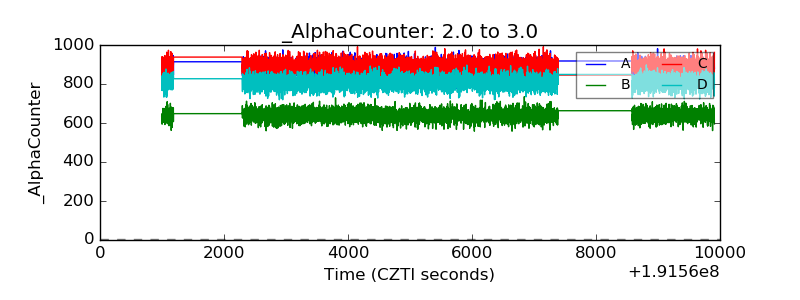 |
| _CPM_Rate | 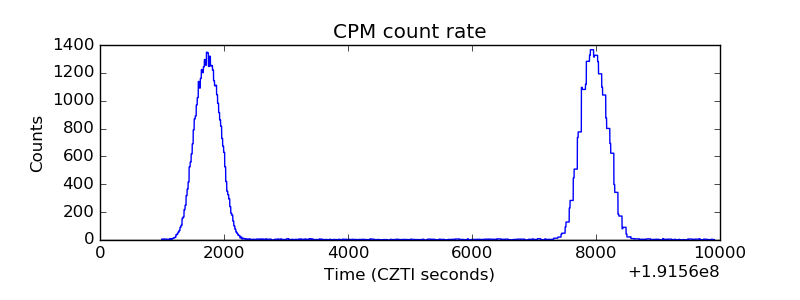 |
| CZT Counter | 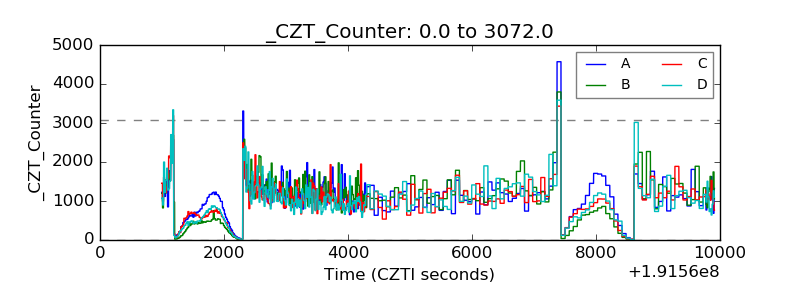 |
| +2.5 Volts monitor |  |
| +5 Volts monitor |  |
| _ROLL_ROT | 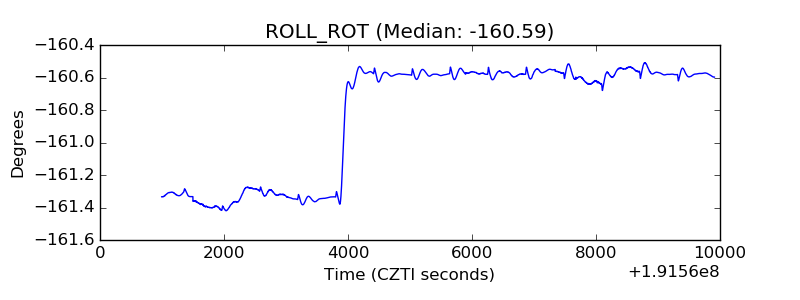 |
| _Roll_DEC | 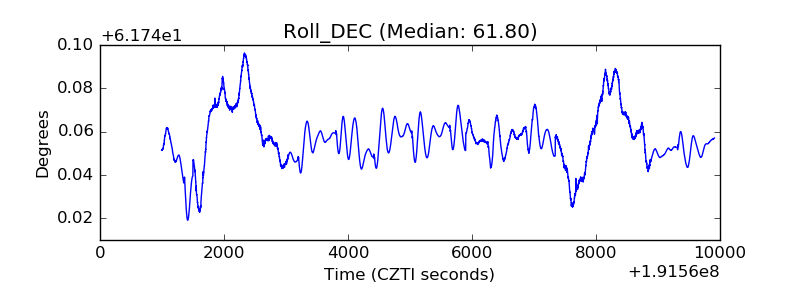 |
| _Roll_RA | 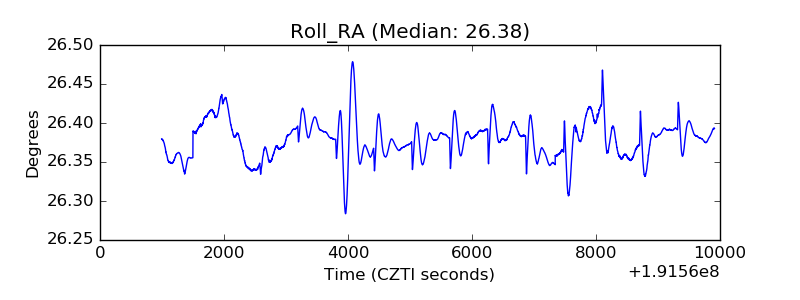 |
| Veto Counter | 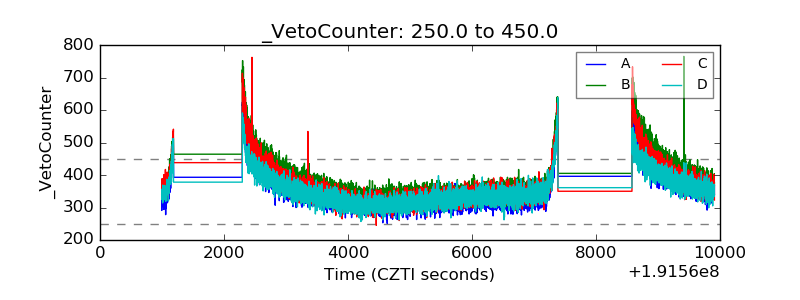 |