| Param | Original file | Final file |
|---|---|---|
| Filename | modeM0/AS1G02_020T01_9000000296_01794cztM0_level2.evt | modeM0/AS1G02_020T01_9000000296_01794cztM0_level2_quad_clean.evt |
| Size (bytes) | 1,049,397,120 | 92,171,520 |
| Size | 1000.8 MB | 87.9 MB |
| Events in quadrant A | 7,798,585 | 593,279 |
| Events in quadrant B | 8,031,941 | 603,169 |
| Events in quadrant C | 8,299,861 | 579,945 |
| Events in quadrant D | 7,231,540 | 573,360 |
| Mode M9 | |||
|---|---|---|---|
| Quadrant | BADHDUFLAG | Total packets | Discarded packets |
| A | 0 | 1 | 0 |
| B | 1 | 1 | 0 |
| C | 1 | -1 | -1 |
| D | 1 | -1 | -1 |
| Mode SS | |||
|---|---|---|---|
| Quadrant | BADHDUFLAG | Total packets | Discarded packets |
| A | 0 | 126 | 0 |
| B | 0 | 126 | 0 |
| C | 0 | 126 | 0 |
| D | 0 | 126 | 0 |
| Mode M0 | |||
|---|---|---|---|
| Quadrant | BADHDUFLAG | Total packets | Discarded packets |
| A | 0 | 27659 | 10 |
| B | 0 | 28395 | 2 |
| C | 0 | 29108 | 14 |
| D | 0 | 25985 | 2 |
| Quadrant | Total seconds | Saturated seconds | Saturation percentage |
|---|---|---|---|
| A | 6328 | 49 | 0.774336% |
| B | 6330 | 50 | 0.789889% |
| C | 6328 | 77 | 1.216814% |
| D | 6330 | 31 | 0.489731% |
Noise dominated data is calculated using 1-second bins in cleaned event files. If a bin has >2000 counts, and if more than 50% of those come from <1% of pixels, then it is considered to be noise-dominated and hence unusable.
| Quadrant | # 1 sec bins | Bins with >0 counts | Bins with >2000 counts | High rate bins dominated by noise | Noise dominated (total time) | Noise dominated (detector-on time) | Marked lightcurve |
|---|---|---|---|---|---|---|---|
| A | 7540 | 6330 | 229 | 229 | 3.04% | 3.62% | 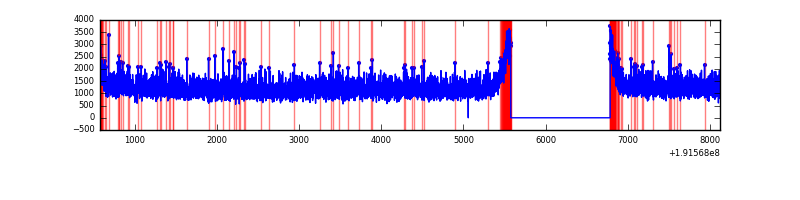 |
| B | 7540 | 6330 | 275 | 275 | 3.65% | 4.34% | 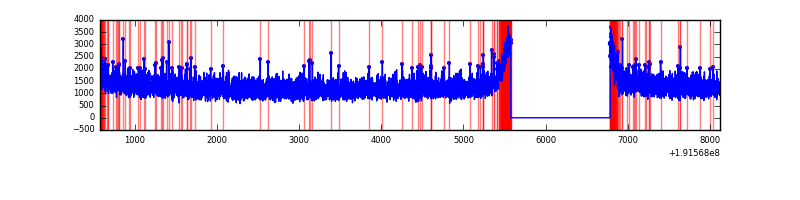 |
| C | 7540 | 6330 | 597 | 597 | 7.92% | 9.43% | 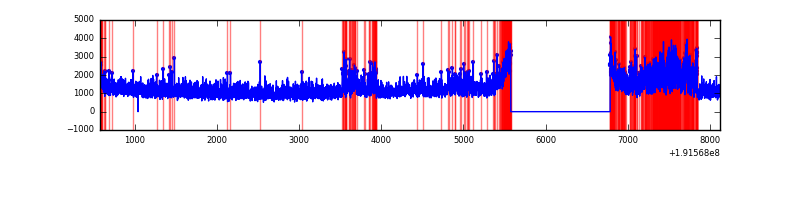 |
| D | 7540 | 6331 | 193 | 193 | 2.56% | 3.05% | 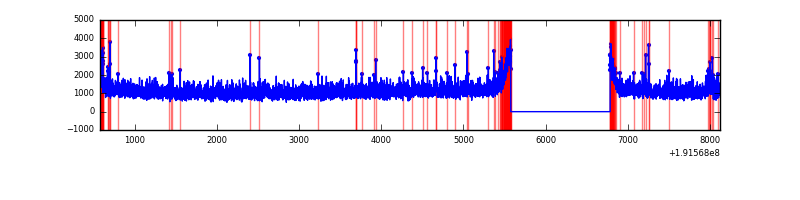 |
Top three noisy pixels from each quadrant. If the there are fewer than three noisy pixels in the level2.evt file, extra rows are filled as -1
| Pixel properties | Quadrant properties | ||||||
|---|---|---|---|---|---|---|---|
| Quadrant | DetID | PixID | Counts | Sigma | Mean | Median | Sigma |
| A | 10 | 2 | 6298 | 8.71 | 2039 | 2053 | 487.3 |
| A | -1 | -1 | -1 | -1.0 | 2039 | 2053 | 487.3 |
| A | -1 | -1 | -1 | -1.0 | 2039 | 2053 | 487.3 |
| B | 4 | 200 | 13515 | 22.84 | 2116 | 2129 | 498.5 |
| B | 0 | 234 | 7239 | 10.25 | 2116 | 2129 | 498.5 |
| B | -1 | -1 | -1 | -1.0 | 2116 | 2129 | 498.5 |
| C | 8 | 208 | 943967 | 1807.81 | 1877 | 1935 | 521.1 |
| C | 10 | 82 | 17795 | 30.44 | 1877 | 1935 | 521.1 |
| C | 9 | 236 | 8410 | 12.43 | 1877 | 1935 | 521.1 |
| D | 13 | 169 | 129685 | 225.02 | 1847 | 1914 | 567.8 |
| D | 10 | 199 | 90339 | 155.72 | 1847 | 1914 | 567.8 |
| D | 7 | 85 | 64137 | 109.58 | 1847 | 1914 | 567.8 |
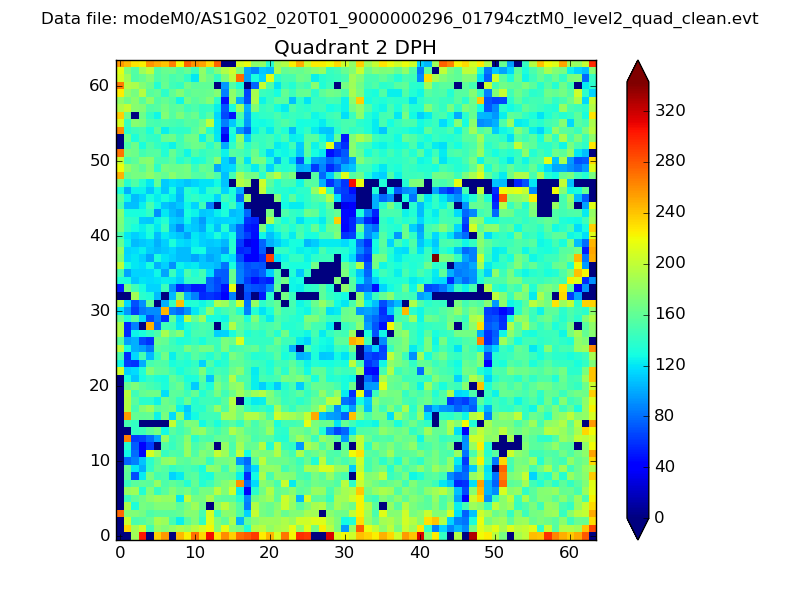
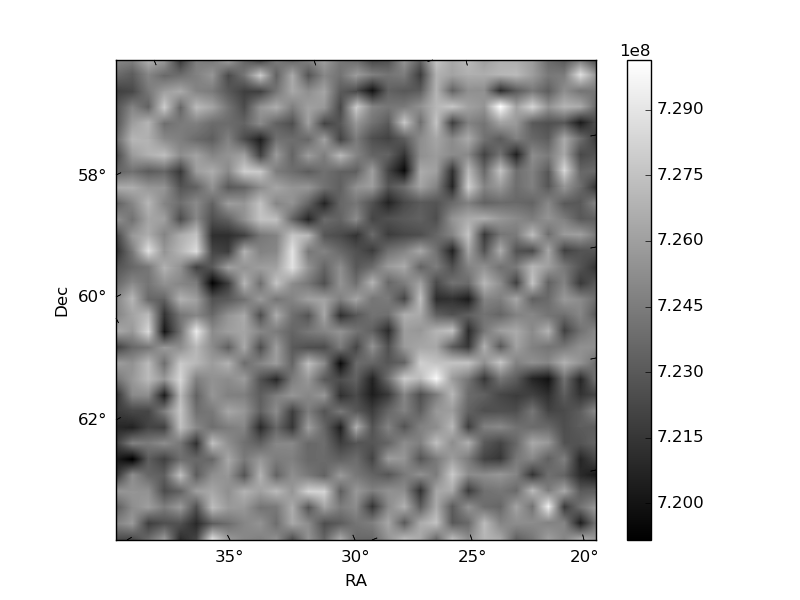
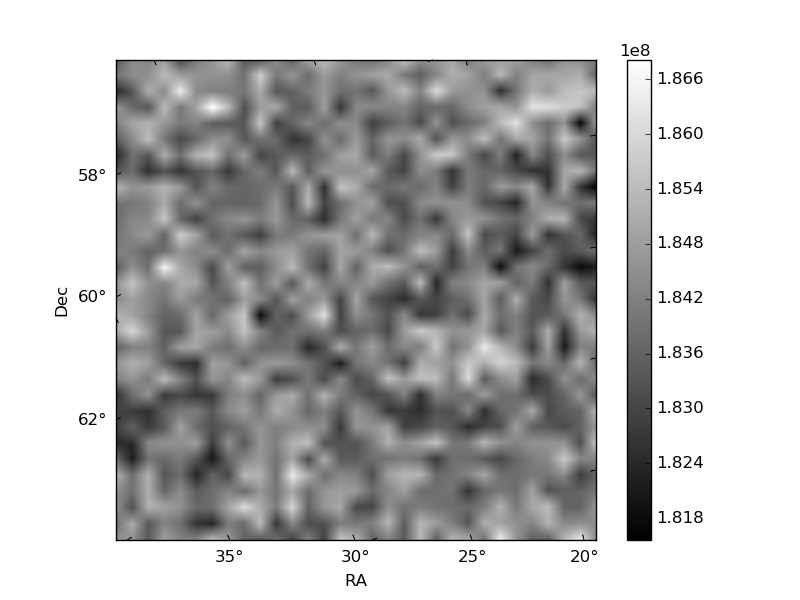
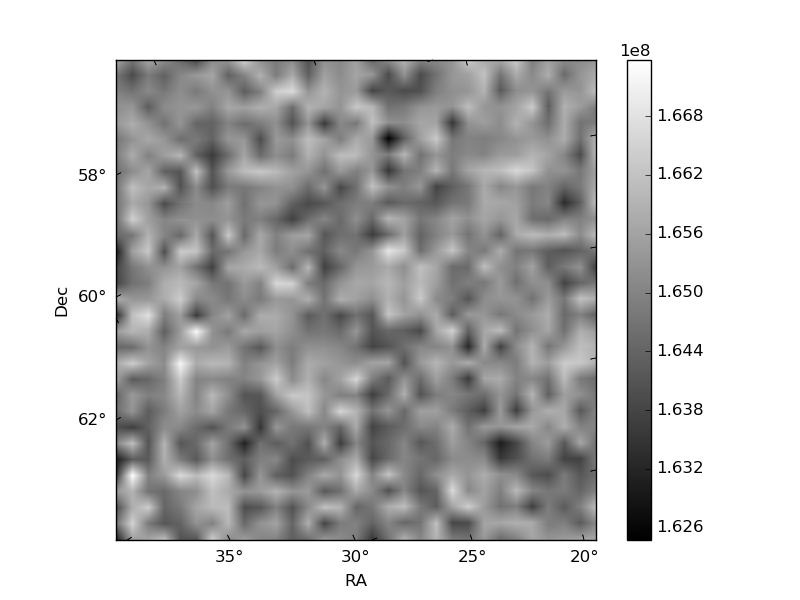
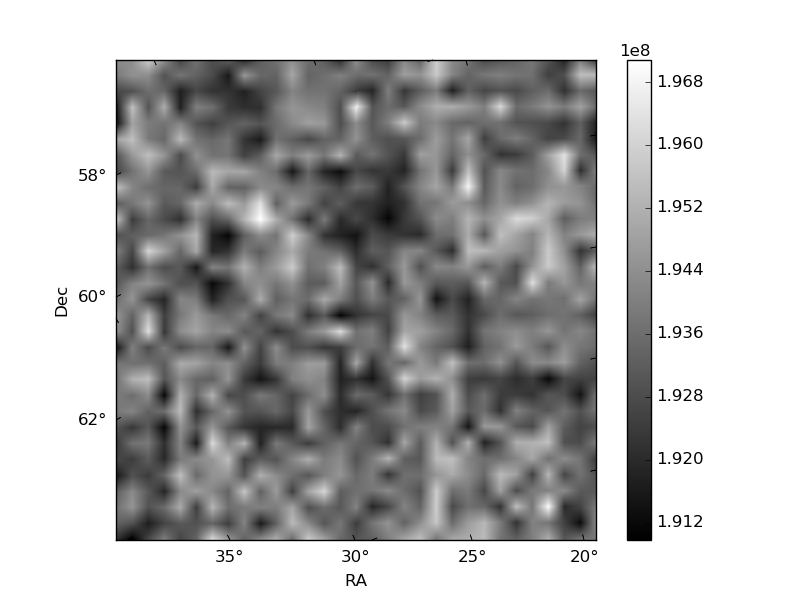
Histogram calculated using DETX and DETY for each event in the final _common_clean file
| Quadrant A | 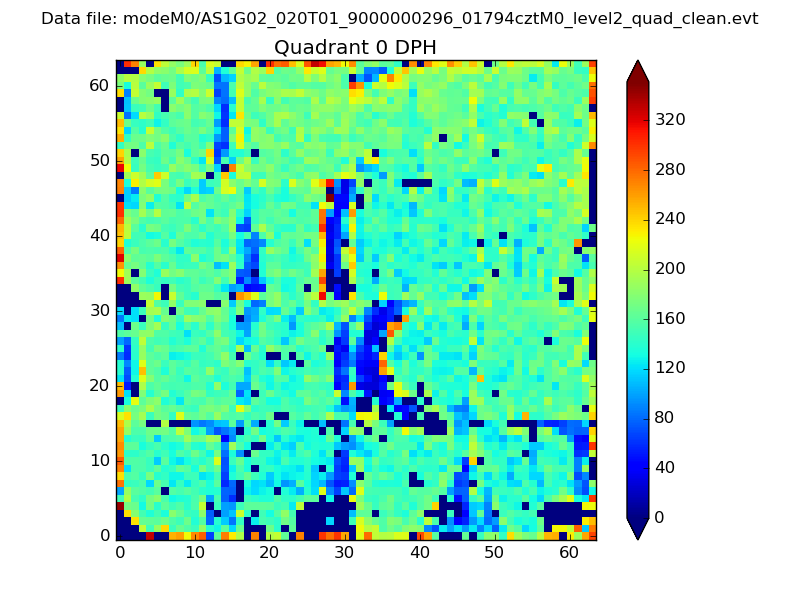 |
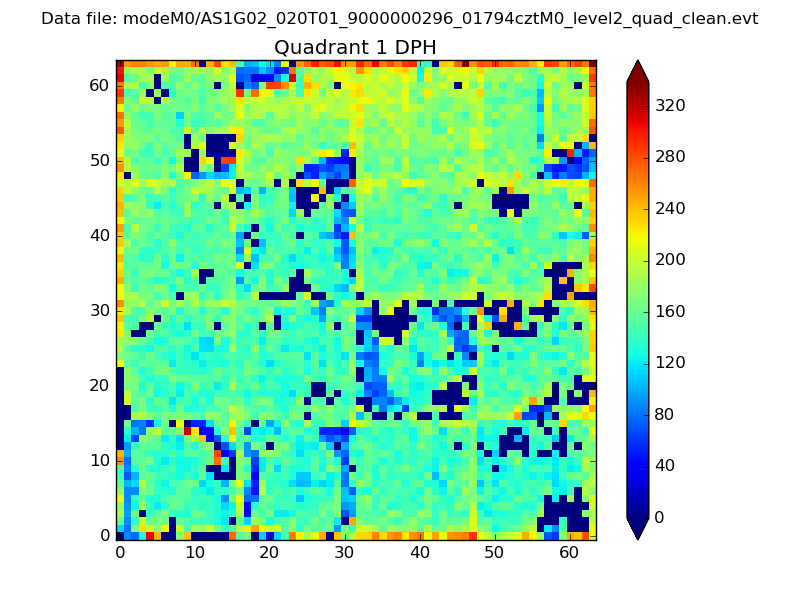 |
Quadrant B |
|---|---|---|---|
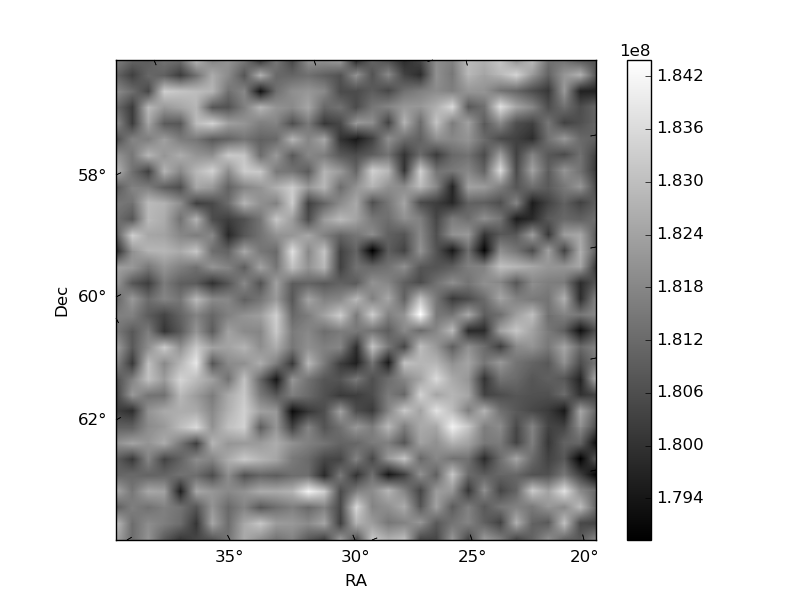
| Quadrant D | 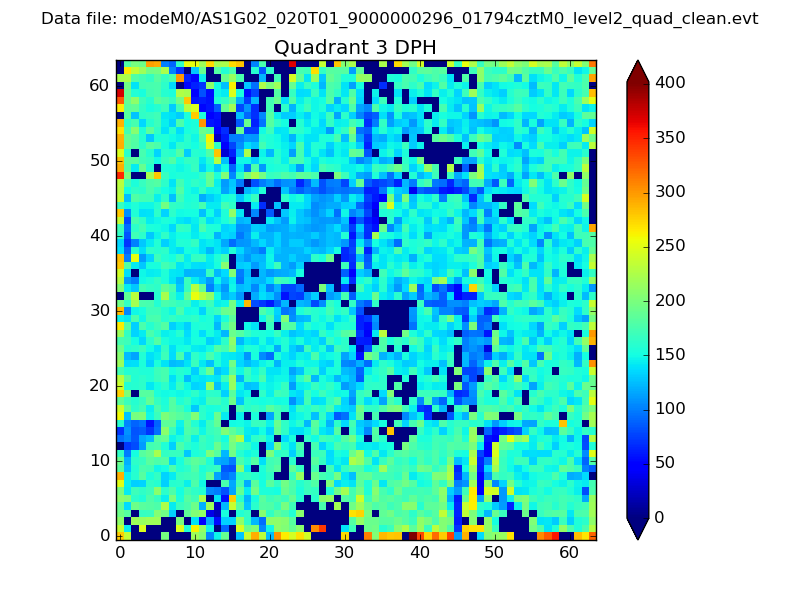 |
 |
Quadrant C |
| Plot type | Count rate plots | Images |
|---|---|---|
| Comparison with Poisson distribution Blue bars denote a histogram of data divided into 1 sec bins. Red curve is a Poisson curve with rate = median count rate of data. |
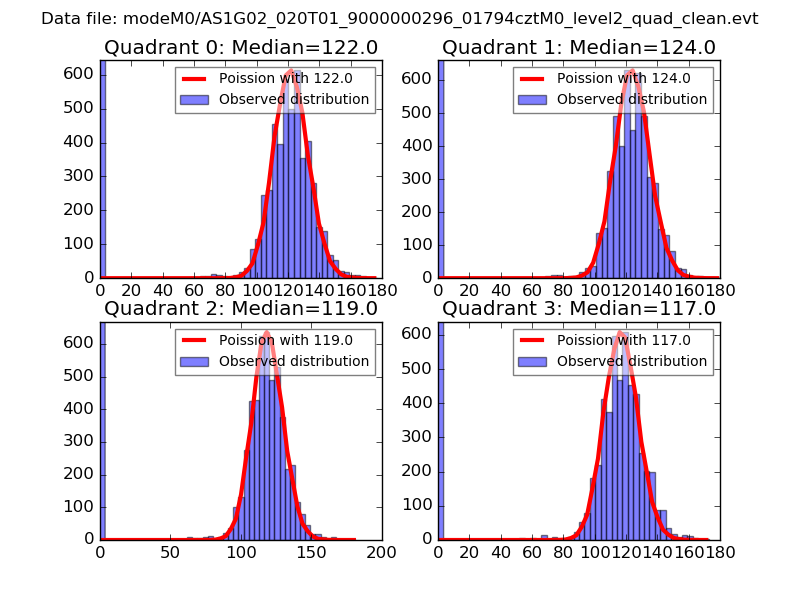 |
 |
| Quadrant-wise count rates Data is divided into 100 sec bins |
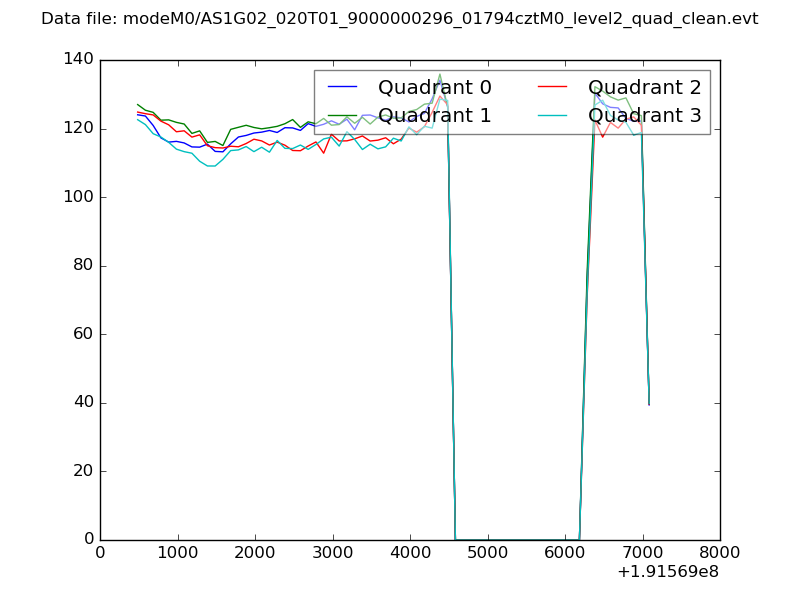 |
|
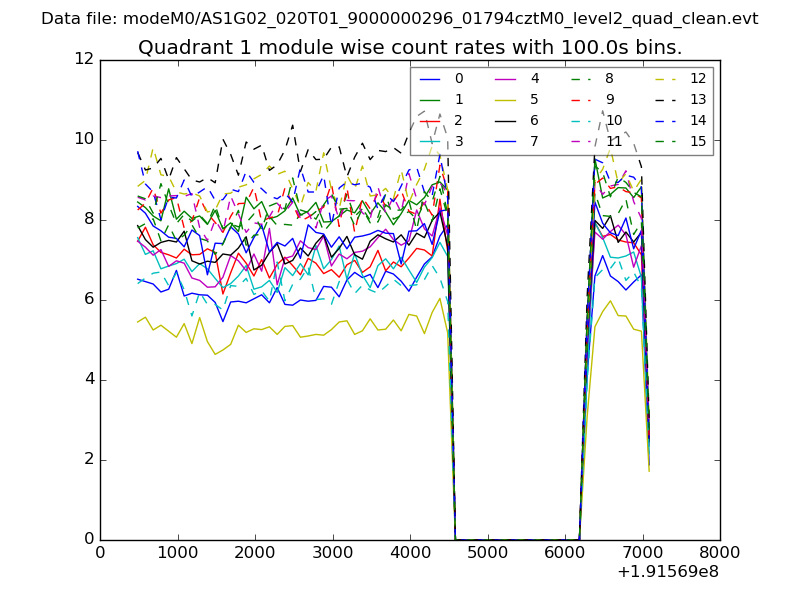
| Module-wise count rates for Quadrant A Data is divided into 100 sec bins |
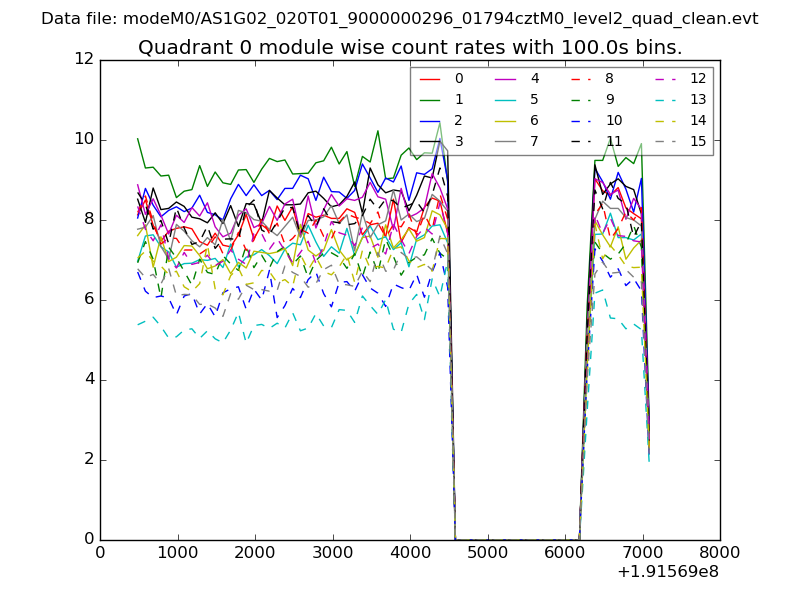 |
 |
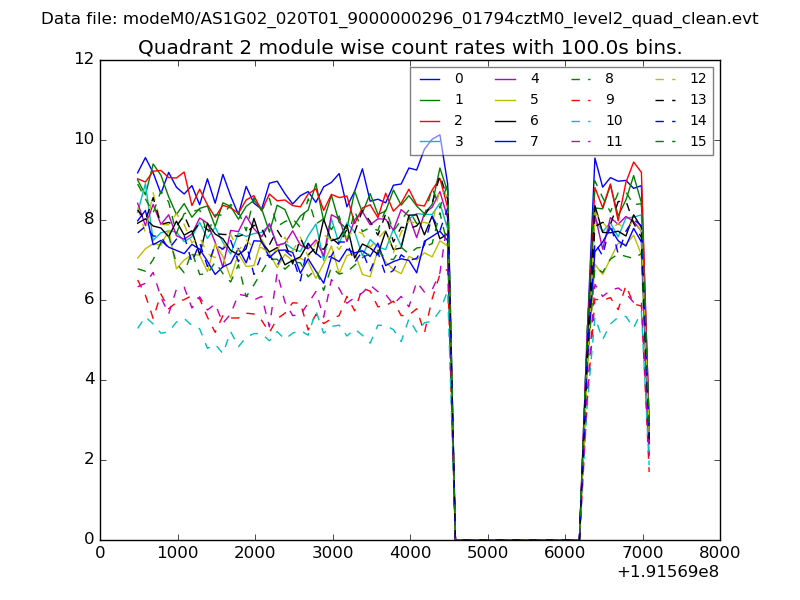
| Module-wise count rates for Quadrant B Data is divided into 100 sec bins |
 |
 |
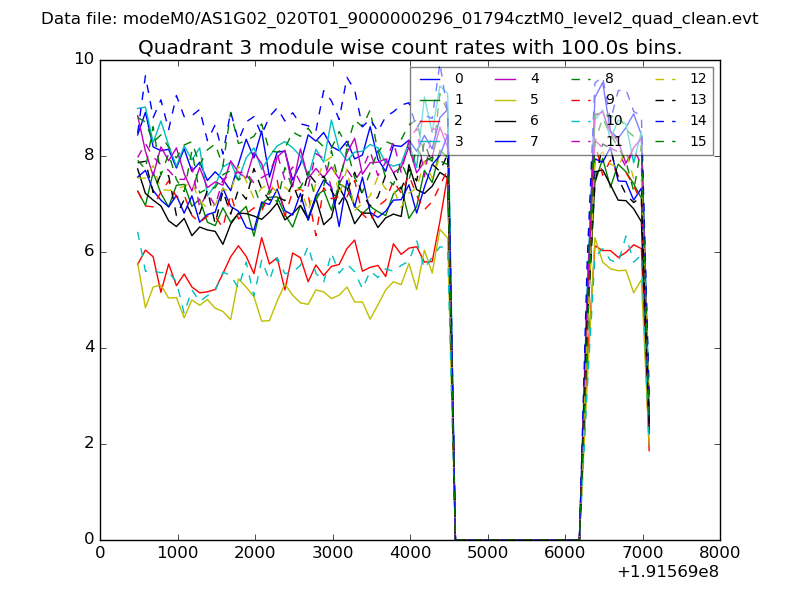
| Module-wise count rates for Quadrant C Data is divided into 100 sec bins |
 |
 |
| Module-wise count rates for Quadrant D Data is divided into 100 sec bins |
 |
 |
| Parameter | Plot |
|---|---|
| CZT HV Monitor |  |
| D_VDD | 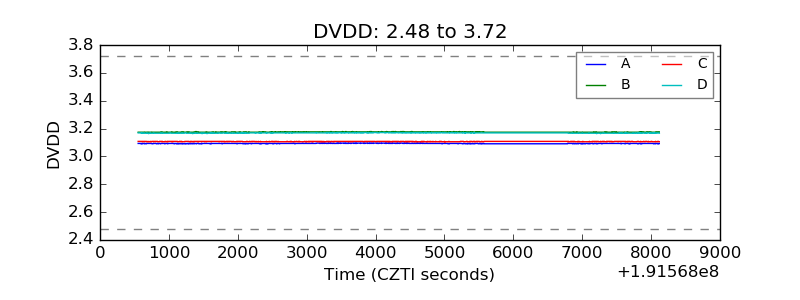 |
| Temperature 1 |  |
| Veto HV Monitor | 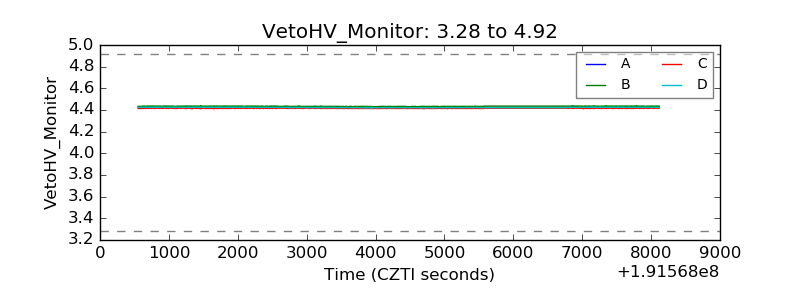 |
| Veto LLD | 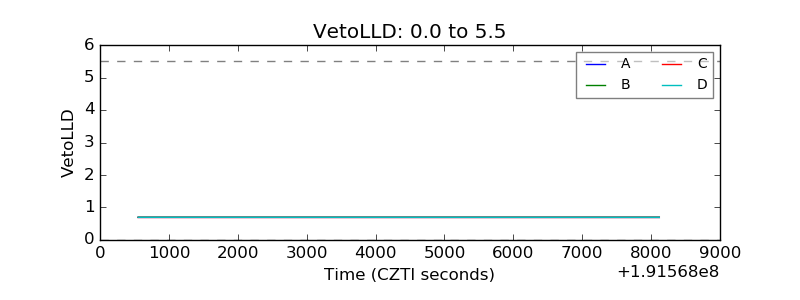 |
| Alpha Counter | 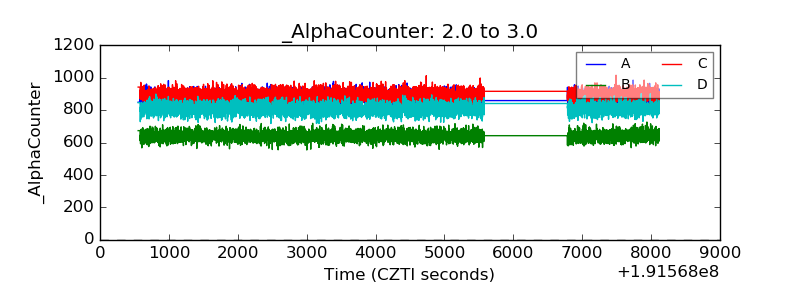 |
| _CPM_Rate | 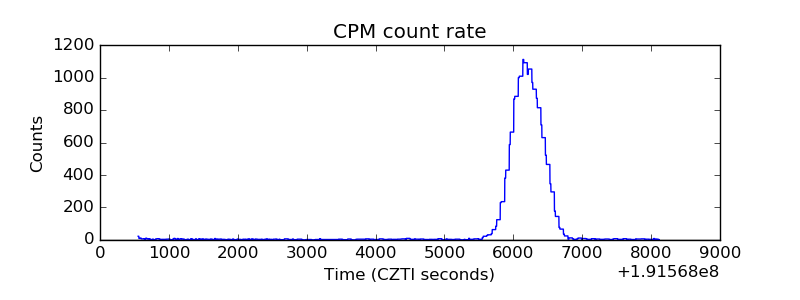 |
| CZT Counter | 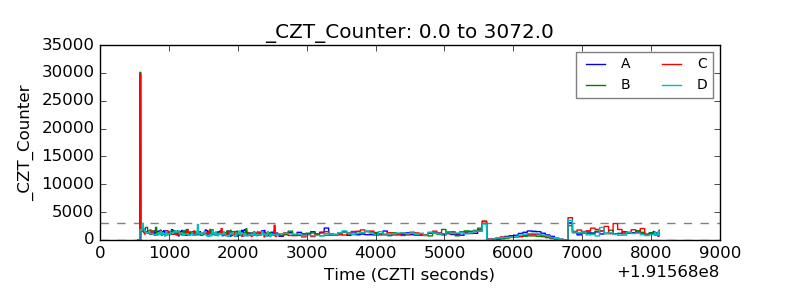 |
| +2.5 Volts monitor |  |
| +5 Volts monitor |  |
| _ROLL_ROT | 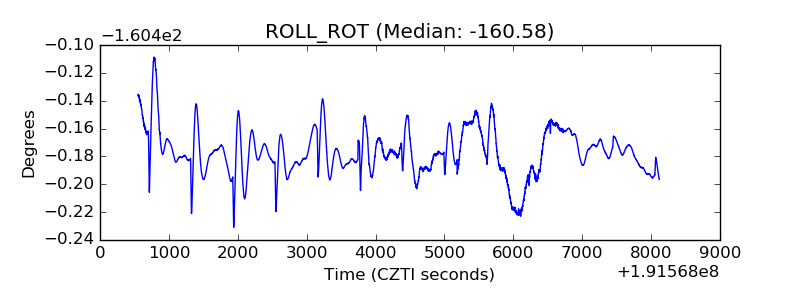 |
| _Roll_DEC | 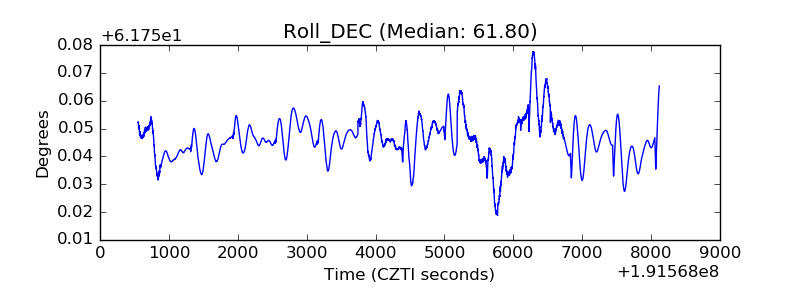 |
| _Roll_RA | 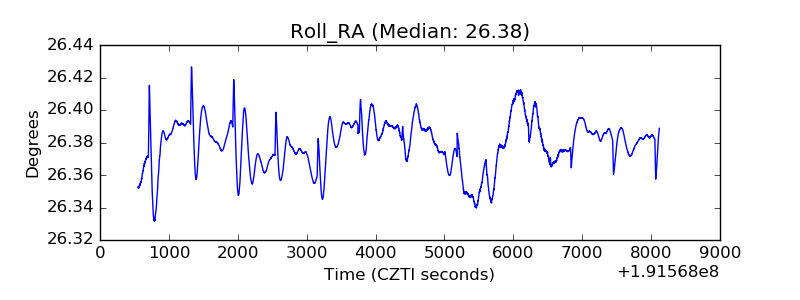 |
| Veto Counter | 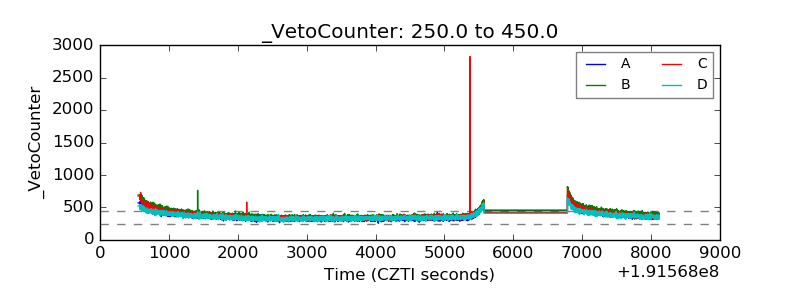 |