| Param | Original file | Final file |
|---|---|---|
| Filename | modeM0/AS1G02_020T01_9000000296_01795cztM0_level2.evt | modeM0/AS1G02_020T01_9000000296_01795cztM0_level2_quad_clean.evt |
| Size (bytes) | 1,010,600,640 | 99,230,400 |
| Size | 963.8 MB | 94.6 MB |
| Events in quadrant A | 7,394,446 | 655,482 |
| Events in quadrant B | 7,588,241 | 664,174 |
| Events in quadrant C | 8,051,193 | 633,710 |
| Events in quadrant D | 7,171,787 | 629,754 |
| Mode M9 | |||
|---|---|---|---|
| Quadrant | BADHDUFLAG | Total packets | Discarded packets |
| A | 0 | 1 | 0 |
| B | 1 | 1 | 0 |
| C | 1 | -1 | -1 |
| D | 1 | -1 | -1 |
| Mode SS | |||
|---|---|---|---|
| Quadrant | BADHDUFLAG | Total packets | Discarded packets |
| A | 0 | 122 | 0 |
| B | 0 | 122 | 0 |
| C | 0 | 122 | 0 |
| D | 0 | 122 | 0 |
| Mode M0 | |||
|---|---|---|---|
| Quadrant | BADHDUFLAG | Total packets | Discarded packets |
| A | 0 | 26281 | 1 |
| B | 0 | 26820 | 1 |
| C | 0 | 28181 | 1 |
| D | 0 | 25575 | 1 |
| Quadrant | Total seconds | Saturated seconds | Saturation percentage |
|---|---|---|---|
| A | 6041 | 51 | 0.844231% |
| B | 6041 | 55 | 0.910445% |
| C | 6041 | 93 | 1.539480% |
| D | 6041 | 53 | 0.877338% |
Noise dominated data is calculated using 1-second bins in cleaned event files. If a bin has >2000 counts, and if more than 50% of those come from <1% of pixels, then it is considered to be noise-dominated and hence unusable.
| Quadrant | # 1 sec bins | Bins with >0 counts | Bins with >2000 counts | High rate bins dominated by noise | Noise dominated (total time) | Noise dominated (detector-on time) | Marked lightcurve |
|---|---|---|---|---|---|---|---|
| A | 7241 | 6041 | 228 | 228 | 3.15% | 3.77% | 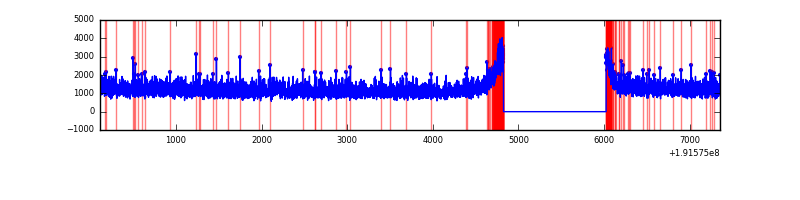 |
| B | 7241 | 6042 | 265 | 265 | 3.66% | 4.39% | 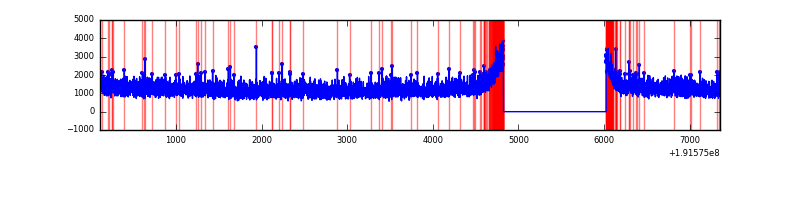 |
| C | 7241 | 6042 | 619 | 619 | 8.55% | 10.24% |  |
| D | 7241 | 6042 | 249 | 249 | 3.44% | 4.12% | 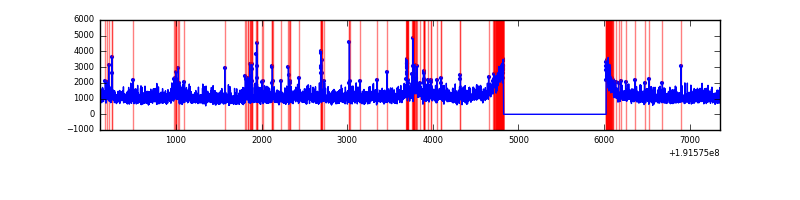 |
Top three noisy pixels from each quadrant. If the there are fewer than three noisy pixels in the level2.evt file, extra rows are filled as -1
| Pixel properties | Quadrant properties | ||||||
|---|---|---|---|---|---|---|---|
| Quadrant | DetID | PixID | Counts | Sigma | Mean | Median | Sigma |
| A | 15 | 236 | 13045 | 24.04 | 1927 | 1942 | 461.9 |
| A | 0 | 231 | 9842 | 17.1 | 1927 | 1942 | 461.9 |
| A | 10 | 2 | 8494 | 14.19 | 1927 | 1942 | 461.9 |
| B | 4 | 200 | 21730 | 42.04 | 1996 | 2006 | 469.2 |
| B | 0 | 234 | 6663 | 9.93 | 1996 | 2006 | 469.2 |
| B | 0 | 220 | 6376 | 9.31 | 1996 | 2006 | 469.2 |
| C | 8 | 208 | 1034382 | 2077.98 | 1781 | 1836 | 496.9 |
| C | 10 | 82 | 56005 | 109.01 | 1781 | 1836 | 496.9 |
| C | 9 | 236 | 10314 | 17.06 | 1781 | 1836 | 496.9 |
| D | 13 | 169 | 199141 | 367.09 | 1752 | 1817 | 537.5 |
| D | 7 | 34 | 139589 | 256.3 | 1752 | 1817 | 537.5 |
| D | 7 | 85 | 83954 | 152.8 | 1752 | 1817 | 537.5 |
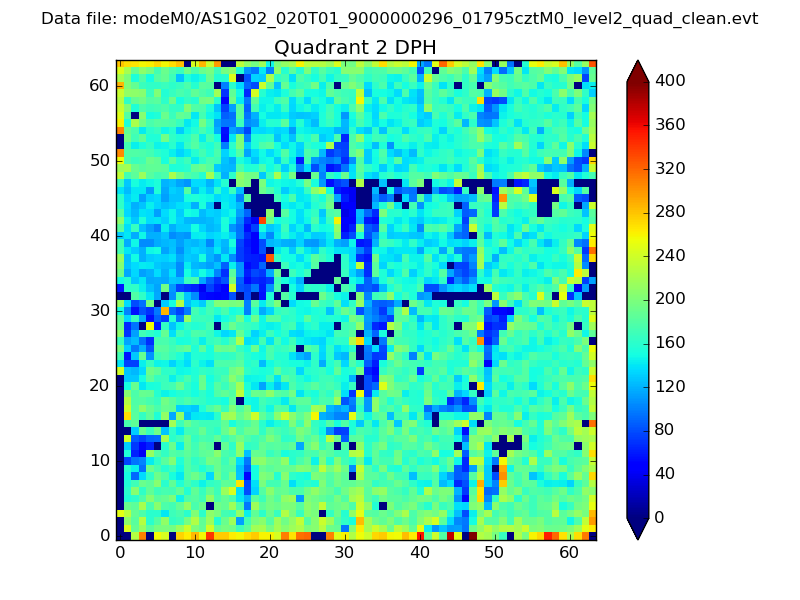
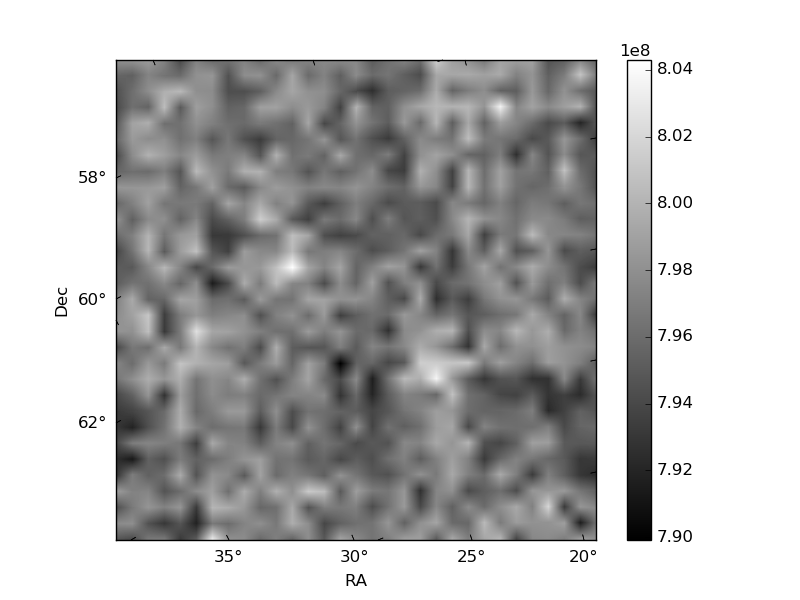
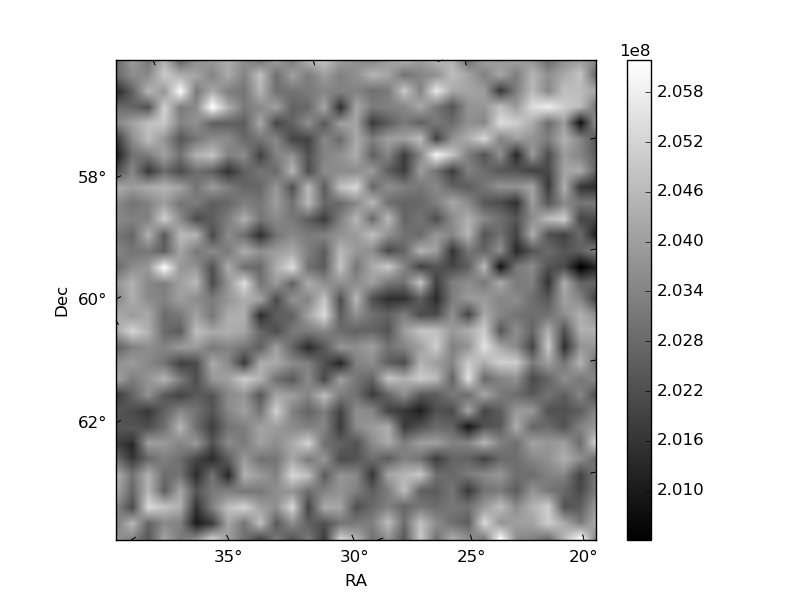
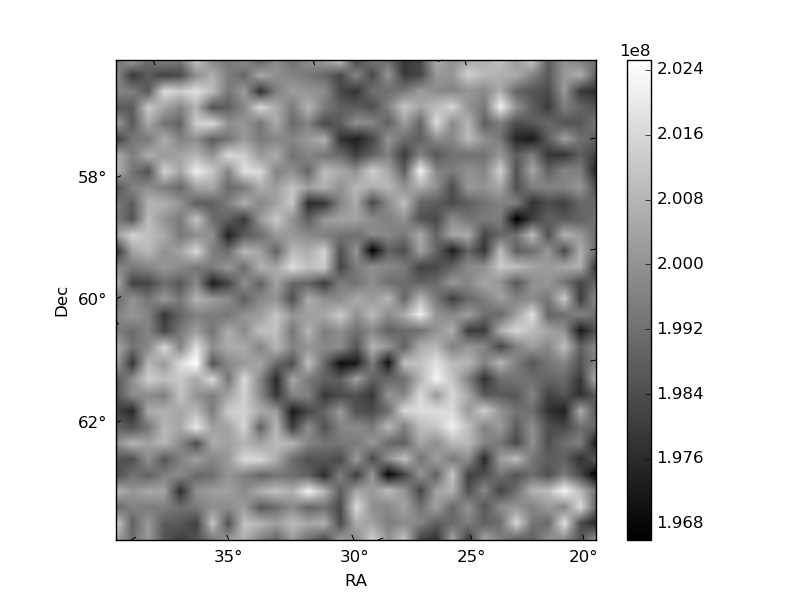
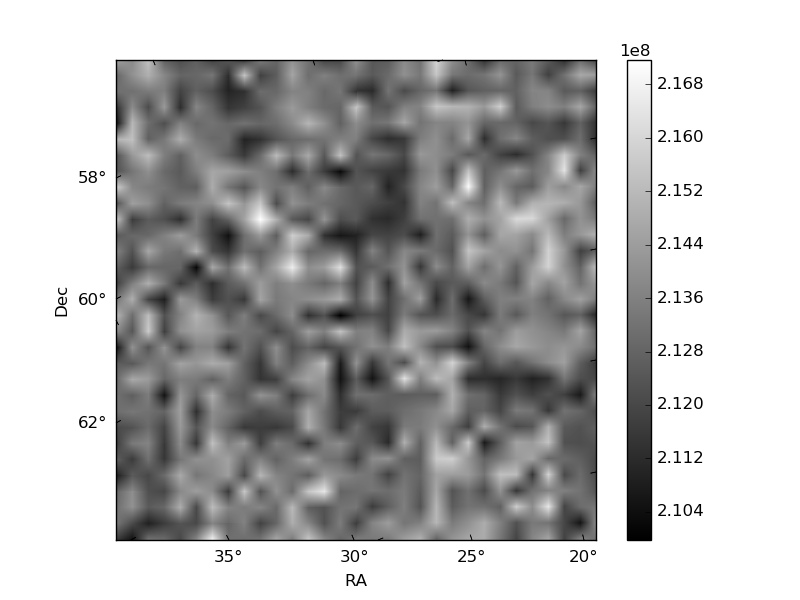
Histogram calculated using DETX and DETY for each event in the final _common_clean file
| Quadrant A | 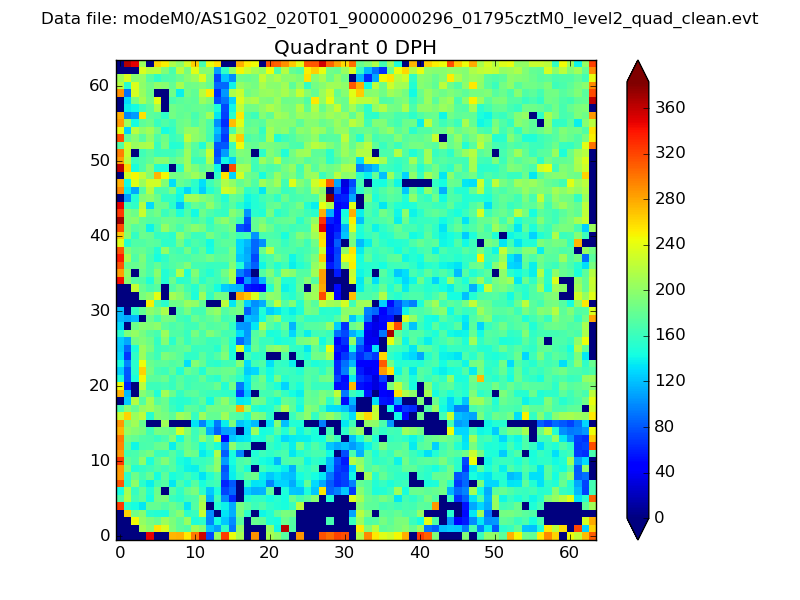 |
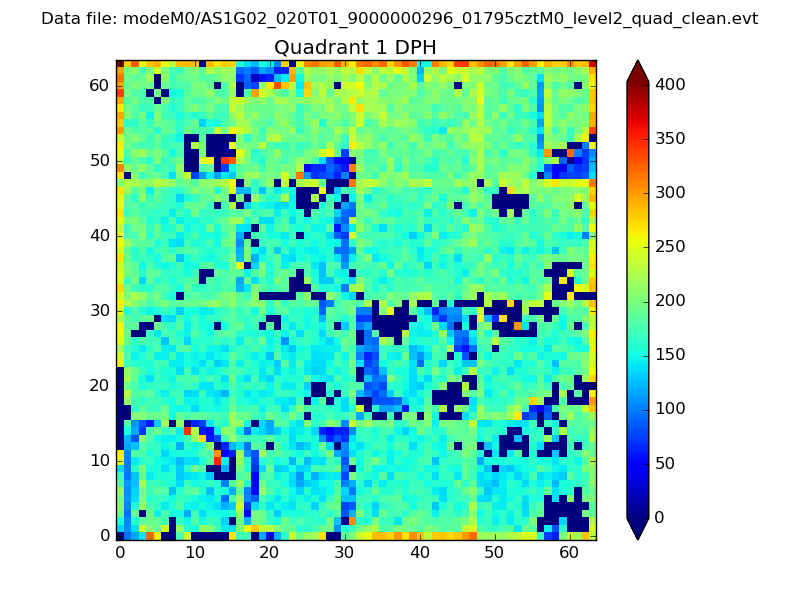 |
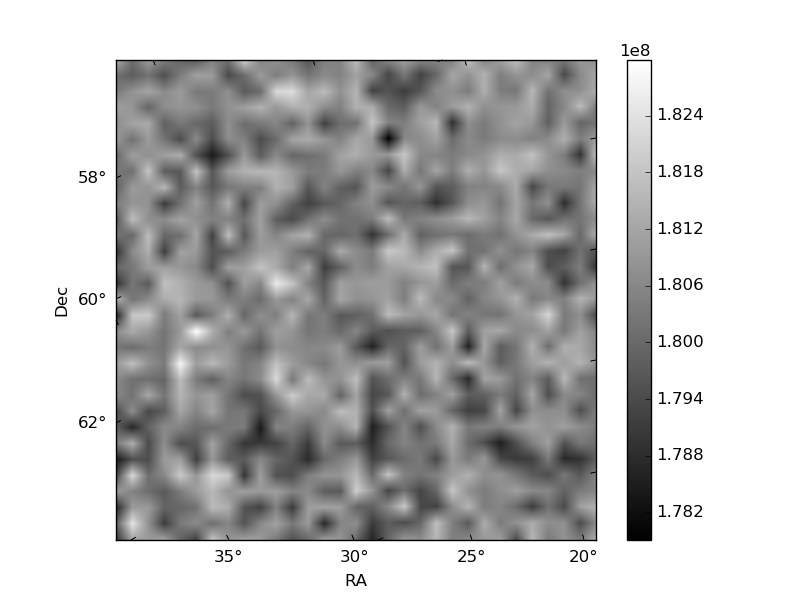
Quadrant B |
|---|---|---|---|
| Quadrant D | 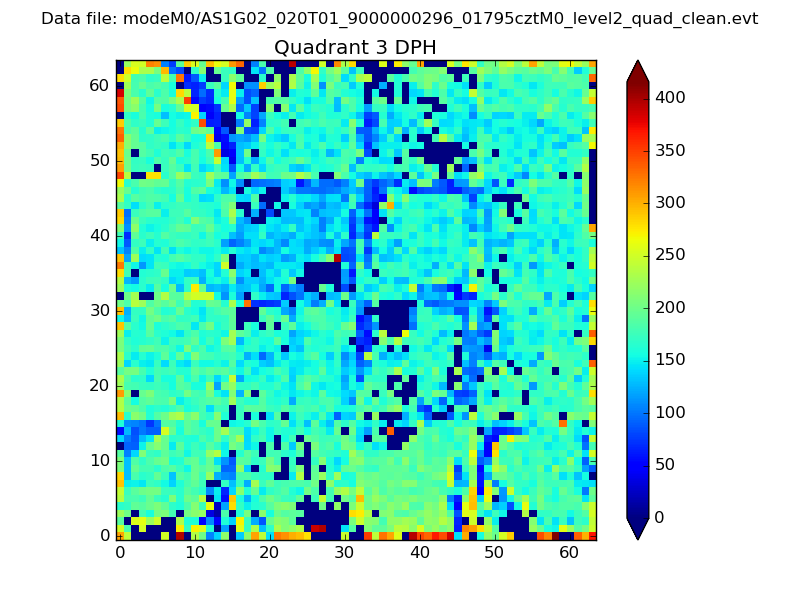 |
 |
Quadrant C |
| Plot type | Count rate plots | Images |
|---|---|---|
| Comparison with Poisson distribution Blue bars denote a histogram of data divided into 1 sec bins. Red curve is a Poisson curve with rate = median count rate of data. |
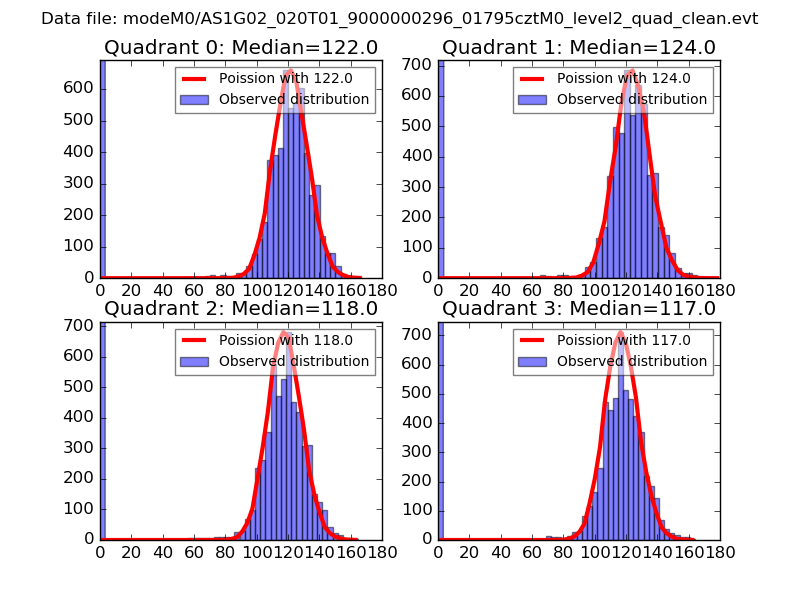 |
 |
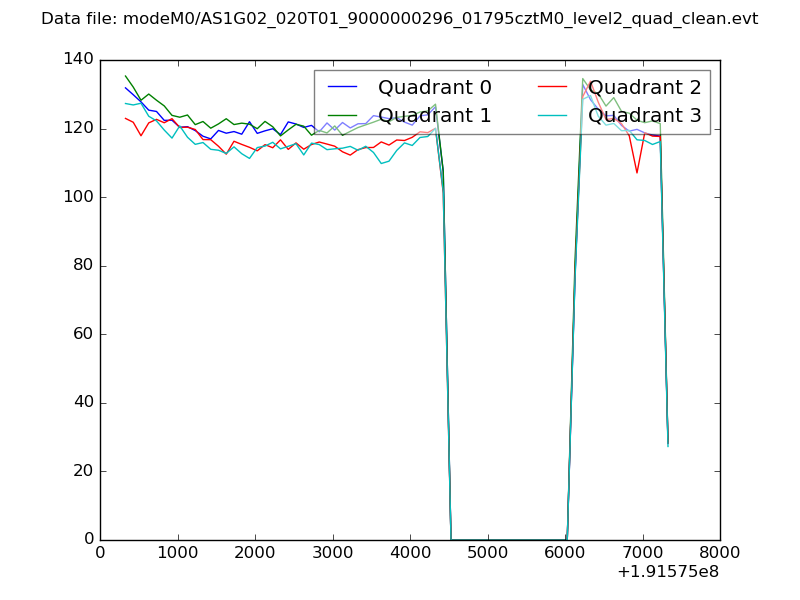
| Quadrant-wise count rates Data is divided into 100 sec bins |
 |
|
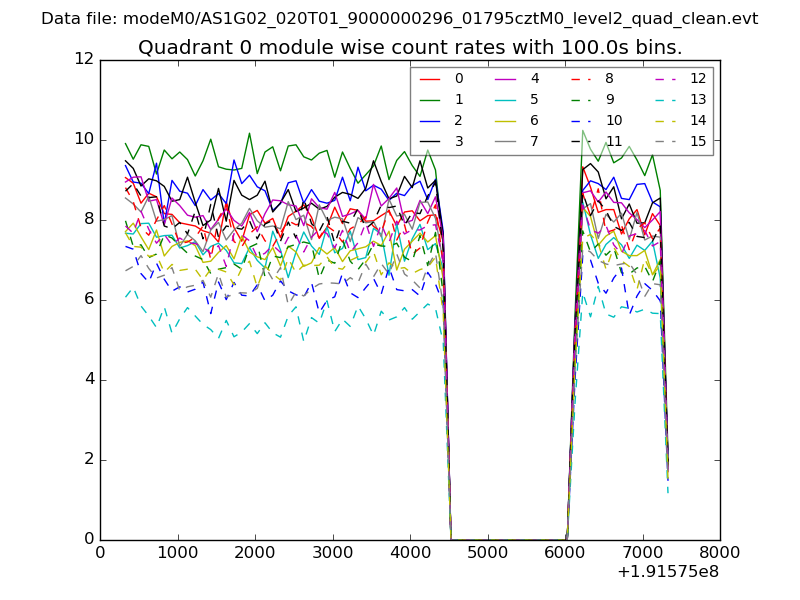
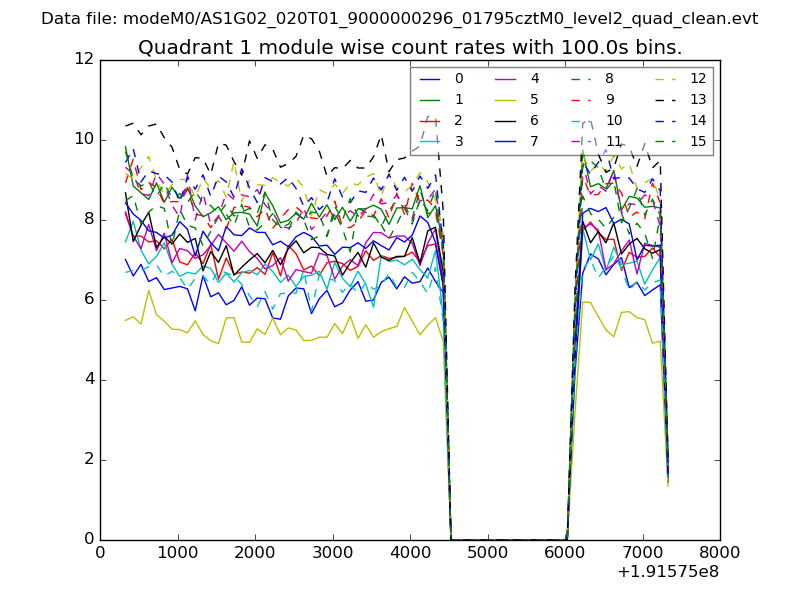
| Module-wise count rates for Quadrant A Data is divided into 100 sec bins |
 |
 |
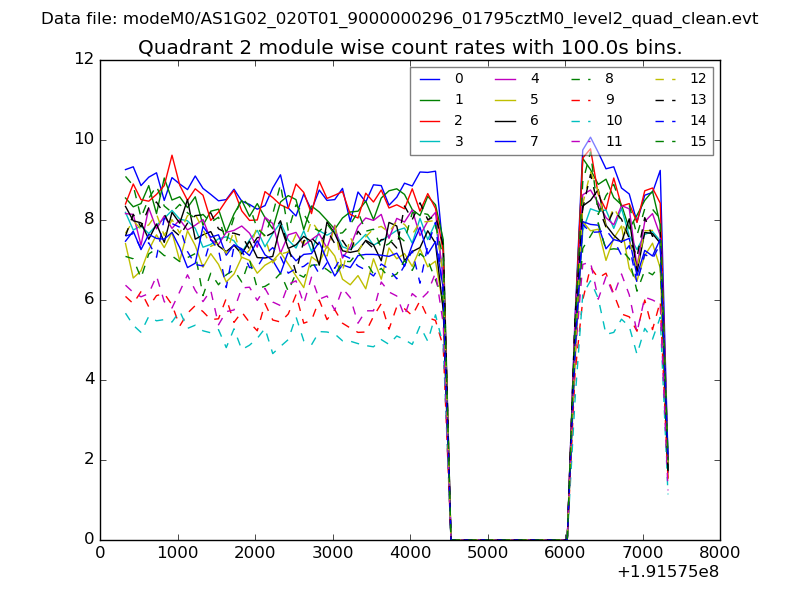
| Module-wise count rates for Quadrant B Data is divided into 100 sec bins |
 |
 |
| Module-wise count rates for Quadrant C Data is divided into 100 sec bins |
 |
 |
| Module-wise count rates for Quadrant D Data is divided into 100 sec bins |
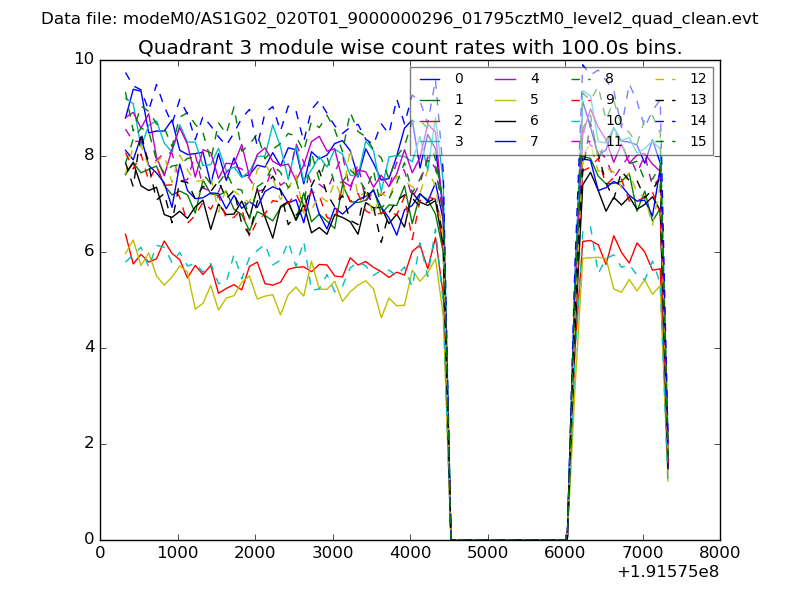 |
 |
| Parameter | Plot |
|---|---|
| CZT HV Monitor | 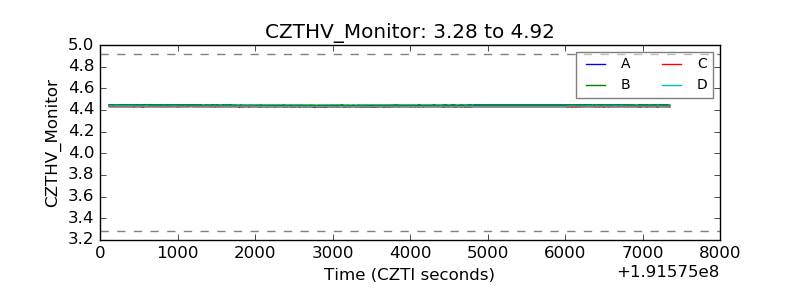 |
| D_VDD | 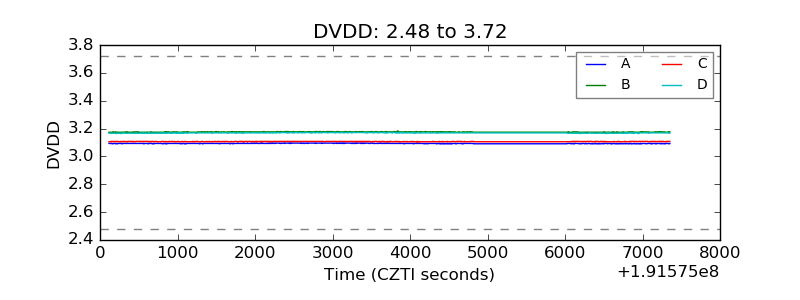 |
| Temperature 1 | 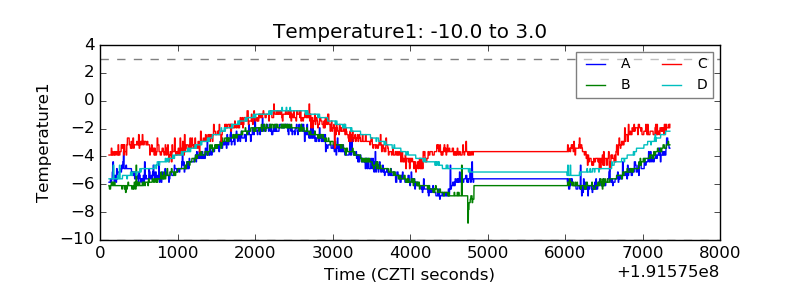 |
| Veto HV Monitor | 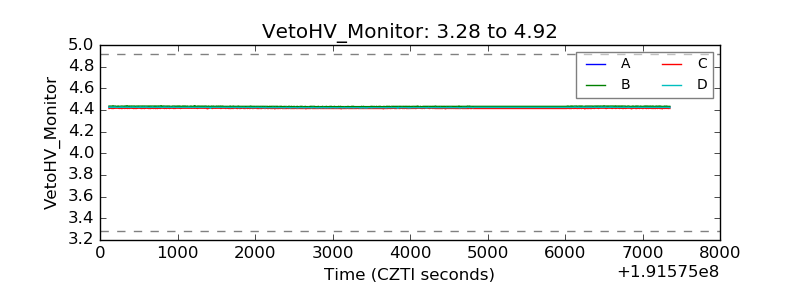 |
| Veto LLD | 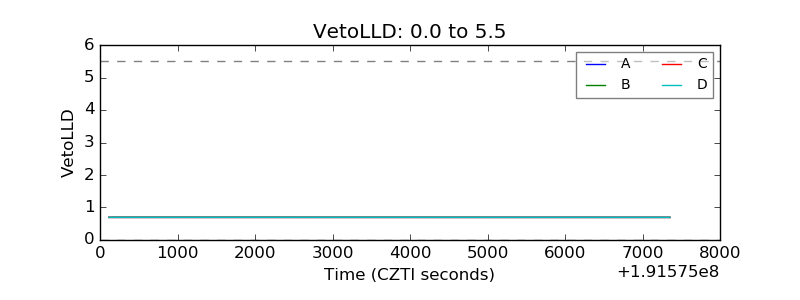 |
| Alpha Counter | 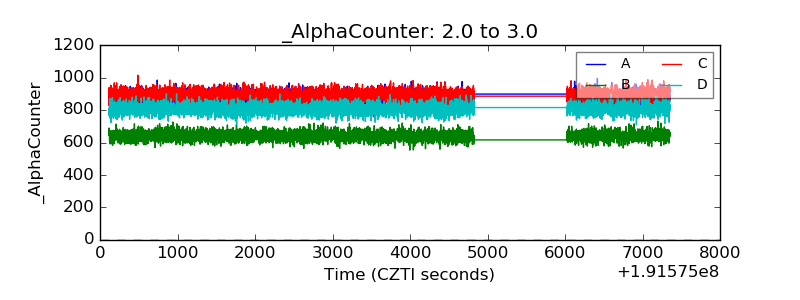 |
| _CPM_Rate | 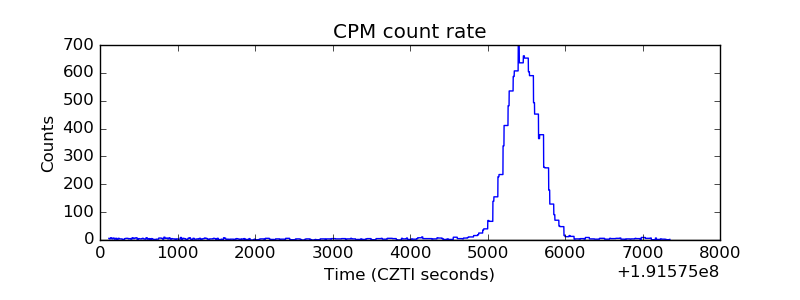 |
| CZT Counter | 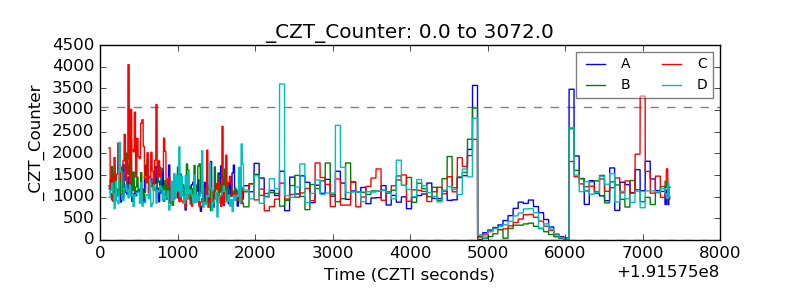 |
| +2.5 Volts monitor |  |
| +5 Volts monitor |  |
| _ROLL_ROT | 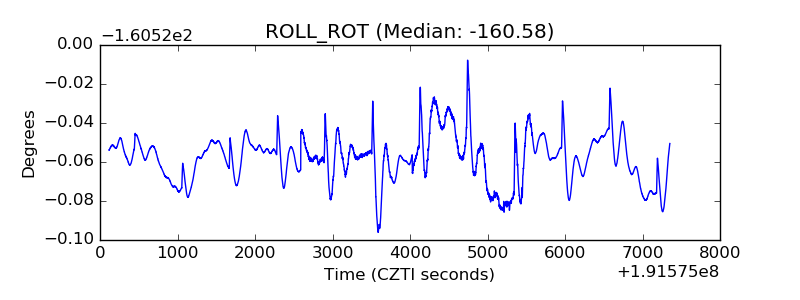 |
| _Roll_DEC | 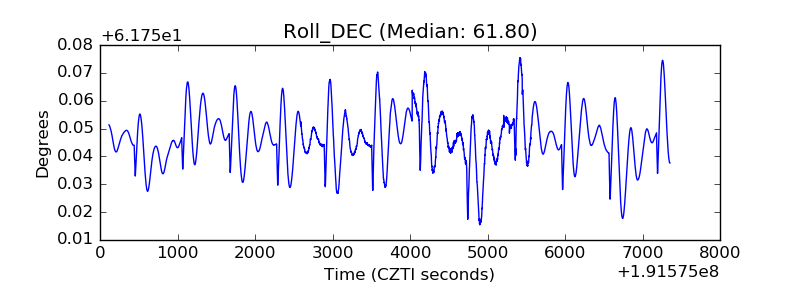 |
| _Roll_RA | 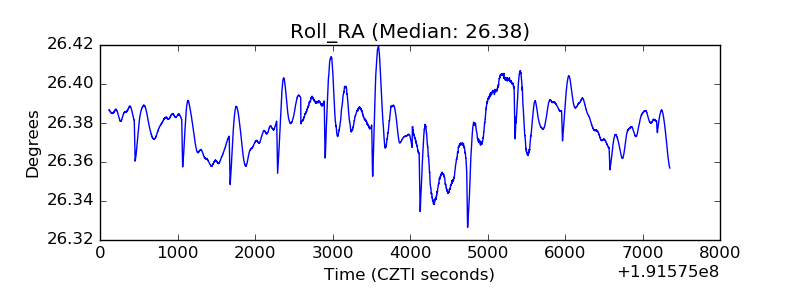 |
| Veto Counter | 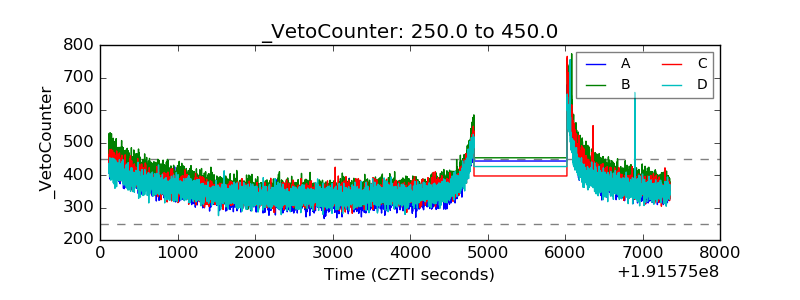 |