| Param | Original file | Final file |
|---|---|---|
| Filename | modeM0/AS1G02_020T01_9000000296_01796cztM0_level2.evt | modeM0/AS1G02_020T01_9000000296_01796cztM0_level2_quad_clean.evt |
| Size (bytes) | 988,937,280 | 94,829,760 |
| Size | 943.1 MB | 90.4 MB |
| Events in quadrant A | 7,413,057 | 619,963 |
| Events in quadrant B | 7,583,476 | 627,263 |
| Events in quadrant C | 7,409,204 | 603,893 |
| Events in quadrant D | 7,142,102 | 597,294 |
| Mode M9 | |||
|---|---|---|---|
| Quadrant | BADHDUFLAG | Total packets | Discarded packets |
| A | 0 | 1 | 0 |
| B | 1 | 1 | 0 |
| C | 1 | -1 | -1 |
| D | 1 | -1 | -1 |
| Mode SS | |||
|---|---|---|---|
| Quadrant | BADHDUFLAG | Total packets | Discarded packets |
| A | 0 | 120 | 0 |
| B | 0 | 120 | 0 |
| C | 0 | 120 | 0 |
| D | 0 | 120 | 0 |
| Mode M0 | |||
|---|---|---|---|
| Quadrant | BADHDUFLAG | Total packets | Discarded packets |
| A | 0 | 26356 | 1 |
| B | 0 | 26846 | 1 |
| C | 0 | 26269 | 9 |
| D | 0 | 25482 | 1 |
| Quadrant | Total seconds | Saturated seconds | Saturation percentage |
|---|---|---|---|
| A | 6070 | 65 | 1.070840% |
| B | 6070 | 54 | 0.889621% |
| C | 6068 | 68 | 1.120633% |
| D | 6070 | 45 | 0.741351% |
Noise dominated data is calculated using 1-second bins in cleaned event files. If a bin has >2000 counts, and if more than 50% of those come from <1% of pixels, then it is considered to be noise-dominated and hence unusable.
| Quadrant | # 1 sec bins | Bins with >0 counts | Bins with >2000 counts | High rate bins dominated by noise | Noise dominated (total time) | Noise dominated (detector-on time) | Marked lightcurve |
|---|---|---|---|---|---|---|---|
| A | 7125 | 6070 | 264 | 264 | 3.71% | 4.35% | 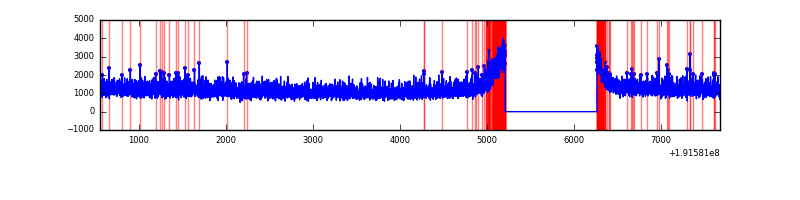 |
| B | 7125 | 6071 | 279 | 279 | 3.92% | 4.60% | 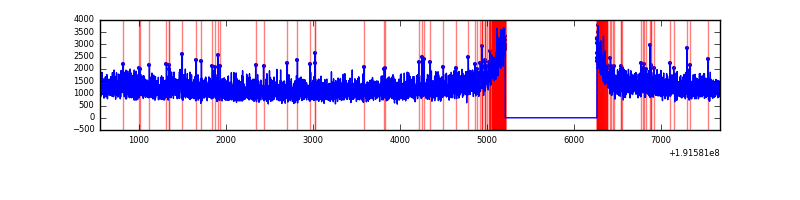 |
| C | 7125 | 6070 | 331 | 331 | 4.65% | 5.45% |  |
| D | 7125 | 6071 | 242 | 242 | 3.40% | 3.99% | 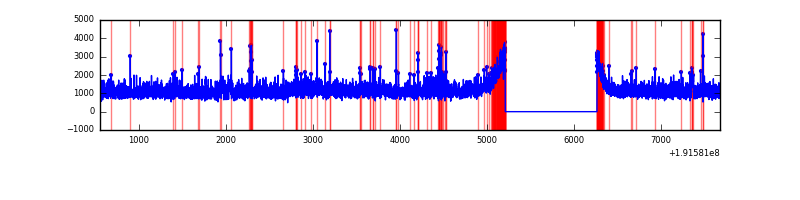 |
Top three noisy pixels from each quadrant. If the there are fewer than three noisy pixels in the level2.evt file, extra rows are filled as -1
| Pixel properties | Quadrant properties | ||||||
|---|---|---|---|---|---|---|---|
| Quadrant | DetID | PixID | Counts | Sigma | Mean | Median | Sigma |
| A | 0 | 231 | 10676 | 18.66 | 1936 | 1951 | 467.5 |
| A | -1 | -1 | -1 | -1.0 | 1936 | 1951 | 467.5 |
| A | -1 | -1 | -1 | -1.0 | 1936 | 1951 | 467.5 |
| B | 0 | 229 | 9344 | 15.52 | 1992 | 2005 | 472.9 |
| B | 15 | 85 | 7973 | 12.62 | 1992 | 2005 | 472.9 |
| B | 0 | 234 | 7345 | 11.29 | 1992 | 2005 | 472.9 |
| C | 8 | 208 | 388298 | 777.89 | 1786 | 1843 | 496.8 |
| C | 10 | 82 | 45326 | 87.52 | 1786 | 1843 | 496.8 |
| C | 7 | 159 | 5484 | 7.33 | 1786 | 1843 | 496.8 |
| D | 7 | 85 | 195260 | 353.9 | 1778 | 1841 | 546.5 |
| D | 10 | 199 | 104479 | 187.8 | 1778 | 1841 | 546.5 |
| D | 13 | 169 | 54139 | 95.69 | 1778 | 1841 | 546.5 |
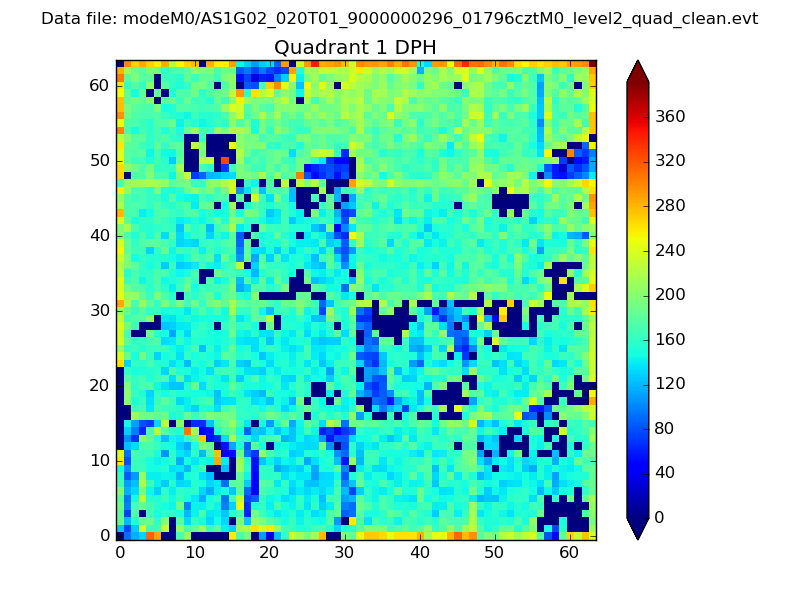
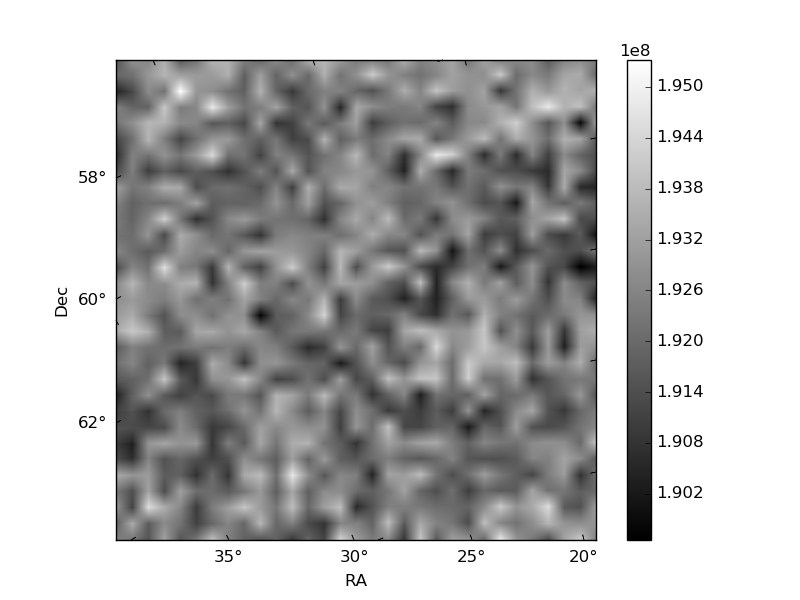
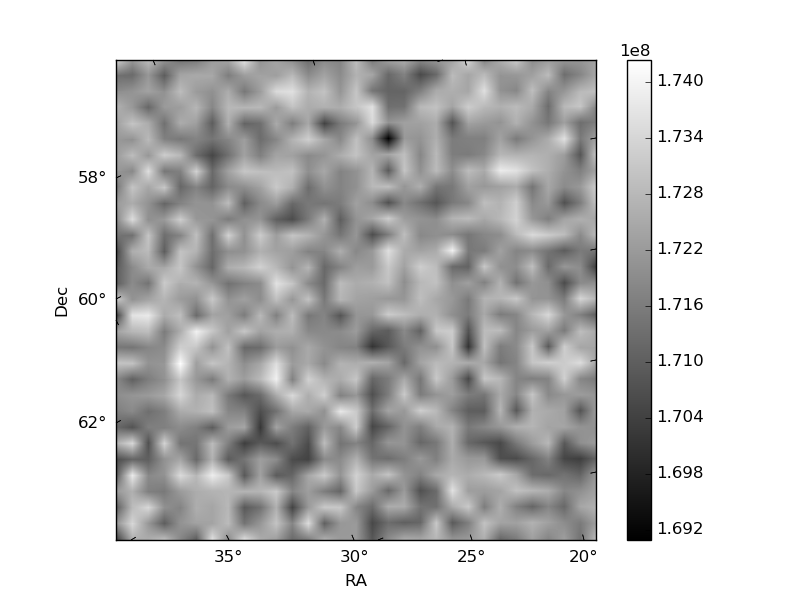
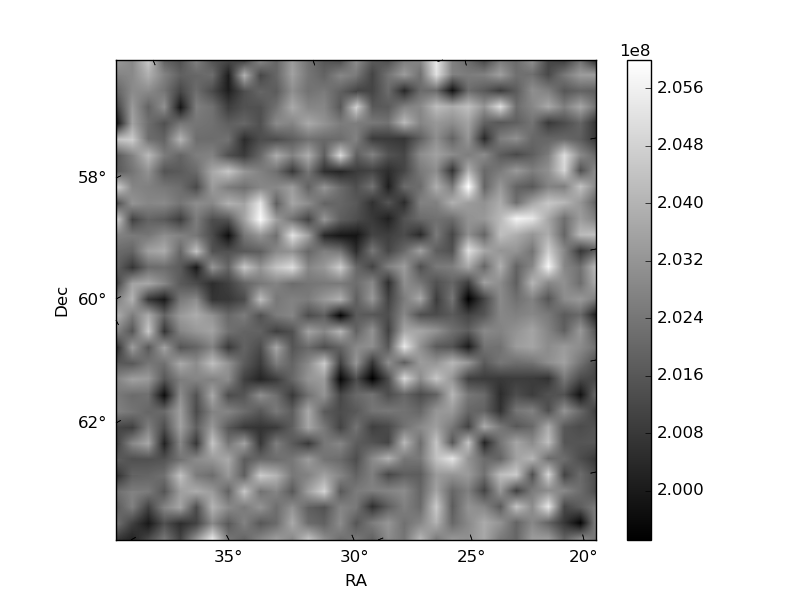
Histogram calculated using DETX and DETY for each event in the final _common_clean file
| Quadrant A |  |
 |
Quadrant B |
|---|---|---|---|
| Quadrant D |  |
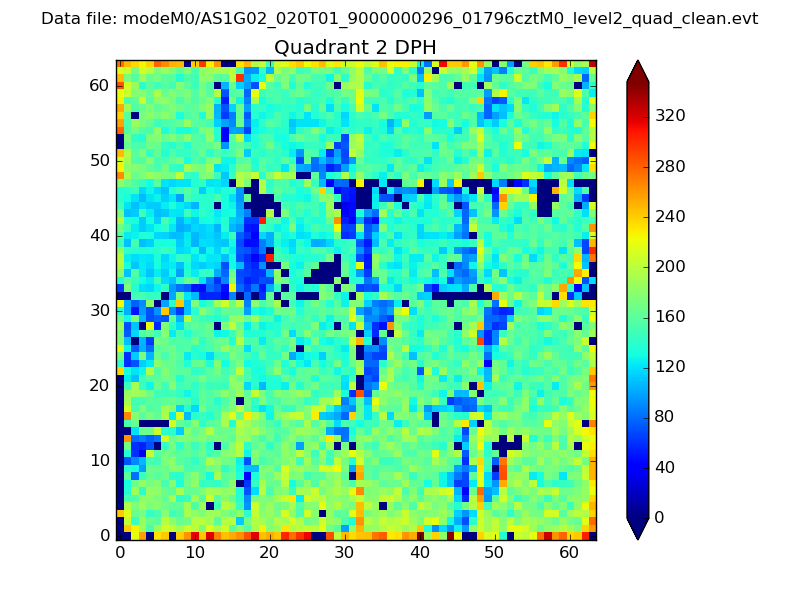 |
Quadrant C |
| Plot type | Count rate plots | Images |
|---|---|---|
| Comparison with Poisson distribution Blue bars denote a histogram of data divided into 1 sec bins. Red curve is a Poisson curve with rate = median count rate of data. |
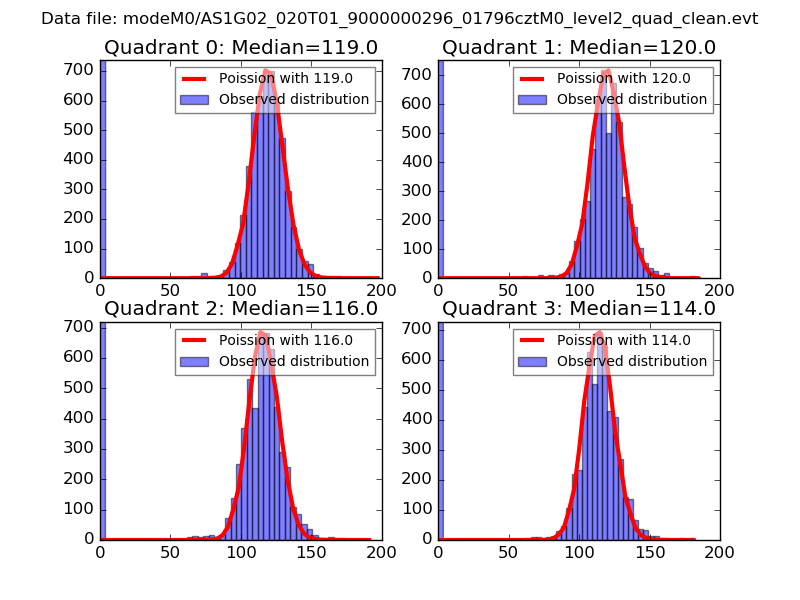 |
 |
| Quadrant-wise count rates Data is divided into 100 sec bins |
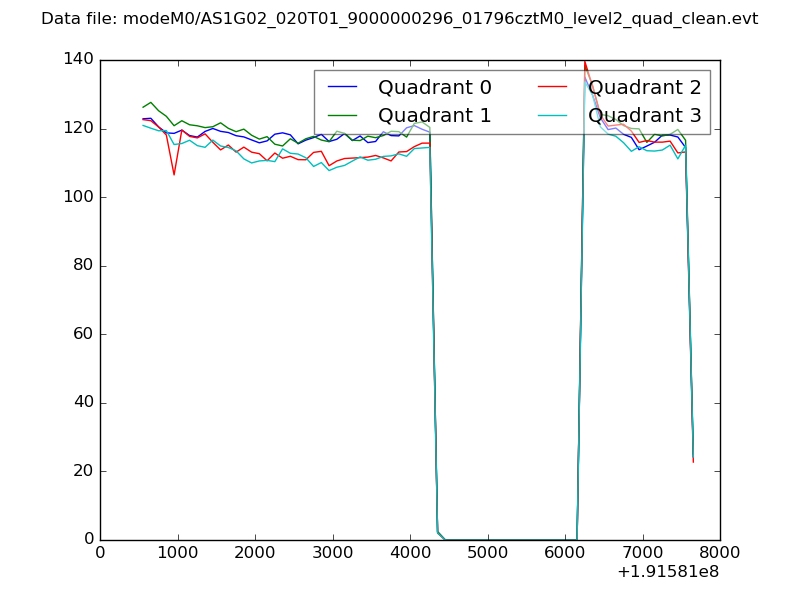 |
|
| Module-wise count rates for Quadrant A Data is divided into 100 sec bins |
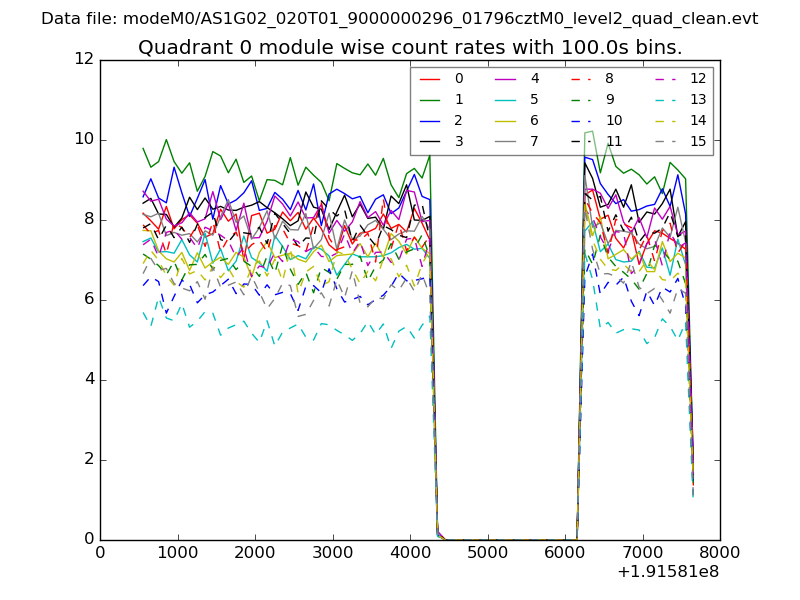 |
 |
| Module-wise count rates for Quadrant B Data is divided into 100 sec bins |
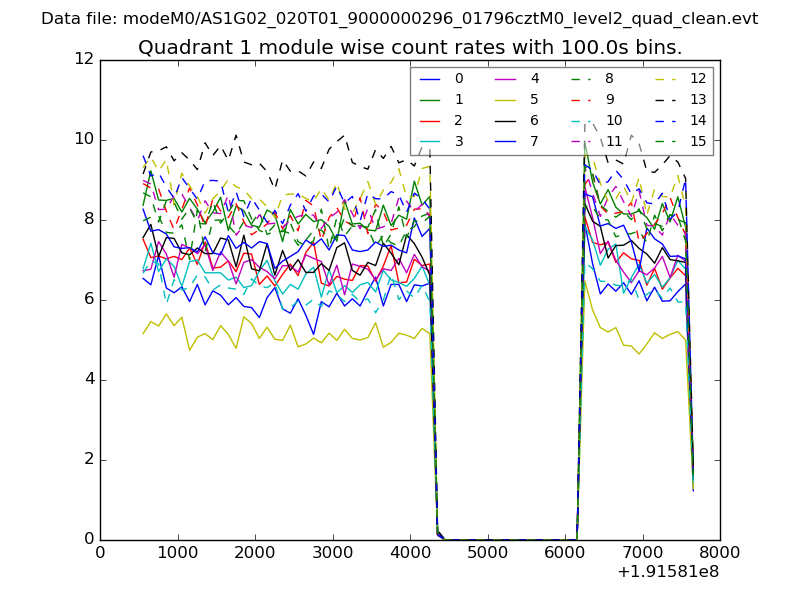 |
 |
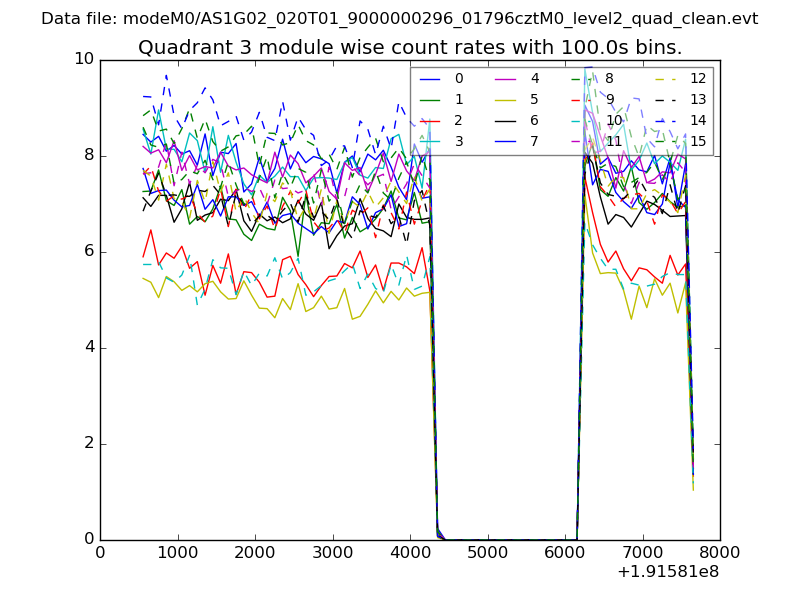
| Module-wise count rates for Quadrant C Data is divided into 100 sec bins |
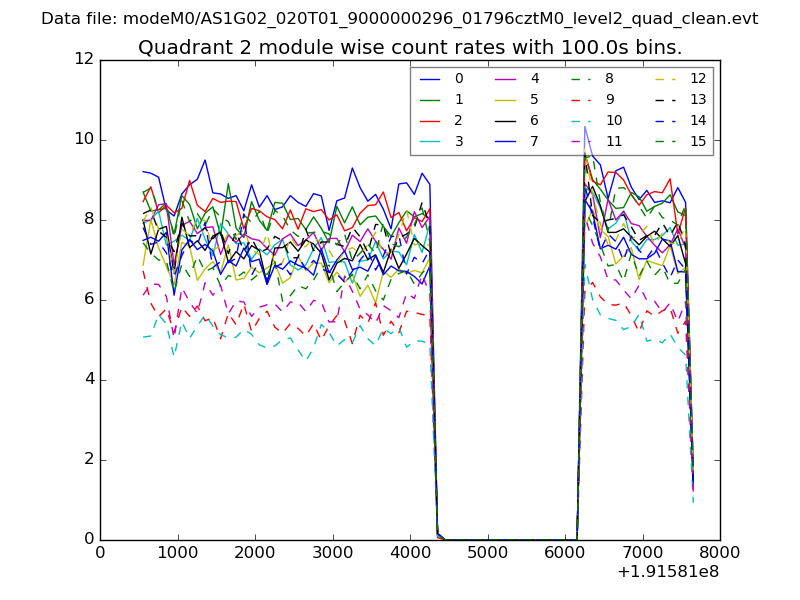 |
 |
| Module-wise count rates for Quadrant D Data is divided into 100 sec bins |
 |
 |
| Parameter | Plot |
|---|---|
| CZT HV Monitor | 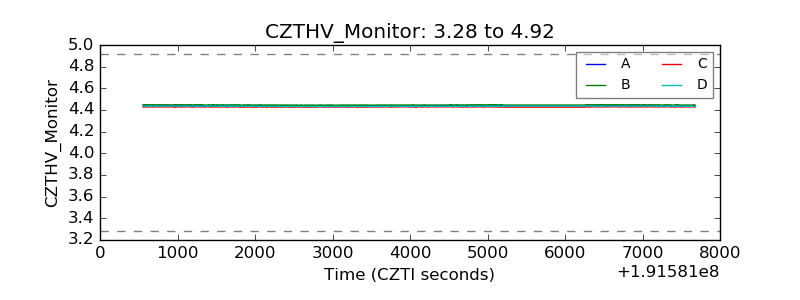 |
| D_VDD | 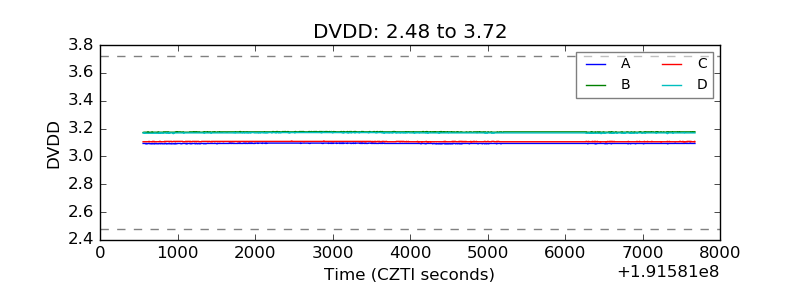 |
| Temperature 1 | 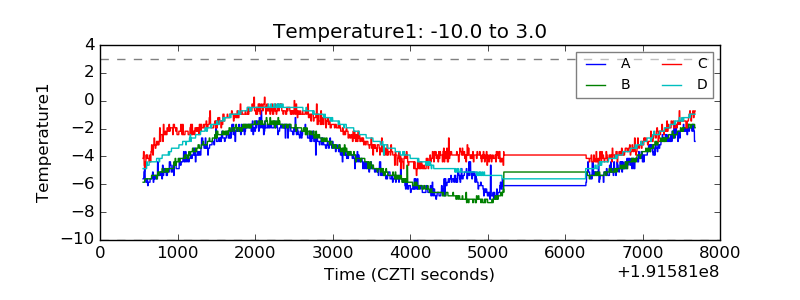 |
| Veto HV Monitor | 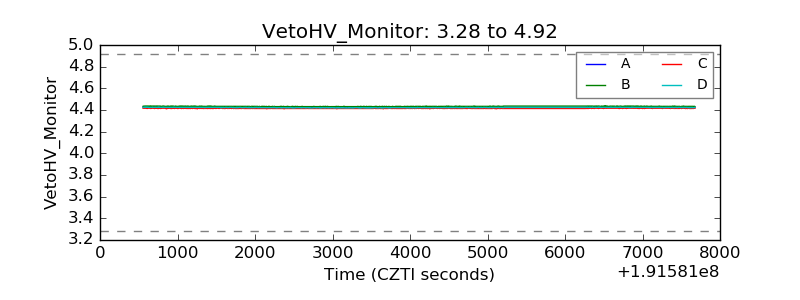 |
| Veto LLD | 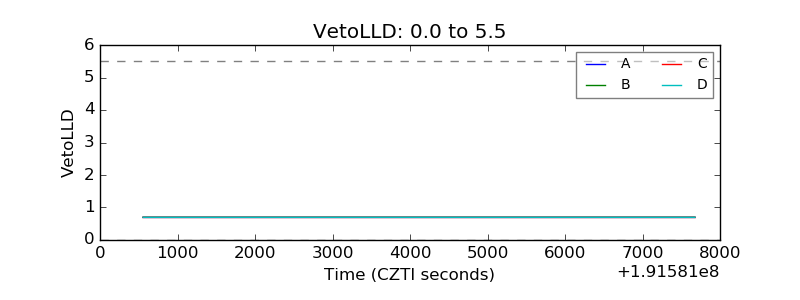 |
| Alpha Counter | 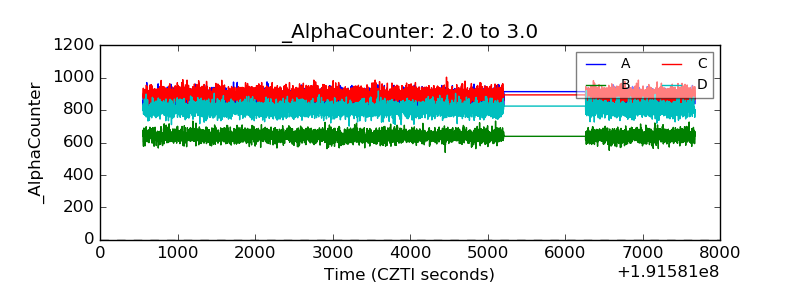 |
| _CPM_Rate | 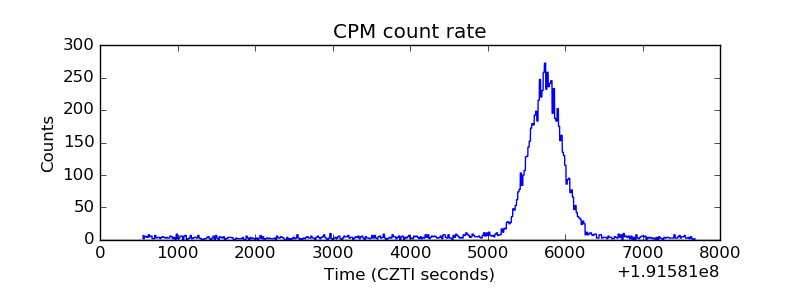 |
| CZT Counter | 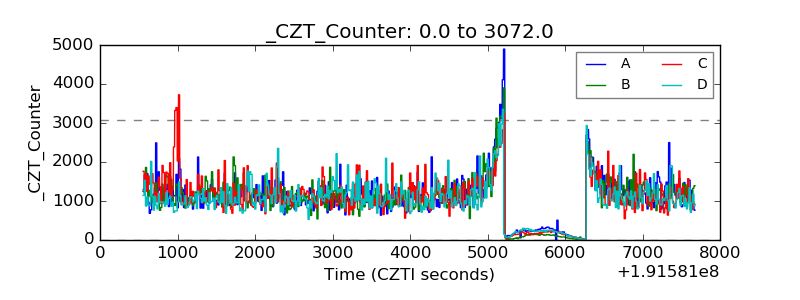 |
| +2.5 Volts monitor |  |
| +5 Volts monitor |  |
| _ROLL_ROT | 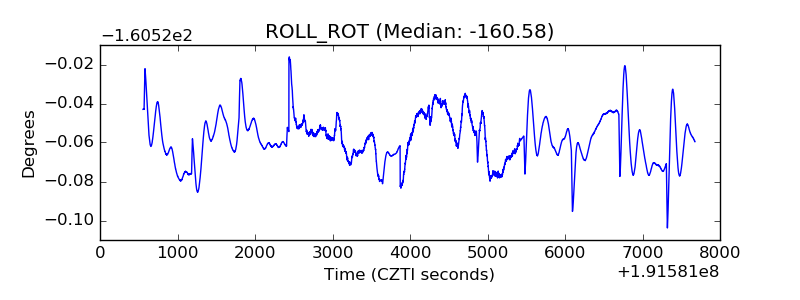 |
| _Roll_DEC | 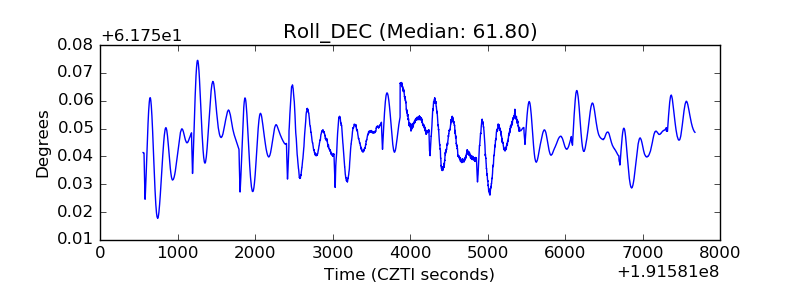 |
| _Roll_RA | 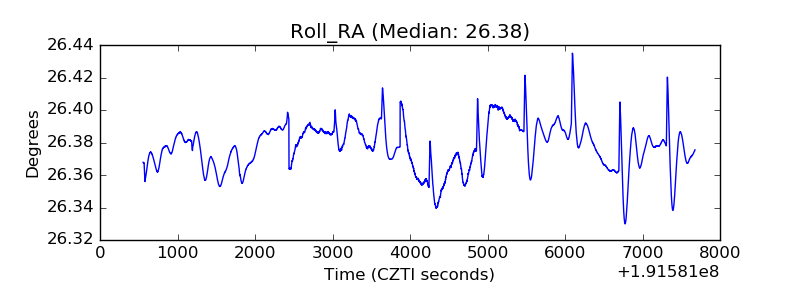 |
| Veto Counter | 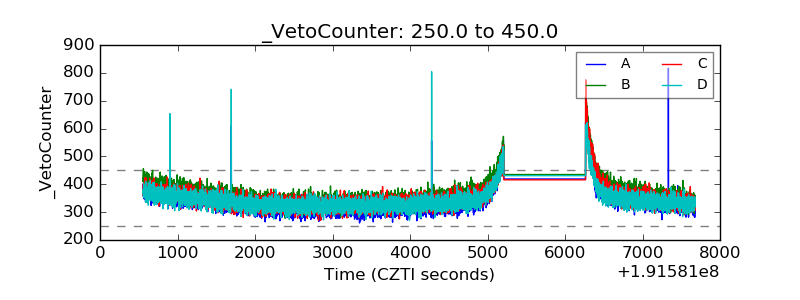 |