| Param | Original file | Final file |
|---|---|---|
| Filename | modeM0/AS1G02_020T01_9000000296_01797cztM0_level2.evt | modeM0/AS1G02_020T01_9000000296_01797cztM0_level2_quad_clean.evt |
| Size (bytes) | 1,134,875,520 | 97,974,720 |
| Size | 1.1 GB | 93.4 MB |
| Events in quadrant A | 8,665,809 | 630,087 |
| Events in quadrant B | 8,718,299 | 635,526 |
| Events in quadrant C | 8,059,486 | 615,496 |
| Events in quadrant D | 8,469,049 | 605,045 |
| Mode M9 | |||
|---|---|---|---|
| Quadrant | BADHDUFLAG | Total packets | Discarded packets |
| A | 0 | 1 | 0 |
| B | 1 | 1 | 0 |
| C | 1 | -1 | -1 |
| D | 1 | -1 | -1 |
| Mode SS | |||
|---|---|---|---|
| Quadrant | BADHDUFLAG | Total packets | Discarded packets |
| A | 0 | 138 | 0 |
| B | 0 | 138 | 0 |
| C | 0 | 138 | 0 |
| D | 0 | 138 | 0 |
| Mode M0 | |||
|---|---|---|---|
| Quadrant | BADHDUFLAG | Total packets | Discarded packets |
| A | 0 | 30668 | 13 |
| B | 0 | 30811 | 2 |
| C | 0 | 28806 | 2 |
| D | 0 | 30051 | 2 |
| Quadrant | Total seconds | Saturated seconds | Saturation percentage |
|---|---|---|---|
| A | 6902 | 76 | 1.101130% |
| B | 6904 | 30 | 0.434531% |
| C | 6904 | 23 | 0.333140% |
| D | 6904 | 96 | 1.390498% |
Noise dominated data is calculated using 1-second bins in cleaned event files. If a bin has >2000 counts, and if more than 50% of those come from <1% of pixels, then it is considered to be noise-dominated and hence unusable.
| Quadrant | # 1 sec bins | Bins with >0 counts | Bins with >2000 counts | High rate bins dominated by noise | Noise dominated (total time) | Noise dominated (detector-on time) | Marked lightcurve |
|---|---|---|---|---|---|---|---|
| A | 7694 | 6904 | 354 | 354 | 4.60% | 5.13% | 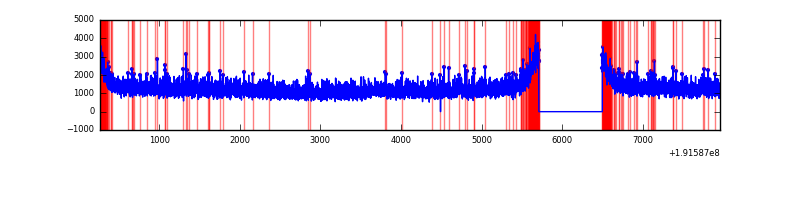 |
| B | 7694 | 6905 | 358 | 358 | 4.65% | 5.18% | 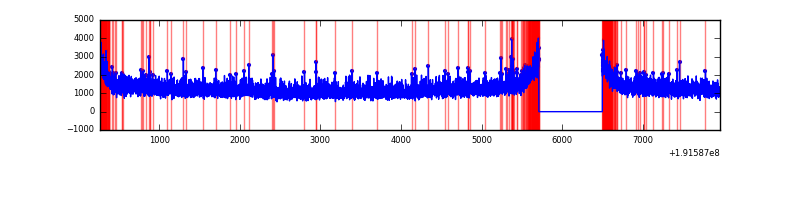 |
| C | 7694 | 6905 | 247 | 247 | 3.21% | 3.58% | 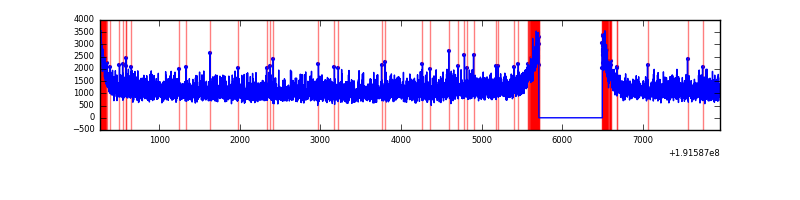 |
| D | 7694 | 6905 | 389 | 389 | 5.06% | 5.63% | 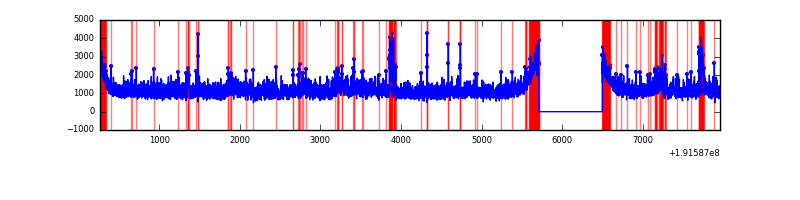 |
Top three noisy pixels from each quadrant. If the there are fewer than three noisy pixels in the level2.evt file, extra rows are filled as -1
| Pixel properties | Quadrant properties | ||||||
|---|---|---|---|---|---|---|---|
| Quadrant | DetID | PixID | Counts | Sigma | Mean | Median | Sigma |
| A | 0 | 231 | 110279 | 199.03 | 2237 | 2255 | 542.8 |
| A | 10 | 2 | 5501 | 5.98 | 2237 | 2255 | 542.8 |
| A | -1 | -1 | -1 | -1.0 | 2237 | 2255 | 542.8 |
| B | 15 | 85 | 26959 | 45.57 | 2284 | 2297 | 541.2 |
| B | 0 | 234 | 21464 | 35.42 | 2284 | 2297 | 541.2 |
| B | 3 | 32 | 10355 | 14.89 | 2284 | 2297 | 541.2 |
| C | 8 | 208 | 68726 | 116.47 | 2042 | 2110 | 572.0 |
| C | 10 | 82 | 9271 | 12.52 | 2042 | 2110 | 572.0 |
| C | 14 | 223 | 7675 | 9.73 | 2042 | 2110 | 572.0 |
| D | 7 | 85 | 341362 | 536.28 | 2039 | 2112 | 632.6 |
| D | 10 | 172 | 140053 | 218.06 | 2039 | 2112 | 632.6 |
| D | 13 | 88 | 117404 | 182.25 | 2039 | 2112 | 632.6 |
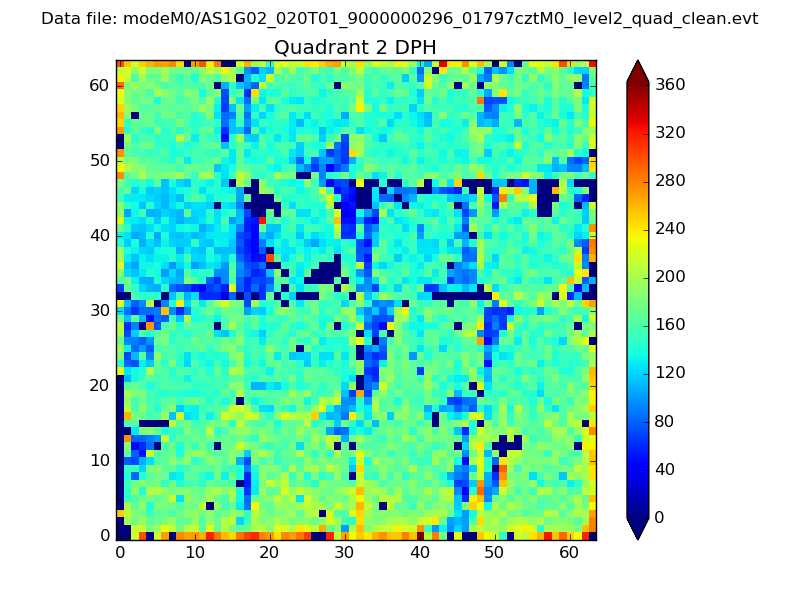
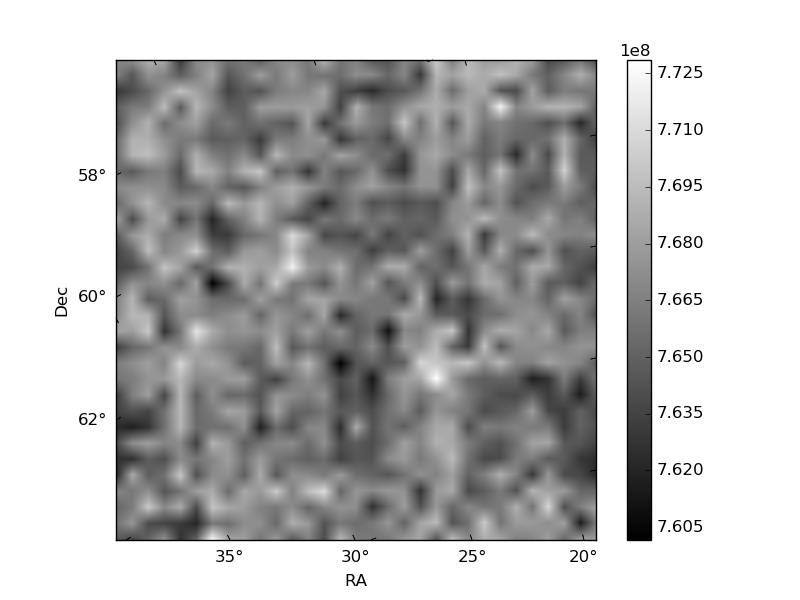
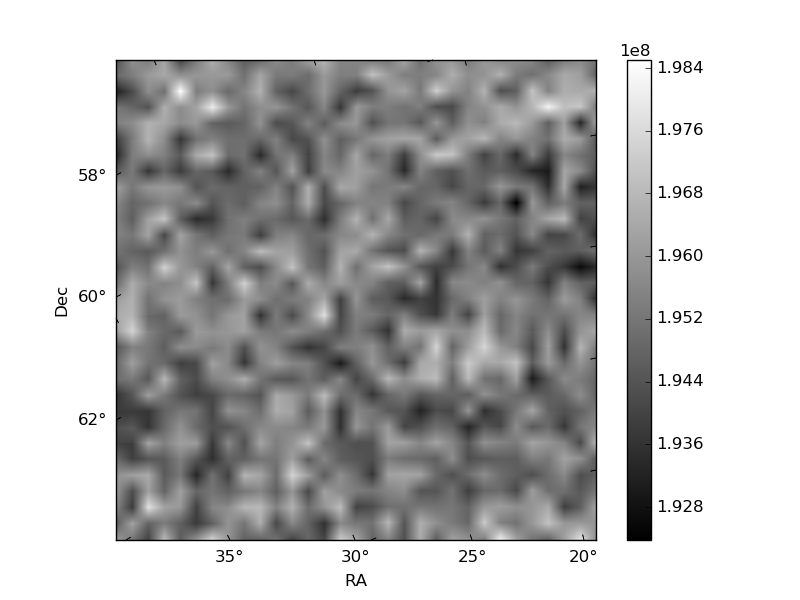
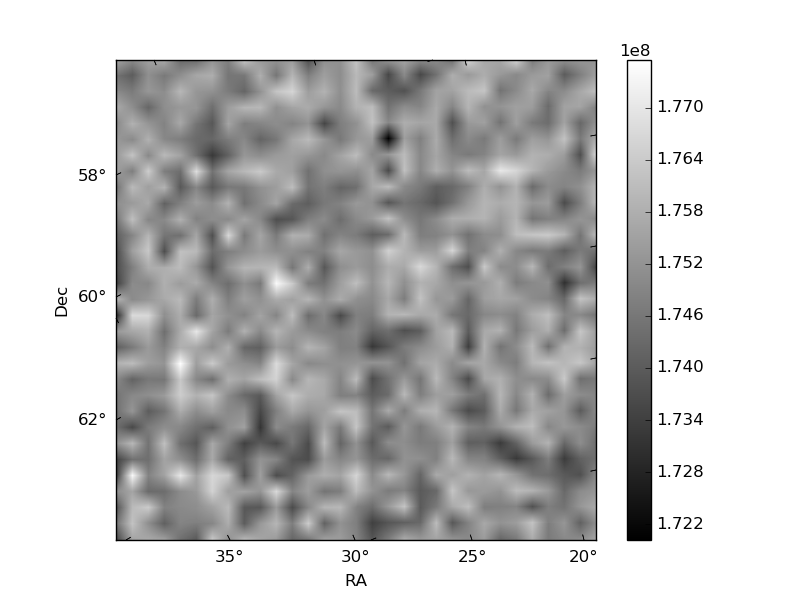
Histogram calculated using DETX and DETY for each event in the final _common_clean file
| Quadrant A | 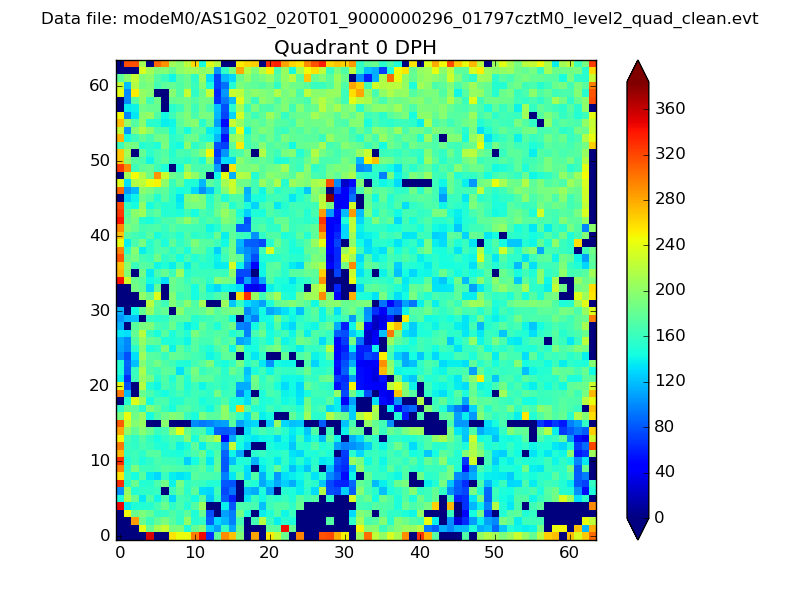 |
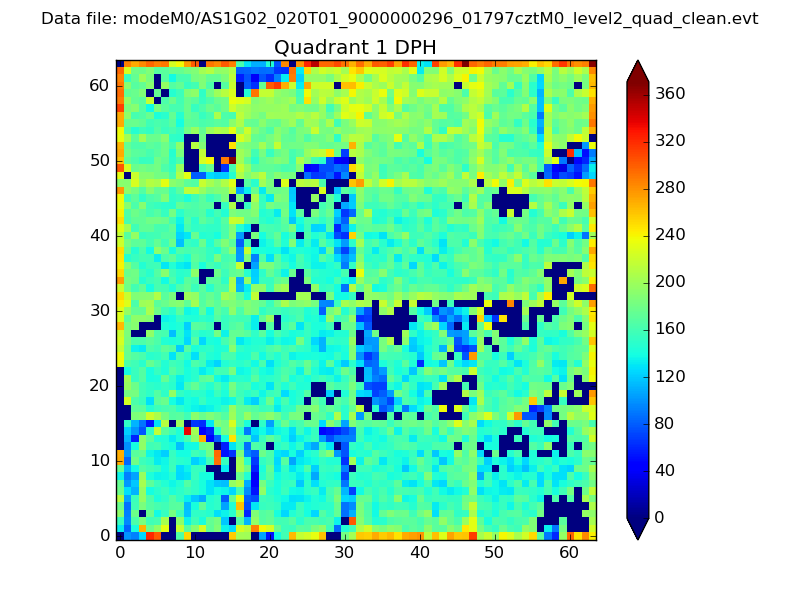 |
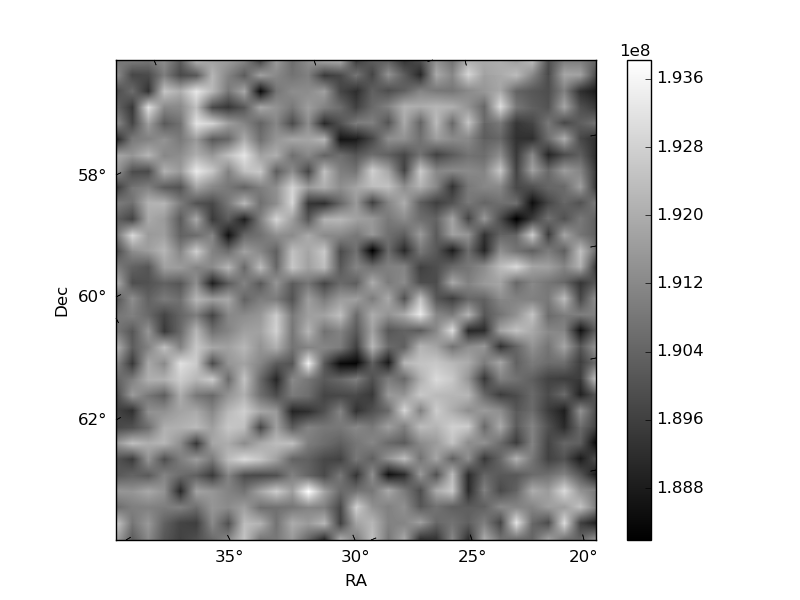
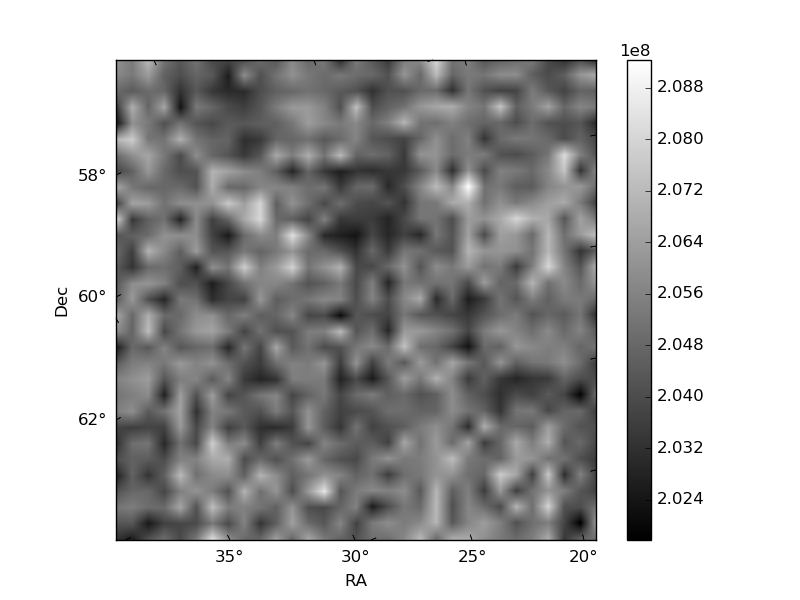
Quadrant B |
|---|---|---|---|
| Quadrant D | 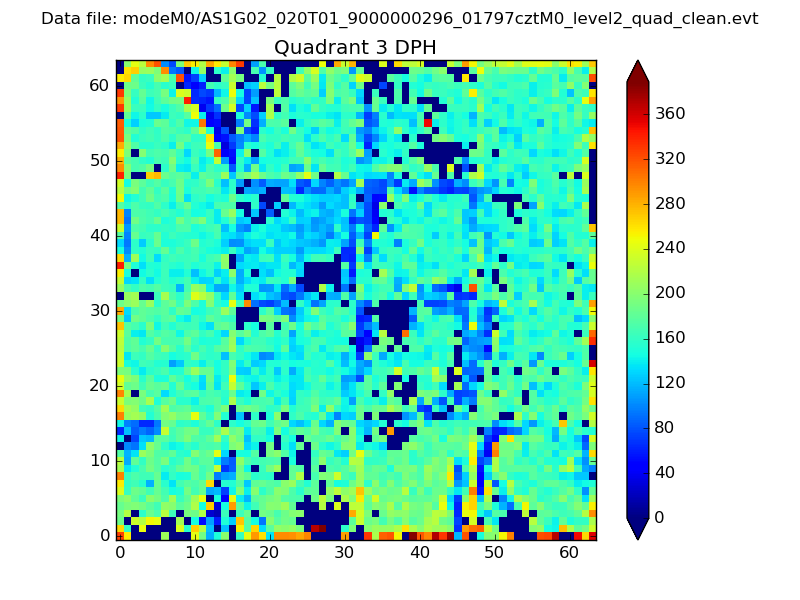 |
 |
Quadrant C |
| Plot type | Count rate plots | Images |
|---|---|---|
| Comparison with Poisson distribution Blue bars denote a histogram of data divided into 1 sec bins. Red curve is a Poisson curve with rate = median count rate of data. |
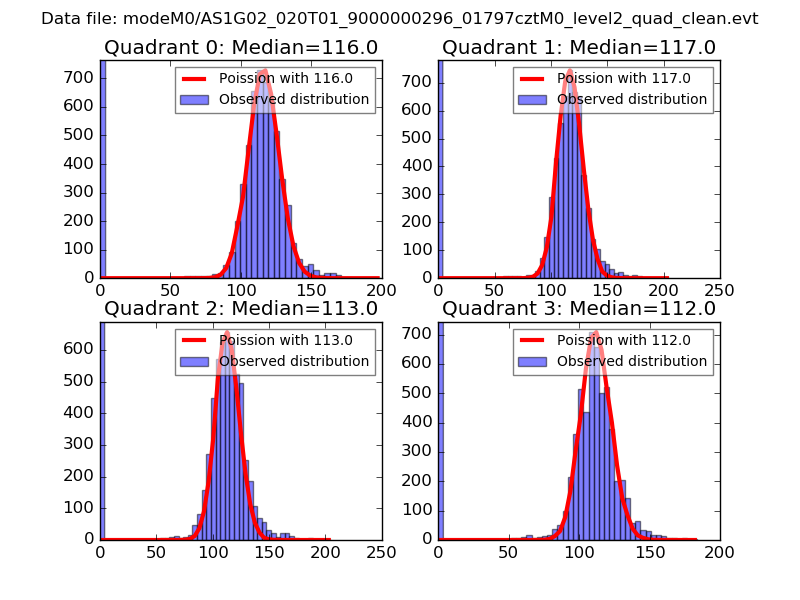 |
 |
| Quadrant-wise count rates Data is divided into 100 sec bins |
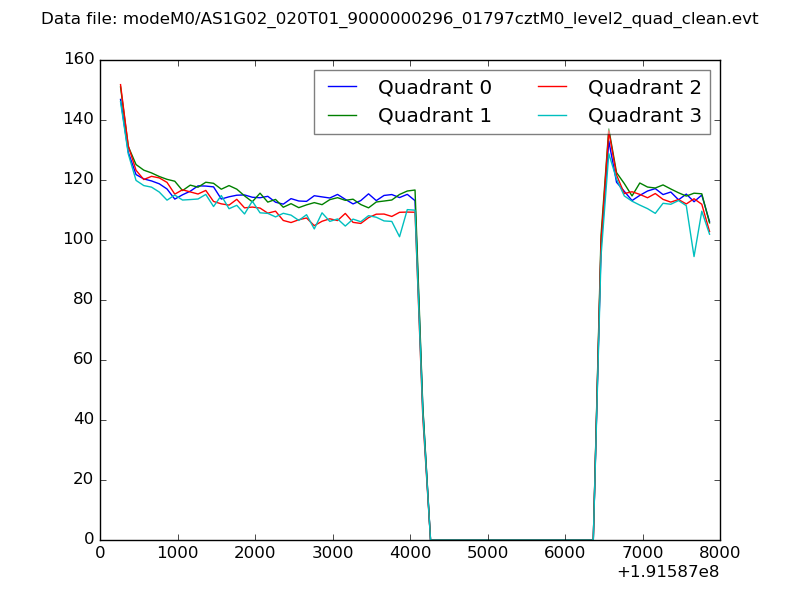 |
|
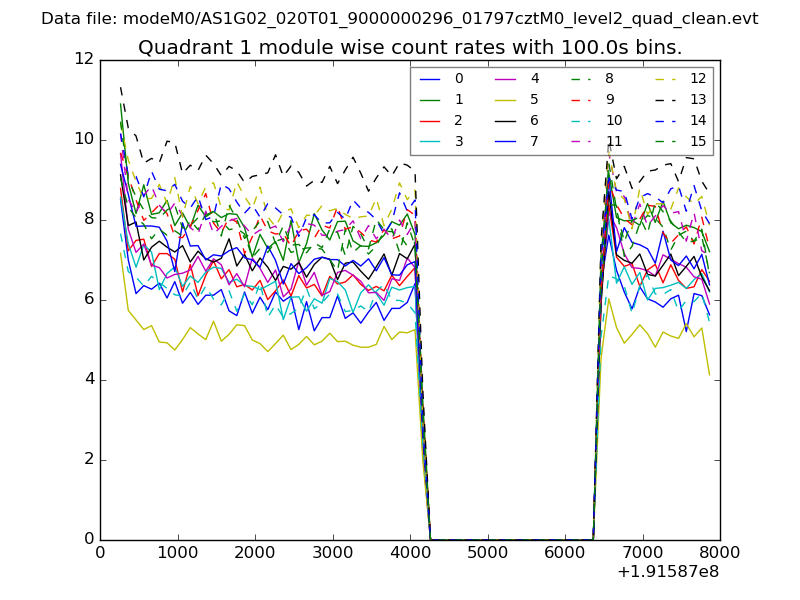
| Module-wise count rates for Quadrant A Data is divided into 100 sec bins |
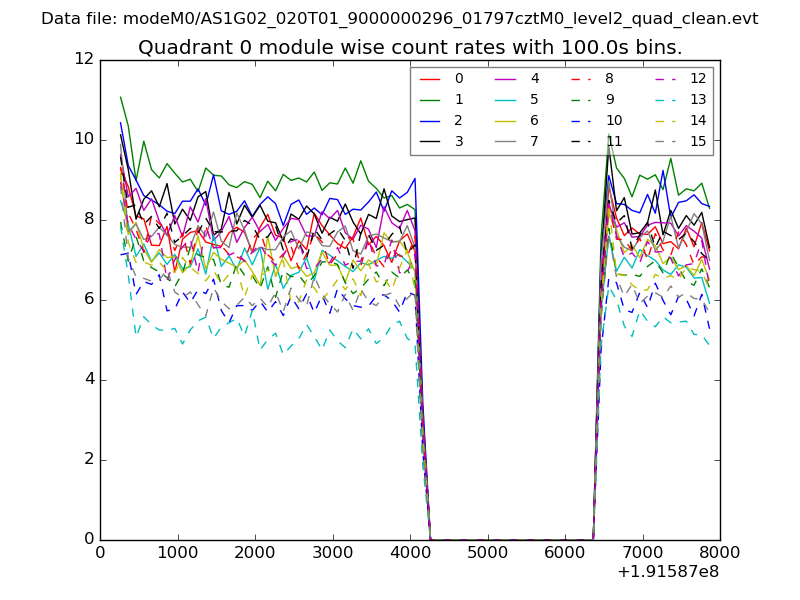 |
 |
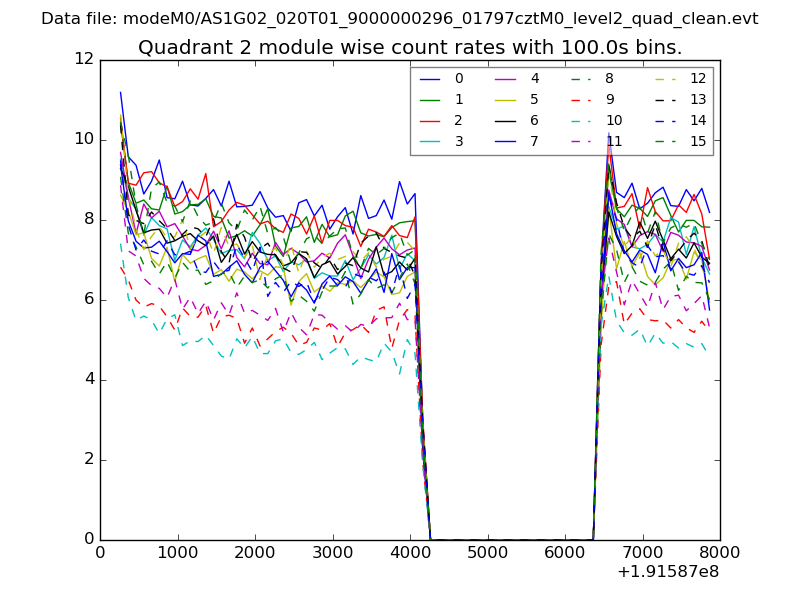
| Module-wise count rates for Quadrant B Data is divided into 100 sec bins |
 |
 |
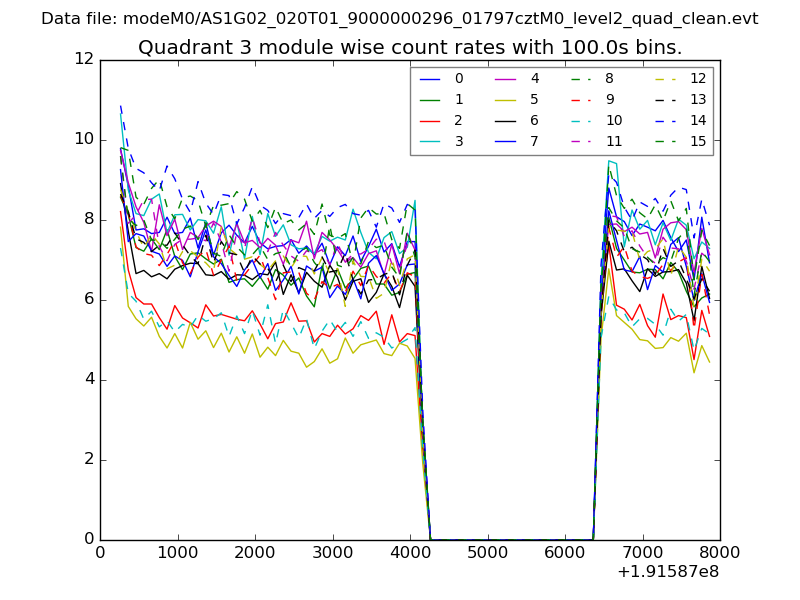
| Module-wise count rates for Quadrant C Data is divided into 100 sec bins |
 |
 |
| Module-wise count rates for Quadrant D Data is divided into 100 sec bins |
 |
 |
| Parameter | Plot |
|---|---|
| CZT HV Monitor | 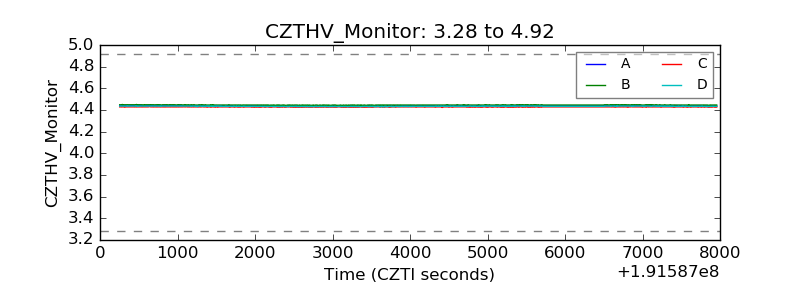 |
| D_VDD | 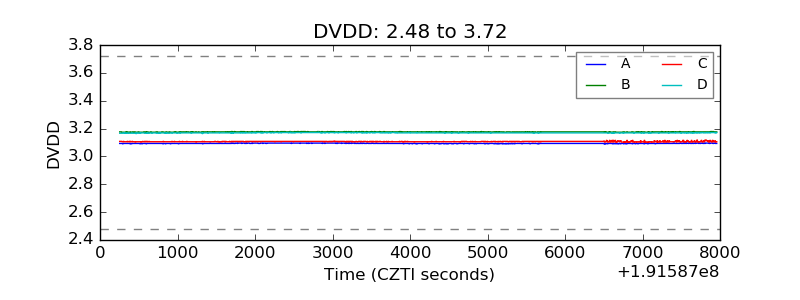 |
| Temperature 1 |  |
| Veto HV Monitor | 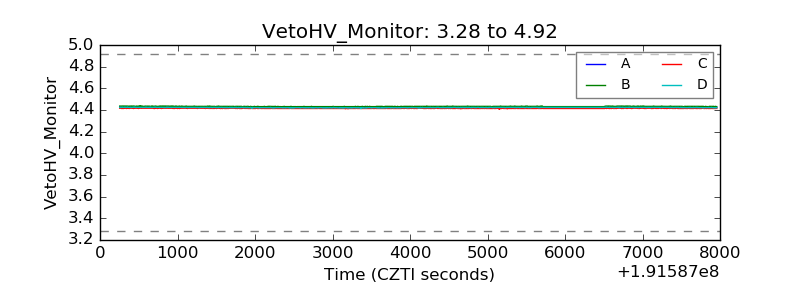 |
| Veto LLD |  |
| Alpha Counter | 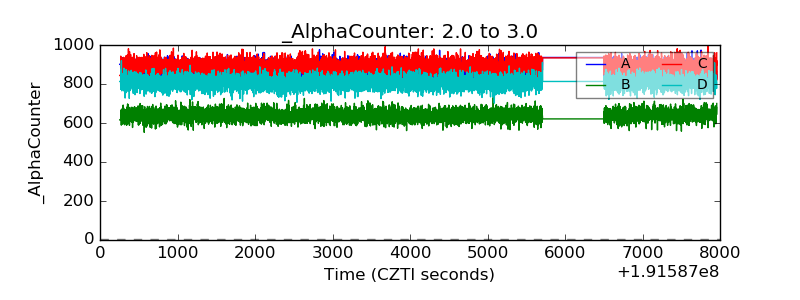 |
| _CPM_Rate | 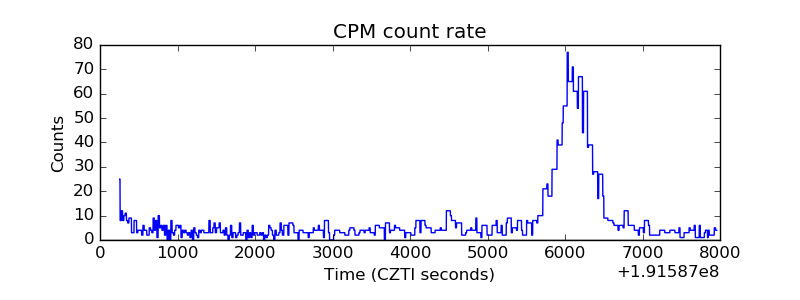 |
| CZT Counter | 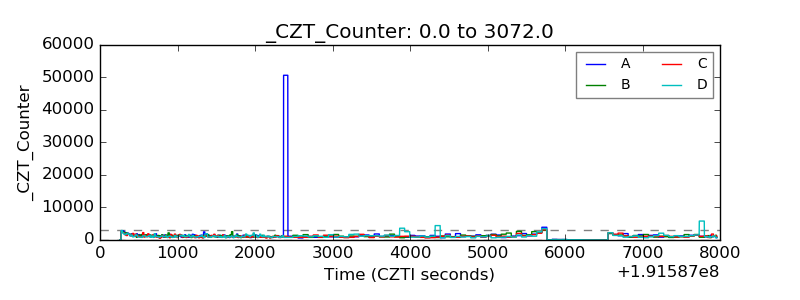 |
| +2.5 Volts monitor |  |
| +5 Volts monitor | 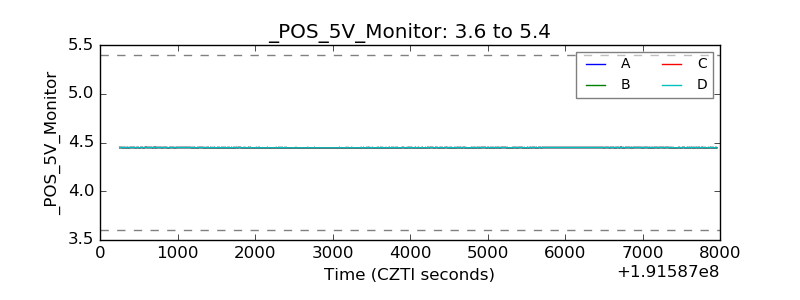 |
| _ROLL_ROT |  |
| _Roll_DEC | 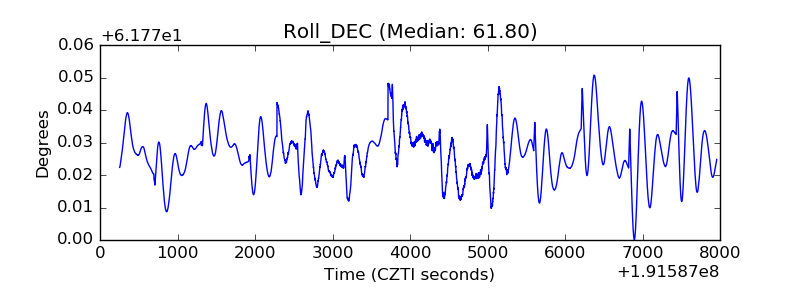 |
| _Roll_RA | 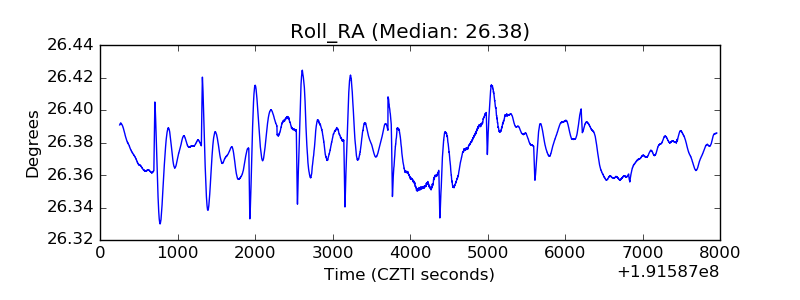 |
| Veto Counter | 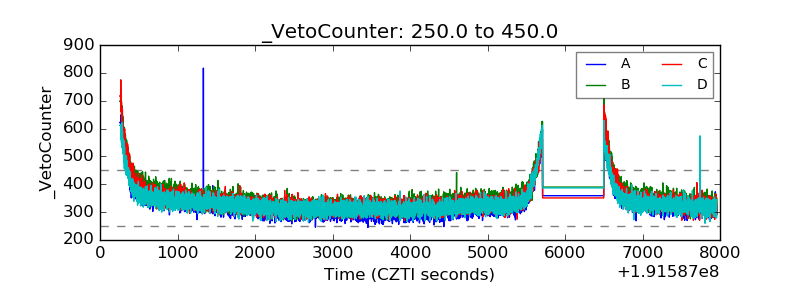 |