| Param | Original file | Final file |
|---|---|---|
| Filename | modeM0/AS1G02_020T02_9000000294cztM0_level2.fits | modeM0/AS1G02_020T02_9000000294cztM0_level2_quad_clean.evt |
| Size (bytes) | 140,132,160 | 150,298,560 |
| Size | 133.6 MB | 143.3 MB |
| Events in quadrant A | 806,540 | 884,152 |
| Events in quadrant B | 803,882 | 905,708 |
| Events in quadrant C | 802,572 | 852,220 |
| Events in quadrant D | 696,194 | 774,453 |
| Mode M9 | |||
|---|---|---|---|
| Quadrant | BADHDUFLAG | Total packets | Discarded packets |
| A | 1 | 139965633804328 | 139964394242094 |
| B | 1 | 139965633804328 | 139964394242094 |
| C | 1 | 139965633804328 | 139964394242094 |
| D | 1 | 139965633804328 | 139964394242094 |
| Mode M0 | |||
|---|---|---|---|
| Quadrant | BADHDUFLAG | Total packets | Discarded packets |
| A | 0 | 71146 | 0 |
| B | 0 | 70556 | 0 |
| C | 0 | 68604 | 0 |
| D | 0 | 67896 | 0 |
| Mode SS | |||
|---|---|---|---|
| Quadrant | BADHDUFLAG | Total packets | Discarded packets |
| A | 0 | 332 | 0 |
| B | 0 | 332 | 0 |
| C | 0 | 332 | 0 |
| D | 0 | 332 | 0 |
| Quadrant | Total seconds | Saturated seconds | Saturation percentage |
|---|---|---|---|
| A | 16446 | 6 | 0.036483% |
| B | 16442 | 12 | 0.072984% |
| C | 16444 | 23 | 0.139869% |
| D | 16446 | 37 | 0.224979% |
Noise dominated data is calculated using 1-second bins in cleaned event files. If a bin has >2000 counts, and if more than 50% of those come from <1% of pixels, then it is considered to be noise-dominated and hence unusable.
| Quadrant | # 1 sec bins | Bins with >0 counts | Bins with >2000 counts | High rate bins dominated by noise | Noise dominated (total time) | Noise dominated (detector-on time) | Marked lightcurve |
|---|---|---|---|---|---|---|---|
| A | 19636 | 16446 | 0 | 0 | 0.00% | 0.00% |  |
| B | 19636 | 16444 | 0 | 0 | 0.00% | 0.00% |  |
| C | 19636 | 16445 | 0 | 0 | 0.00% | 0.00% |  |
| D | 19636 | 16446 | 0 | 0 | 0.00% | 0.00% |  |
Top three noisy pixels from each quadrant. If the there are fewer than three noisy pixels in the level2.evt file, extra rows are filled as -1
| Pixel properties | Quadrant properties | ||||||
|---|---|---|---|---|---|---|---|
| Quadrant | DetID | PixID | Counts | Sigma | Mean | Median | Sigma |
| A | 14 | 188 | 735 | 10.8 | 208 | 196 | 49.9 |
| A | 0 | 29 | 722 | 10.54 | 208 | 196 | 49.9 |
| A | 7 | 110 | 639 | 8.87 | 208 | 196 | 49.9 |
| B | 2 | 9 | 656 | 11.3 | 212 | 202 | 40.2 |
| B | 14 | 254 | 528 | 8.11 | 212 | 202 | 40.2 |
| B | 10 | 225 | 500 | 7.41 | 212 | 202 | 40.2 |
| C | 2 | 191 | 550 | 6.62 | 211 | 196 | 53.5 |
| C | 1 | 81 | 548 | 6.58 | 211 | 196 | 53.5 |
| C | 12 | 241 | 548 | 6.58 | 211 | 196 | 53.5 |
| D | 6 | 44 | 515 | 6.81 | 198 | 182 | 48.9 |
| D | 11 | 82 | 498 | 6.47 | 198 | 182 | 48.9 |
| D | 6 | 231 | 492 | 6.34 | 198 | 182 | 48.9 |
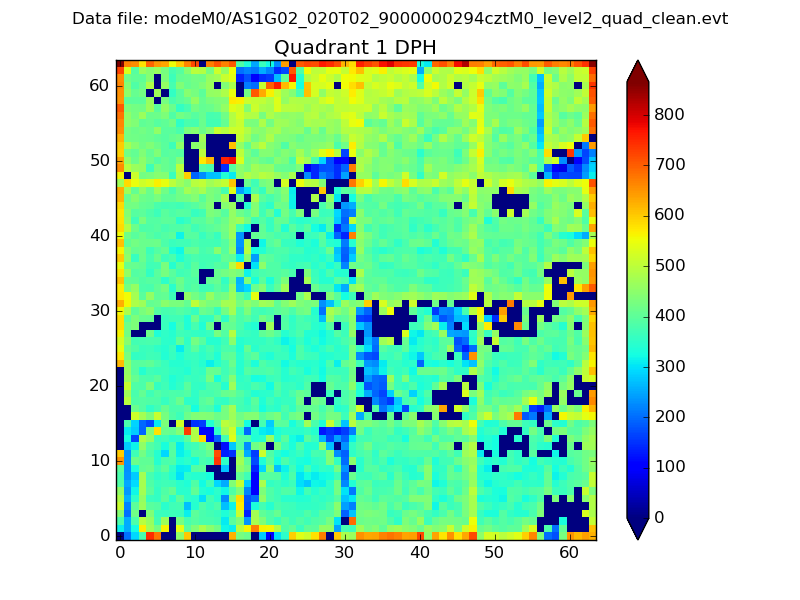
Histogram calculated using DETX and DETY for each event in the final _common_clean file
| Quadrant A |  |
 |
Quadrant B |
|---|---|---|---|
| Quadrant D |  |
 |
Quadrant C |
| Plot type | Count rate plots | Images |
|---|---|---|
| Comparison with Poisson distribution Blue bars denote a histogram of data divided into 1 sec bins. Red curve is a Poisson curve with rate = median count rate of data. |
 |
 |
| Quadrant-wise count rates Data is divided into 100 sec bins |
 |
|
| Module-wise count rates for Quadrant A Data is divided into 100 sec bins |
 |
 |
| Module-wise count rates for Quadrant B Data is divided into 100 sec bins |
 |
 |
| Module-wise count rates for Quadrant C Data is divided into 100 sec bins |
 |
 |
| Module-wise count rates for Quadrant D Data is divided into 100 sec bins |
 |
 |
| Parameter | Plot |
|---|---|
| CZT HV Monitor |  |
| D_VDD | 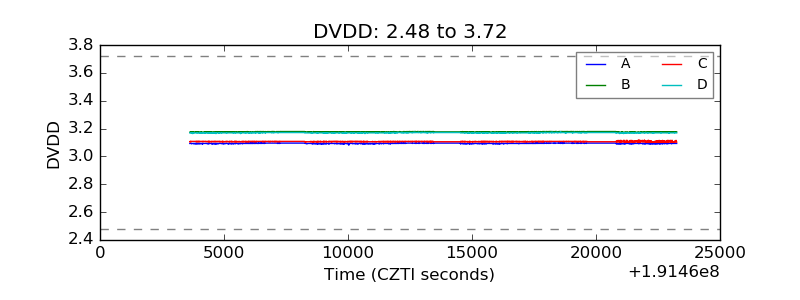 |
| Temperature 1 |  |
| Veto HV Monitor |  |
| Veto LLD |  |
| Alpha Counter |  |
| _CPM_Rate |  |
| CZT Counter |  |
| +2.5 Volts monitor |  |
| +5 Volts monitor |  |
| _ROLL_ROT |  |
| _Roll_DEC |  |
| _Roll_RA |  |
| Veto Counter |  |