| Param | Original file | Final file |
|---|---|---|
| Filename | modeM0/AS1G02_025T01_9000000298cztM0_level2.fits | modeM0/AS1G02_025T01_9000000298cztM0_level2_quad_clean.evt |
| Size (bytes) | 842,135,040 | 963,573,120 |
| Size | 803.1 MB | 918.9 MB |
| Events in quadrant A | 4,886,230 | 5,889,655 |
| Events in quadrant B | 4,855,682 | 5,973,644 |
| Events in quadrant C | 4,796,272 | 5,503,358 |
| Events in quadrant D | 4,073,128 | 4,925,576 |
| Mode SS | |||
|---|---|---|---|
| Quadrant | BADHDUFLAG | Total packets | Discarded packets |
| A | 0 | 2012 | 0 |
| B | 0 | 2012 | 0 |
| C | 0 | 2012 | 0 |
| D | 0 | 2012 | 0 |
| Mode M9 | |||
|---|---|---|---|
| Quadrant | BADHDUFLAG | Total packets | Discarded packets |
| A | 1 | 139992431392808 | 139990164045870 |
| B | 1 | 139992431392808 | 139990164045870 |
| C | 1 | 139992431392808 | 139990164045870 |
| D | 1 | 139992431392808 | 139990164045870 |
| Mode M0 | |||
|---|---|---|---|
| Quadrant | BADHDUFLAG | Total packets | Discarded packets |
| A | 0 | 438857 | 0 |
| B | 0 | 442987 | 0 |
| C | 0 | 420161 | 0 |
| D | 0 | 441035 | 0 |
| Quadrant | Total seconds | Saturated seconds | Saturation percentage |
|---|---|---|---|
| A | 100555 | 595 | 0.591716% |
| B | 100557 | 498 | 0.495242% |
| C | 100559 | 353 | 0.351038% |
| D | 100559 | 2383 | 2.369753% |
Noise dominated data is calculated using 1-second bins in cleaned event files. If a bin has >2000 counts, and if more than 50% of those come from <1% of pixels, then it is considered to be noise-dominated and hence unusable.
| Quadrant | # 1 sec bins | Bins with >0 counts | Bins with >2000 counts | High rate bins dominated by noise | Noise dominated (total time) | Noise dominated (detector-on time) | Marked lightcurve |
|---|---|---|---|---|---|---|---|
| A | 113884 | 100557 | 0 | 0 | 0.00% | 0.00% | 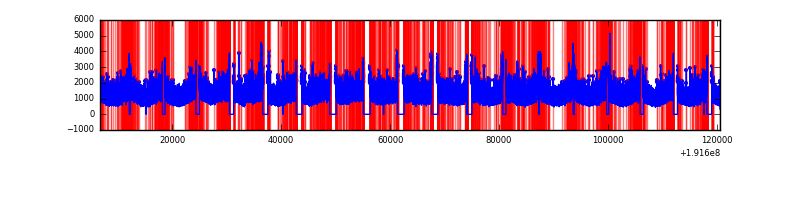 |
| B | 113884 | 100557 | 0 | 0 | 0.00% | 0.00% | 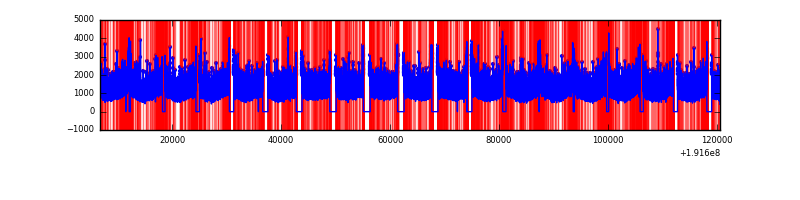 |
| C | 113884 | 100561 | 0 | 0 | 0.00% | 0.00% | 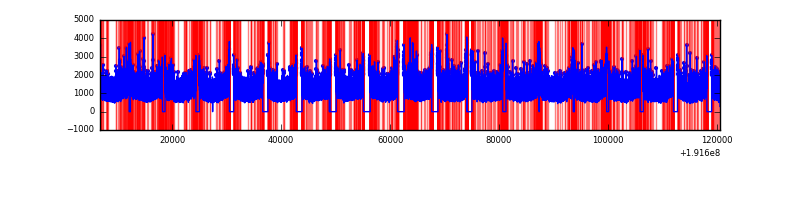 |
| D | 113884 | 100508 | 0 | 0 | 0.00% | 0.00% | 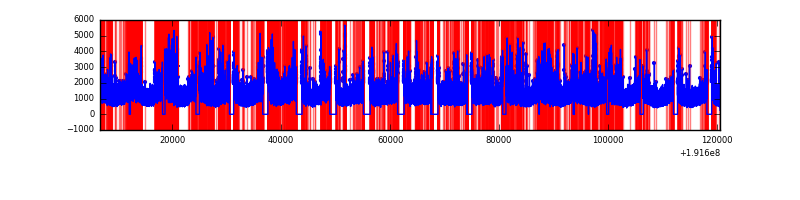 |
Top three noisy pixels from each quadrant. If the there are fewer than three noisy pixels in the level2.evt file, extra rows are filled as -1
| Pixel properties | Quadrant properties | ||||||
|---|---|---|---|---|---|---|---|
| Quadrant | DetID | PixID | Counts | Sigma | Mean | Median | Sigma |
| A | 0 | 29 | 4527 | 11.28 | 1267 | 1180 | 296.6 |
| A | 7 | 110 | 4420 | 10.92 | 1267 | 1180 | 296.6 |
| A | 0 | 30 | 3484 | 7.77 | 1267 | 1180 | 296.6 |
| B | 2 | 9 | 3740 | 10.92 | 1283 | 1215 | 231.3 |
| B | 5 | 128 | 3263 | 8.85 | 1283 | 1215 | 231.3 |
| B | 10 | 225 | 3202 | 8.59 | 1283 | 1215 | 231.3 |
| C | 12 | 241 | 3284 | 6.86 | 1265 | 1165 | 309.0 |
| C | 2 | 127 | 3143 | 6.4 | 1265 | 1165 | 309.0 |
| C | 9 | 242 | 3089 | 6.23 | 1265 | 1165 | 309.0 |
| D | 1 | 19 | 2993 | 7.07 | 1165 | 1065 | 272.8 |
| D | 6 | 231 | 2939 | 6.87 | 1165 | 1065 | 272.8 |
| D | 11 | 82 | 2830 | 6.47 | 1165 | 1065 | 272.8 |
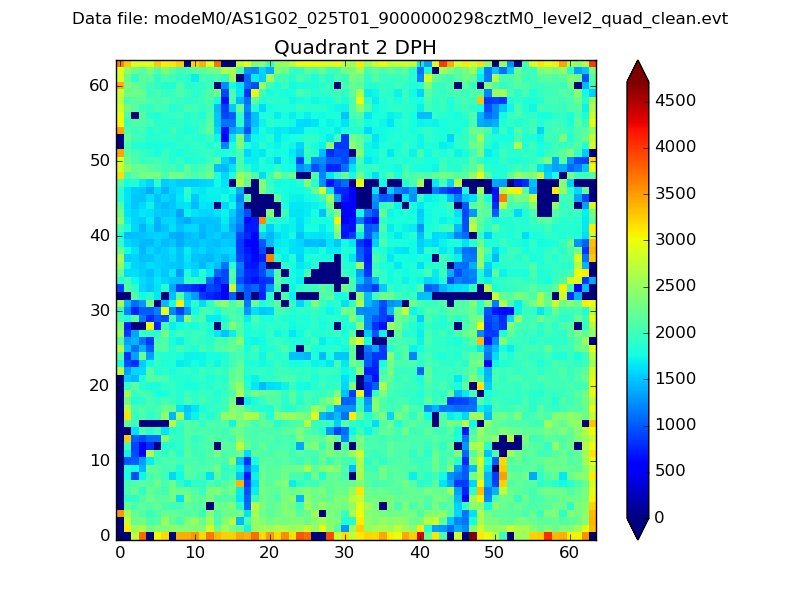
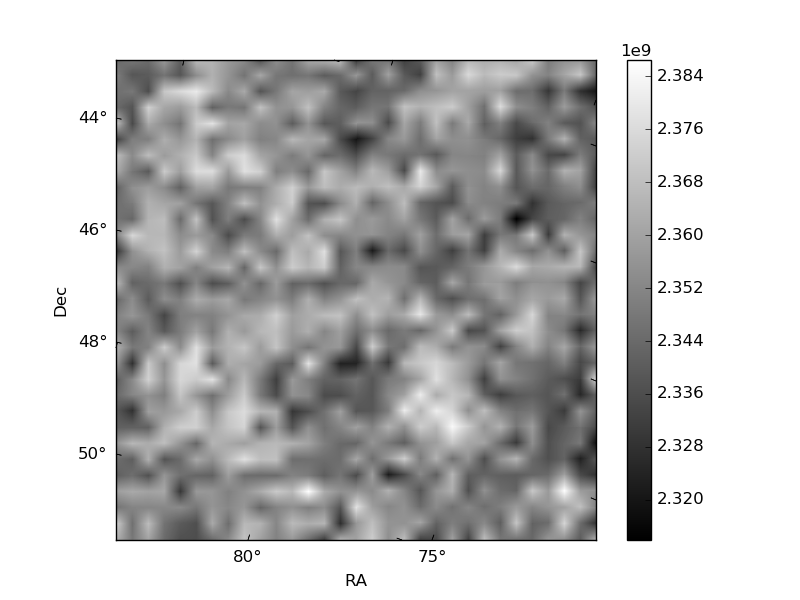
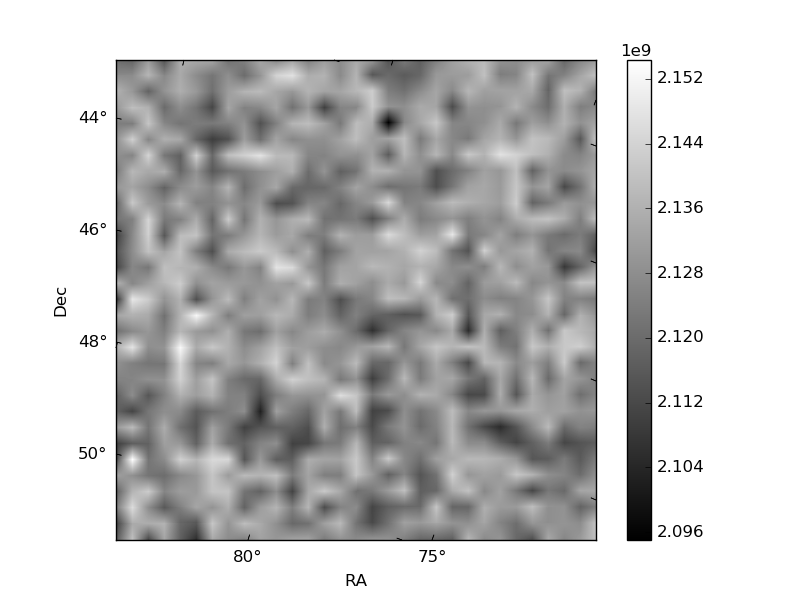
Histogram calculated using DETX and DETY for each event in the final _common_clean file
| Quadrant A | 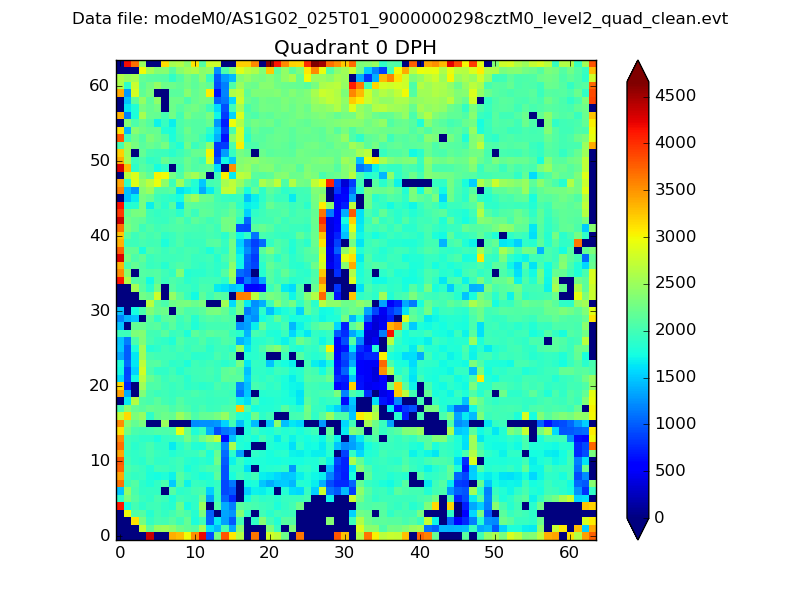 |
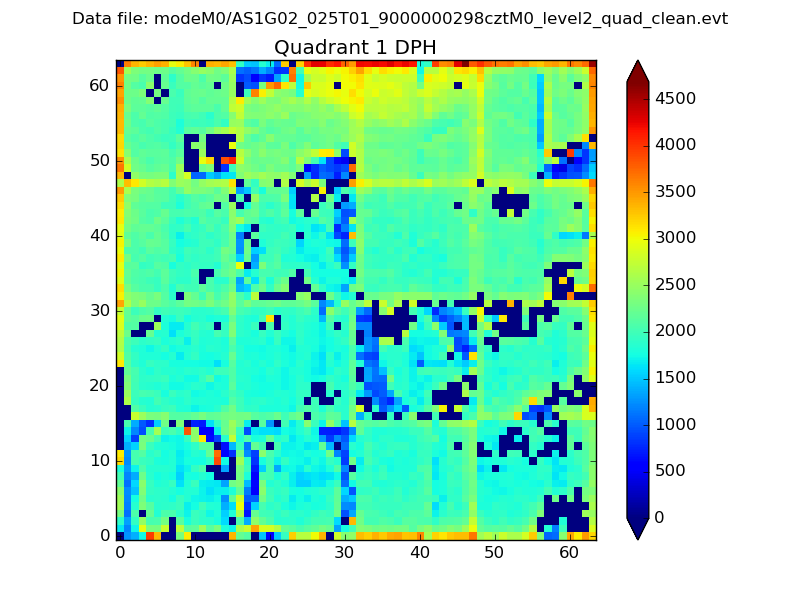 |
Quadrant B |
|---|---|---|---|
| Quadrant D | 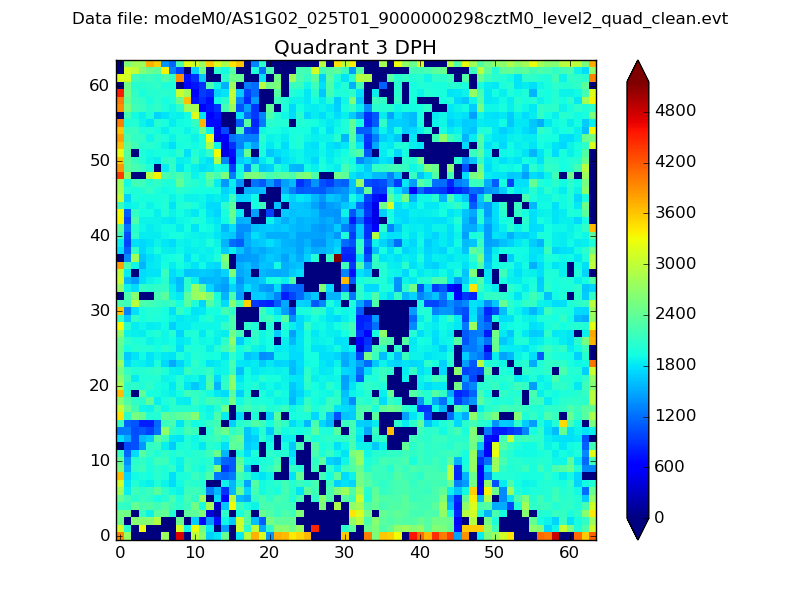 |
 |
Quadrant C |
| Plot type | Count rate plots | Images |
|---|---|---|
| Comparison with Poisson distribution Blue bars denote a histogram of data divided into 1 sec bins. Red curve is a Poisson curve with rate = median count rate of data. |
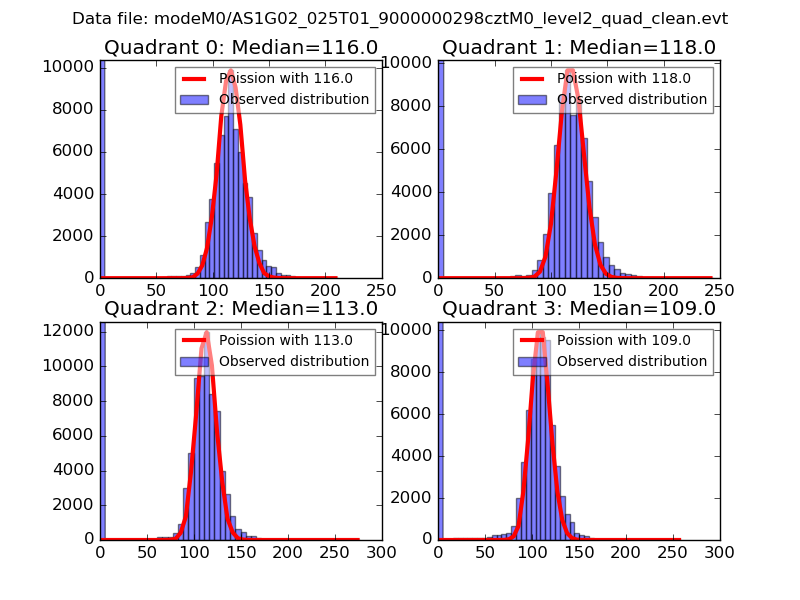 |
 |
| Quadrant-wise count rates Data is divided into 100 sec bins |
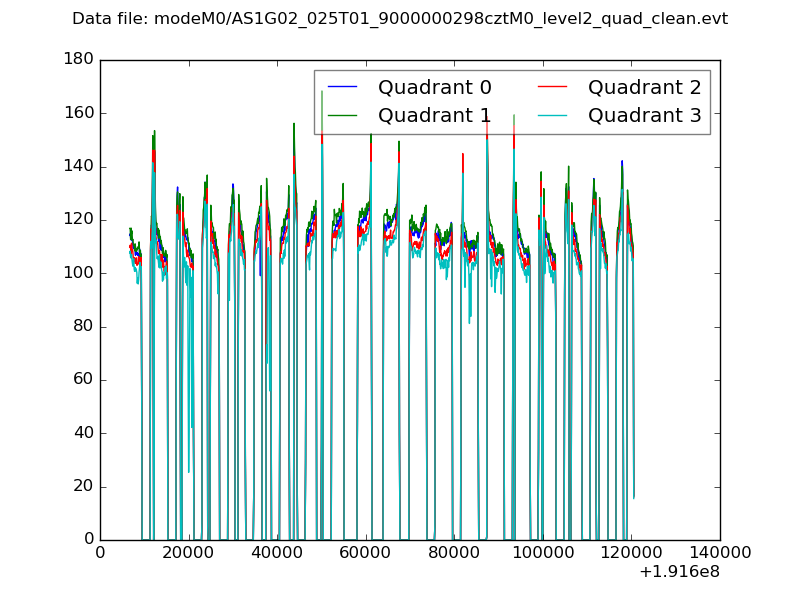 |
|
| Module-wise count rates for Quadrant A Data is divided into 100 sec bins |
 |
 |
| Module-wise count rates for Quadrant B Data is divided into 100 sec bins |
 |
 |
| Module-wise count rates for Quadrant C Data is divided into 100 sec bins |
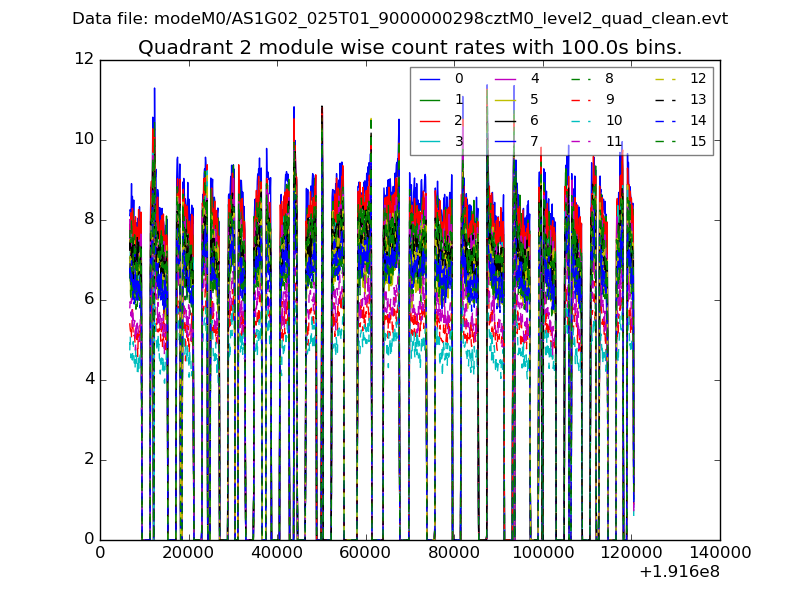 |
 |
| Module-wise count rates for Quadrant D Data is divided into 100 sec bins |
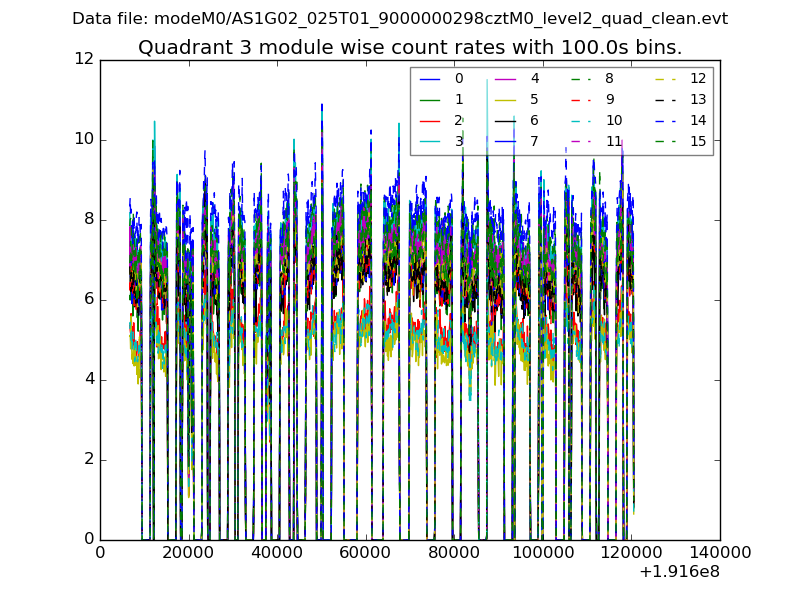 |
 |
| Parameter | Plot |
|---|---|
| CZT HV Monitor |  |
| D_VDD | 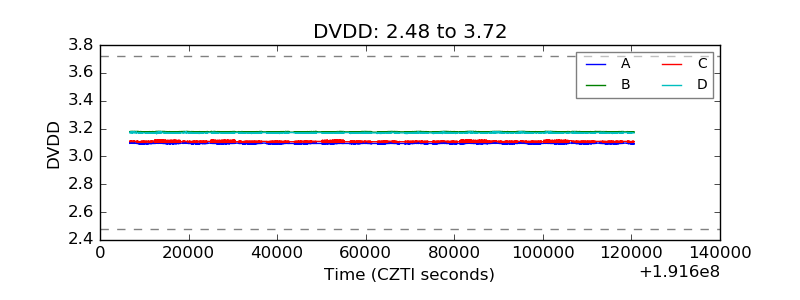 |
| Temperature 1 |  |
| Veto HV Monitor |  |
| Veto LLD | 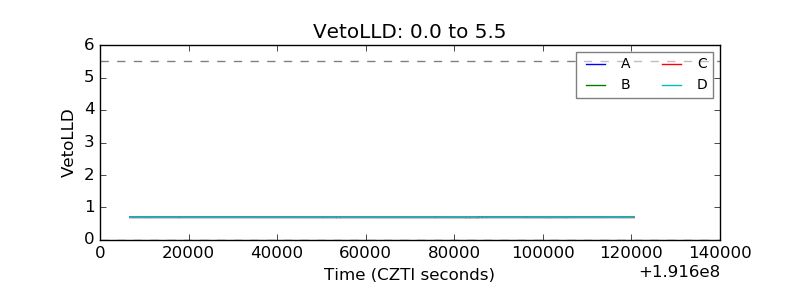 |
| Alpha Counter |  |
| _CPM_Rate | 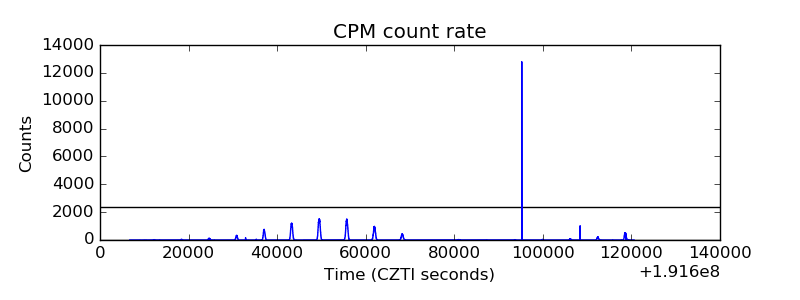 |
| CZT Counter |  |
| +2.5 Volts monitor | 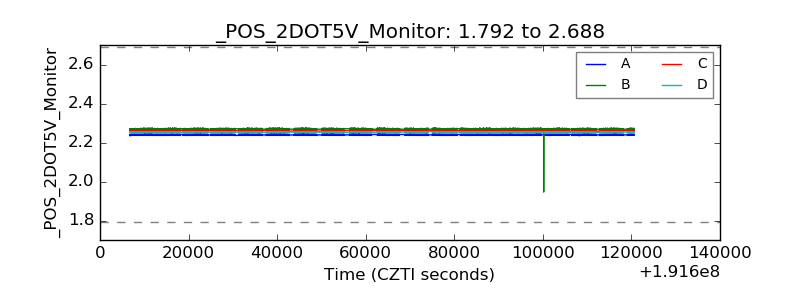 |
| +5 Volts monitor |  |
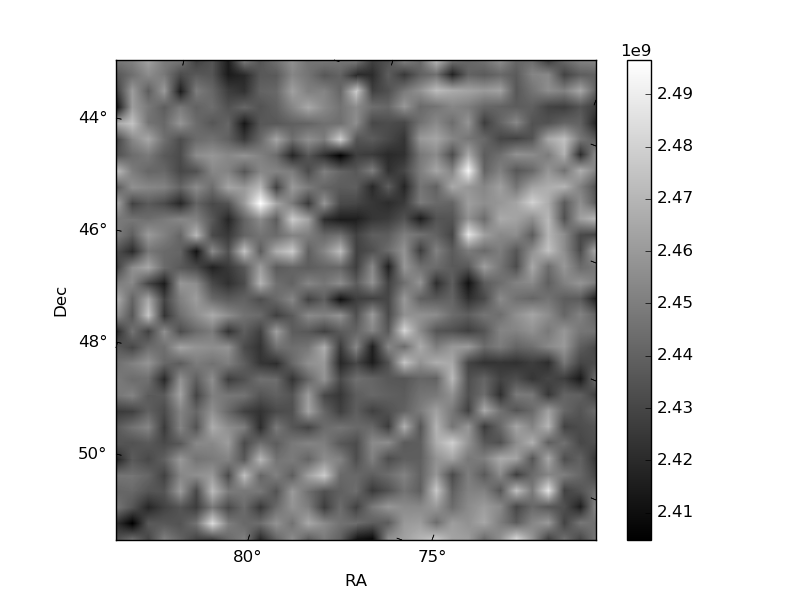
| _ROLL_ROT | 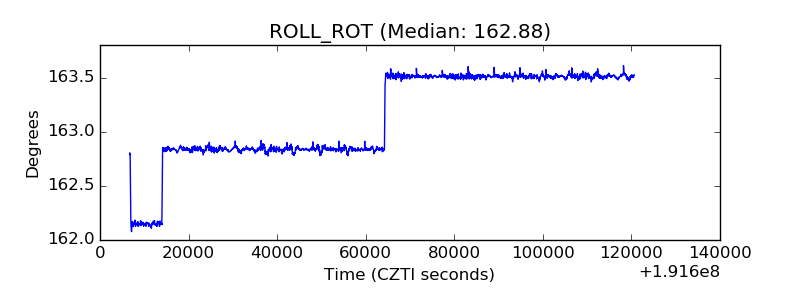 |
| _Roll_DEC | 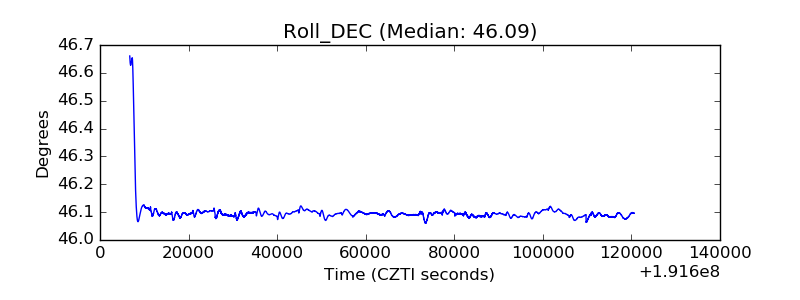 |
| _Roll_RA | 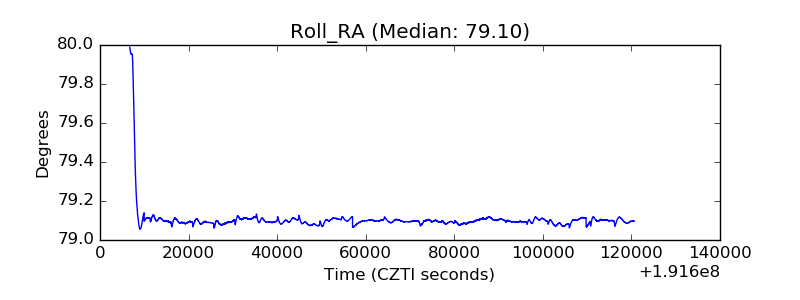 |
| Veto Counter | 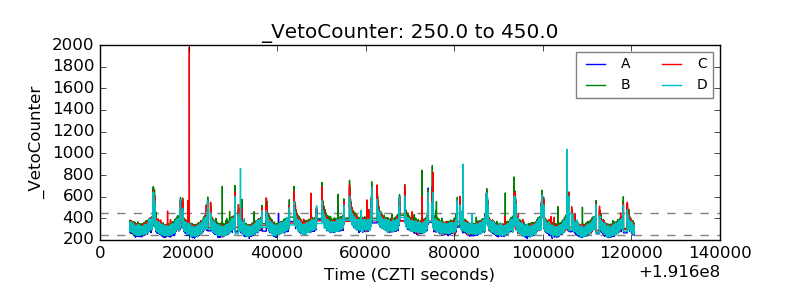 |