| Param | Original file | Final file |
|---|---|---|
| Filename | modeM0/AS1G02_021T11_9000000300cztM0_level2.fits | modeM0/AS1G02_021T11_9000000300cztM0_level2_quad_clean.evt |
| Size (bytes) | 177,825,600 | 193,078,080 |
| Size | 169.6 MB | 184.1 MB |
| Events in quadrant A | 1,036,184 | 1,129,941 |
| Events in quadrant B | 1,032,412 | 1,165,550 |
| Events in quadrant C | 1,019,414 | 1,124,558 |
| Events in quadrant D | 884,976 | 1,014,249 |
| Mode M0 | |||
|---|---|---|---|
| Quadrant | BADHDUFLAG | Total packets | Discarded packets |
| A | 0 | 89482 | 0 |
| B | 0 | 88344 | 0 |
| C | 0 | 82611 | 0 |
| D | 0 | 82210 | 0 |
| Mode M9 | |||
|---|---|---|---|
| Quadrant | BADHDUFLAG | Total packets | Discarded packets |
| A | 1 | 139649767860264 | 139646566662190 |
| B | 1 | 139649767860264 | 139646566662190 |
| C | 1 | 139649767860264 | 139646566662190 |
| D | 1 | 139649767860264 | 139646566662190 |
| Mode SS | |||
|---|---|---|---|
| Quadrant | BADHDUFLAG | Total packets | Discarded packets |
| A | 0 | 412 | 0 |
| B | 0 | 412 | 0 |
| C | 0 | 412 | 0 |
| D | 0 | 412 | 0 |
| Quadrant | Total seconds | Saturated seconds | Saturation percentage |
|---|---|---|---|
| A | 20505 | 112 | 0.546208% |
| B | 20507 | 112 | 0.546155% |
| C | 20508 | 63 | 0.307197% |
| D | 20510 | 216 | 1.053145% |
Noise dominated data is calculated using 1-second bins in cleaned event files. If a bin has >2000 counts, and if more than 50% of those come from <1% of pixels, then it is considered to be noise-dominated and hence unusable.
| Quadrant | # 1 sec bins | Bins with >0 counts | Bins with >2000 counts | High rate bins dominated by noise | Noise dominated (total time) | Noise dominated (detector-on time) | Marked lightcurve |
|---|---|---|---|---|---|---|---|
| A | 25274 | 20512 | 0 | 0 | 0.00% | 0.00% | 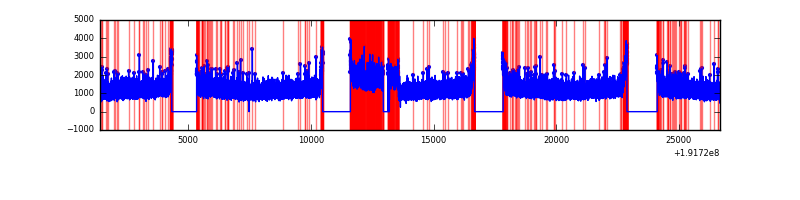 |
| B | 25274 | 20515 | 0 | 0 | 0.00% | 0.00% | 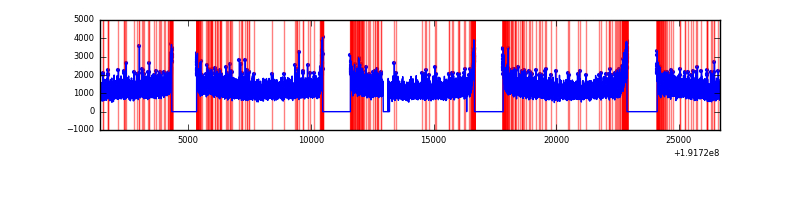 |
| C | 25274 | 20514 | 0 | 0 | 0.00% | 0.00% | 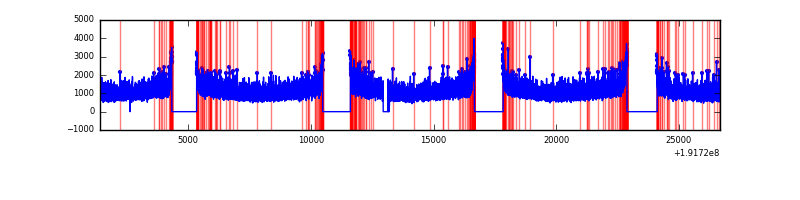 |
| D | 25274 | 20515 | 0 | 0 | 0.00% | 0.00% |  |
Top three noisy pixels from each quadrant. If the there are fewer than three noisy pixels in the level2.evt file, extra rows are filled as -1
| Pixel properties | Quadrant properties | ||||||
|---|---|---|---|---|---|---|---|
| Quadrant | DetID | PixID | Counts | Sigma | Mean | Median | Sigma |
| A | 0 | 29 | 918 | 10.37 | 268 | 251 | 64.3 |
| A | 7 | 110 | 918 | 10.37 | 268 | 251 | 64.3 |
| A | 14 | 79 | 765 | 7.99 | 268 | 251 | 64.3 |
| B | 2 | 9 | 787 | 10.26 | 272 | 259 | 51.5 |
| B | 5 | 128 | 695 | 8.47 | 272 | 259 | 51.5 |
| B | 10 | 225 | 649 | 7.58 | 272 | 259 | 51.5 |
| C | 12 | 241 | 760 | 7.58 | 268 | 249 | 67.4 |
| C | 2 | 127 | 688 | 6.51 | 268 | 249 | 67.4 |
| C | 9 | 242 | 686 | 6.48 | 268 | 249 | 67.4 |
| D | 6 | 231 | 655 | 7.03 | 252 | 231 | 60.3 |
| D | 1 | 19 | 649 | 6.93 | 252 | 231 | 60.3 |
| D | 3 | 30 | 640 | 6.78 | 252 | 231 | 60.3 |
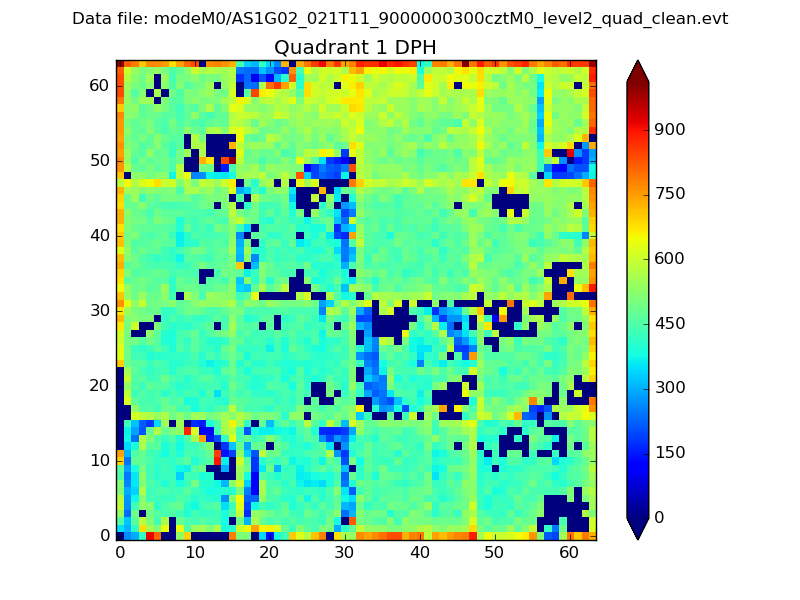
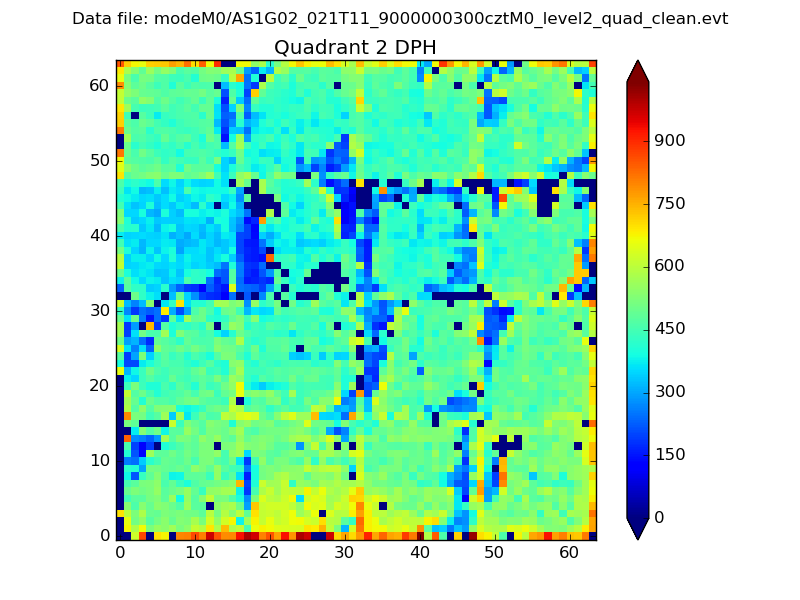
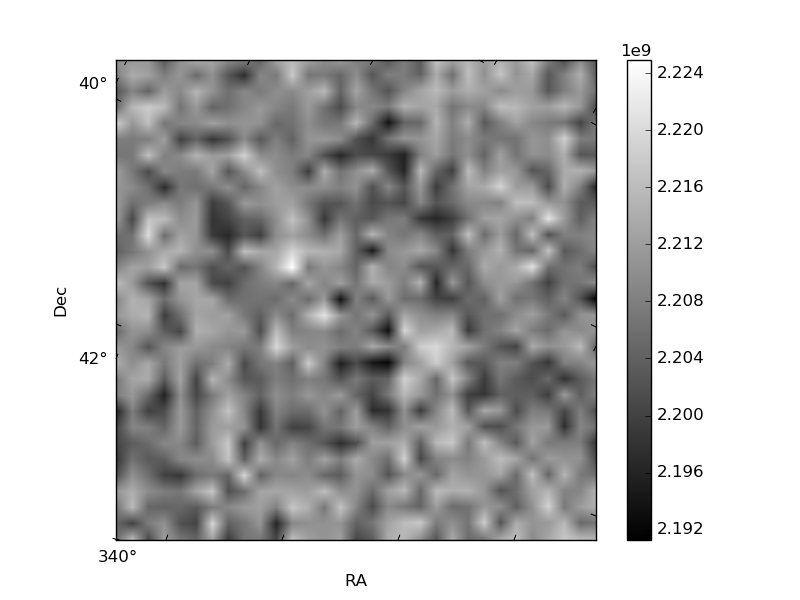
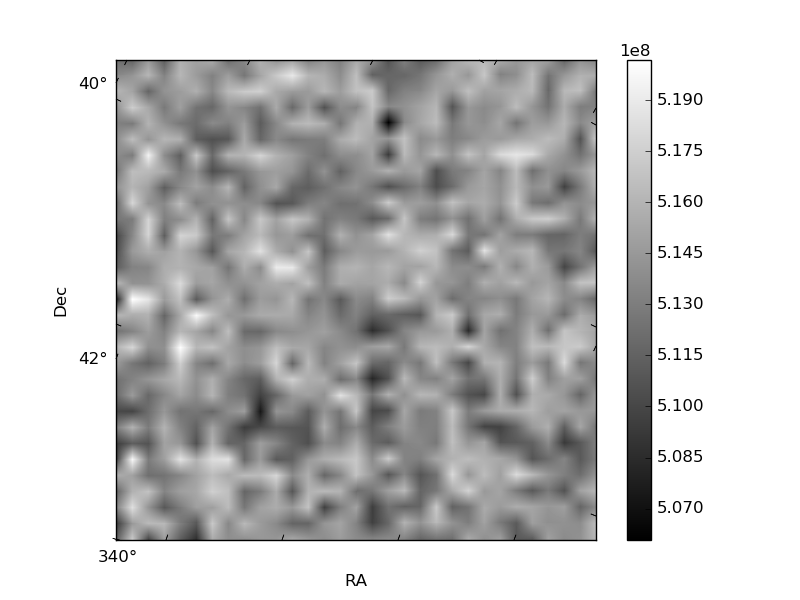
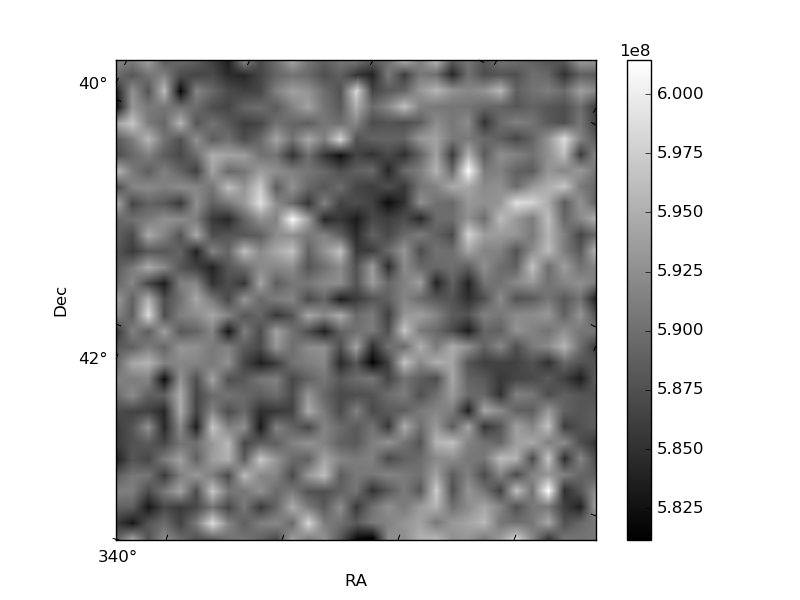
Histogram calculated using DETX and DETY for each event in the final _common_clean file
| Quadrant A | 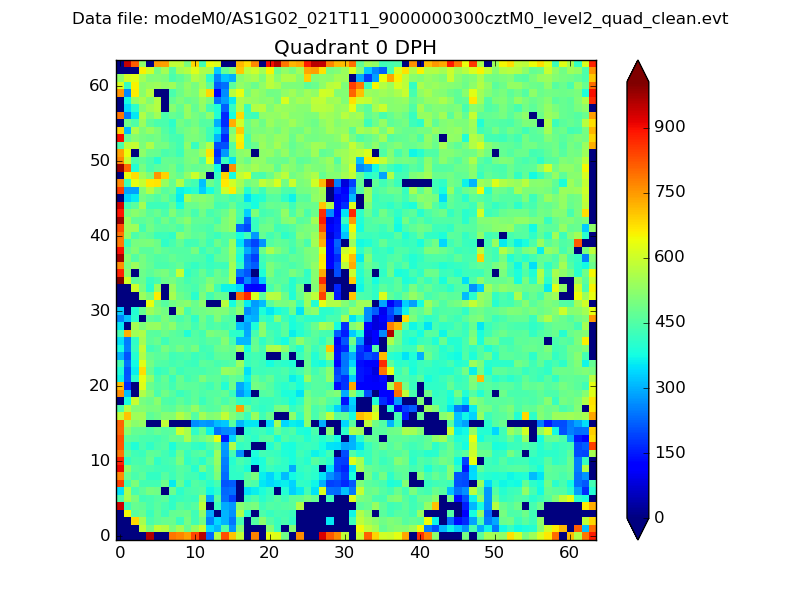 |
 |
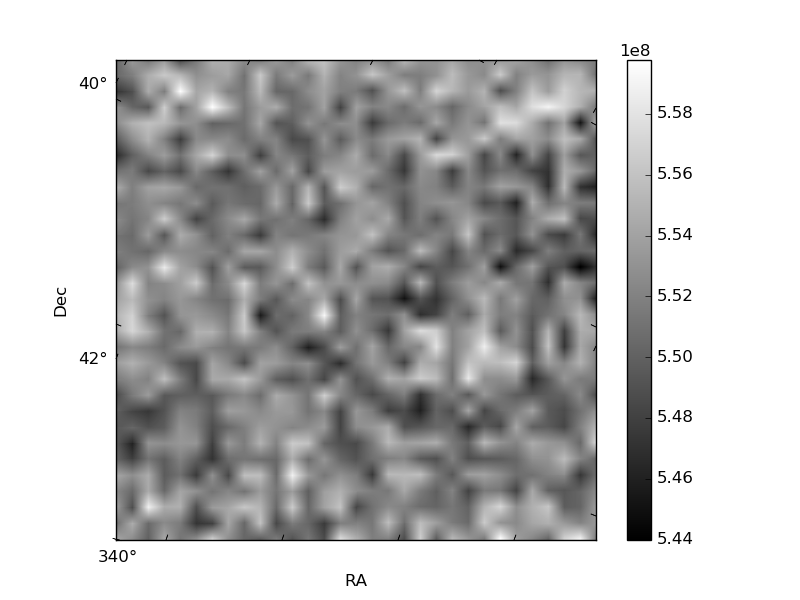
Quadrant B |
|---|---|---|---|
| Quadrant D | 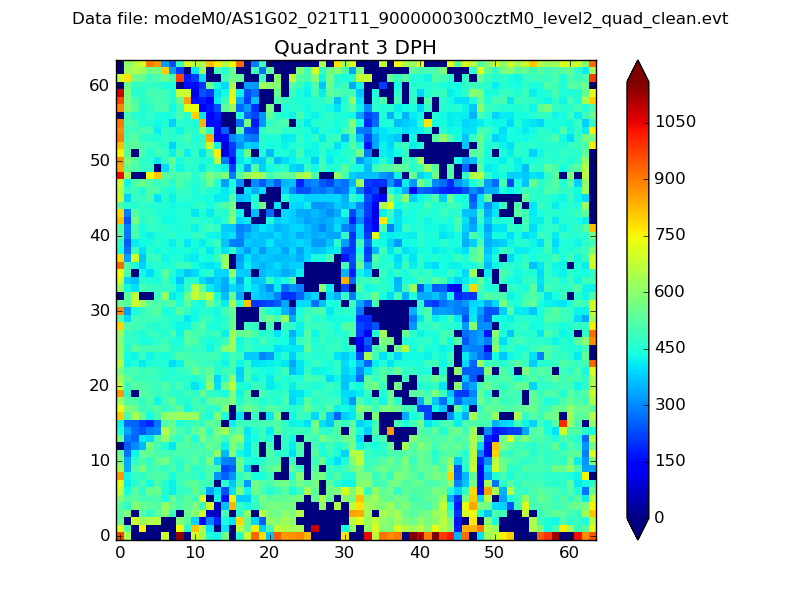 |
 |
Quadrant C |
| Plot type | Count rate plots | Images |
|---|---|---|
| Comparison with Poisson distribution Blue bars denote a histogram of data divided into 1 sec bins. Red curve is a Poisson curve with rate = median count rate of data. |
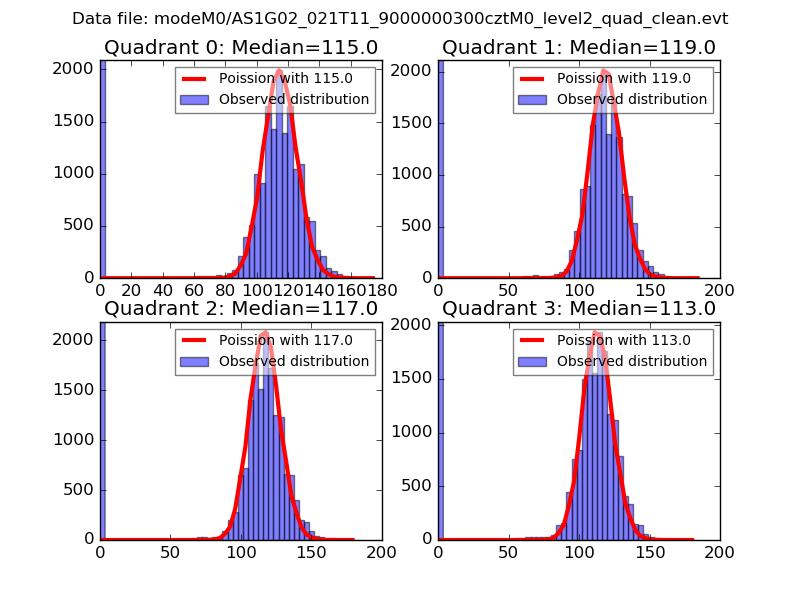 |
 |
| Quadrant-wise count rates Data is divided into 100 sec bins |
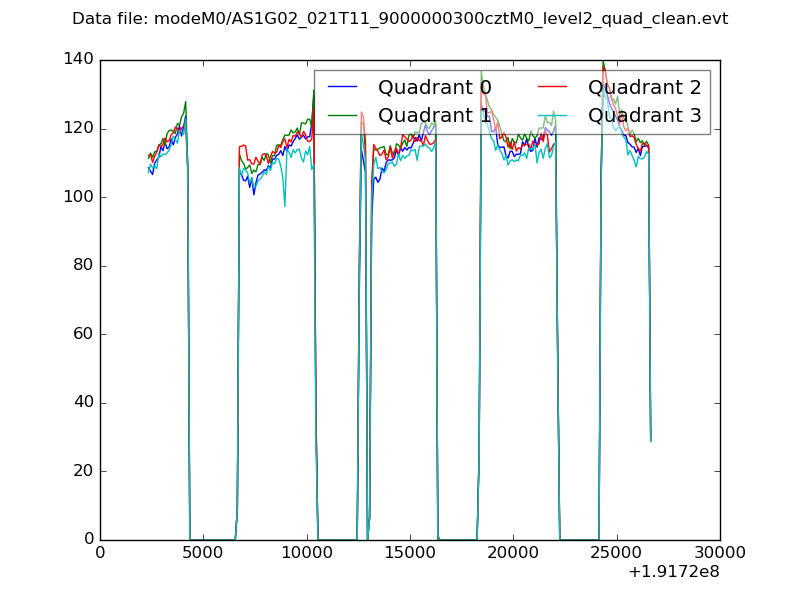 |
|
| Module-wise count rates for Quadrant A Data is divided into 100 sec bins |
 |
 |
| Module-wise count rates for Quadrant B Data is divided into 100 sec bins |
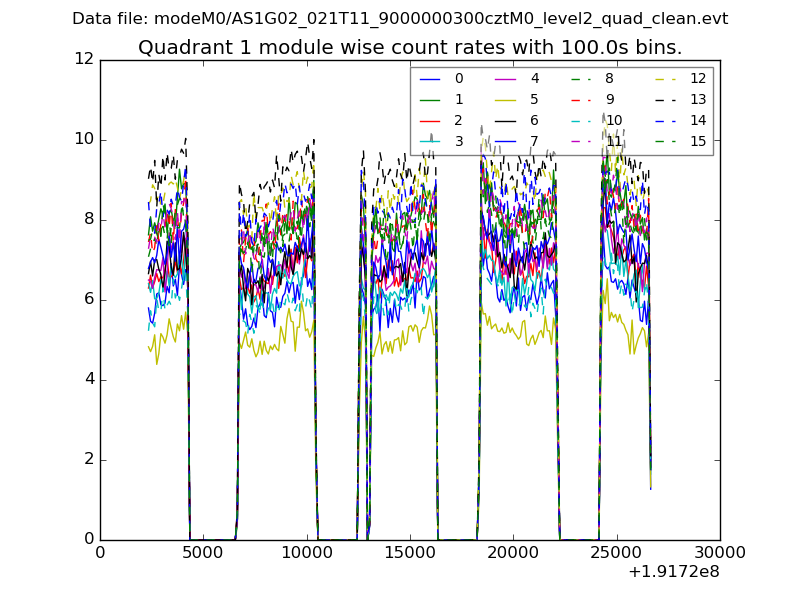 |
 |
| Module-wise count rates for Quadrant C Data is divided into 100 sec bins |
 |
 |
| Module-wise count rates for Quadrant D Data is divided into 100 sec bins |
 |
 |
| Parameter | Plot |
|---|---|
| CZT HV Monitor | 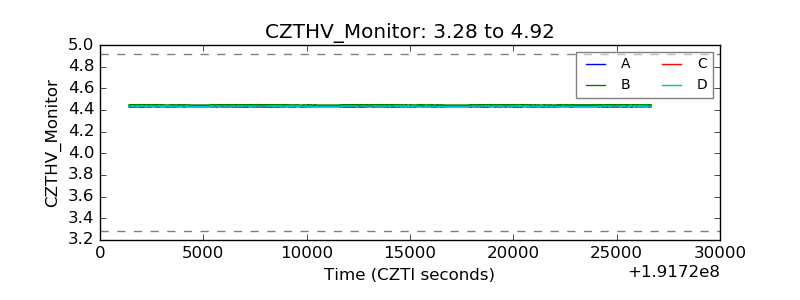 |
| D_VDD | 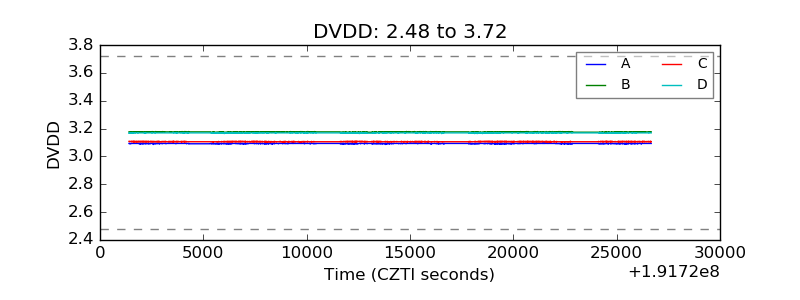 |
| Temperature 1 | 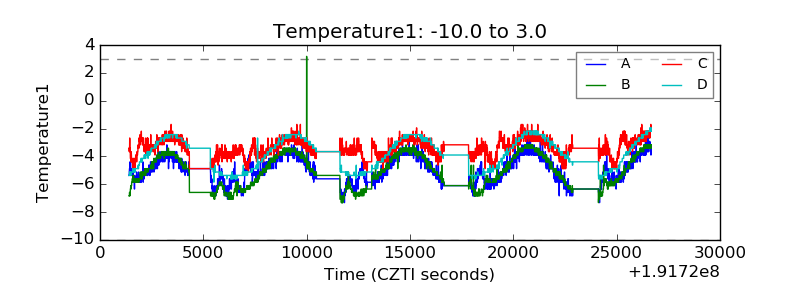 |
| Veto HV Monitor | 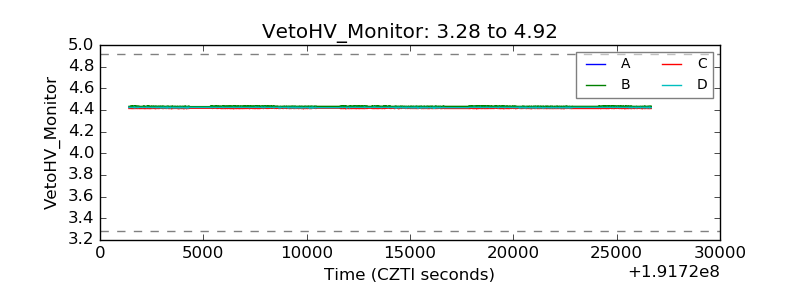 |
| Veto LLD |  |
| Alpha Counter | 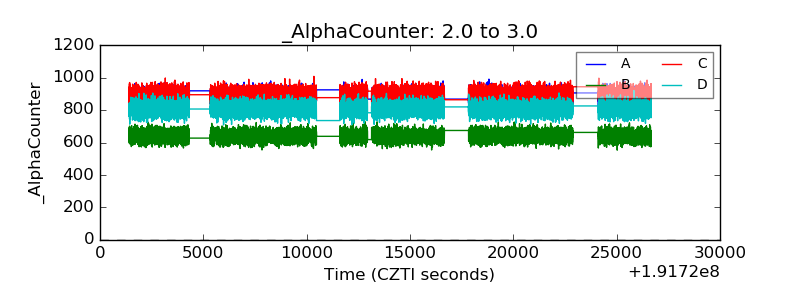 |
| _CPM_Rate | 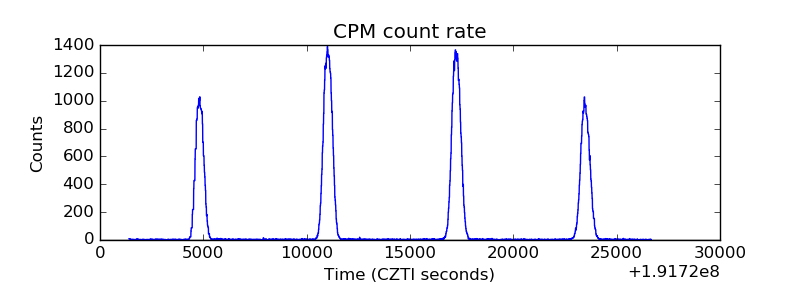 |
| CZT Counter | 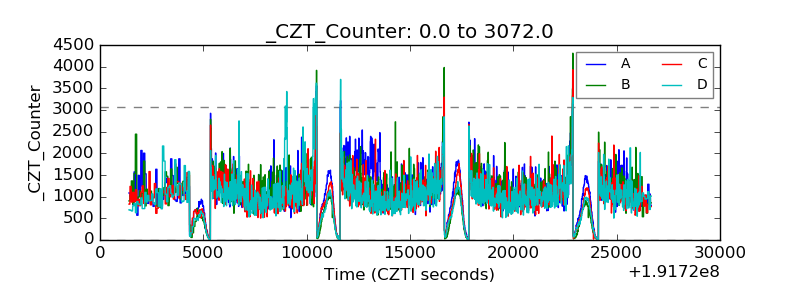 |
| +2.5 Volts monitor |  |
| +5 Volts monitor | 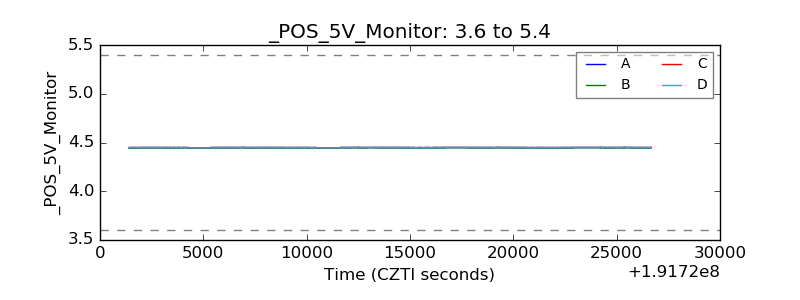 |
| _ROLL_ROT |  |
| _Roll_DEC | 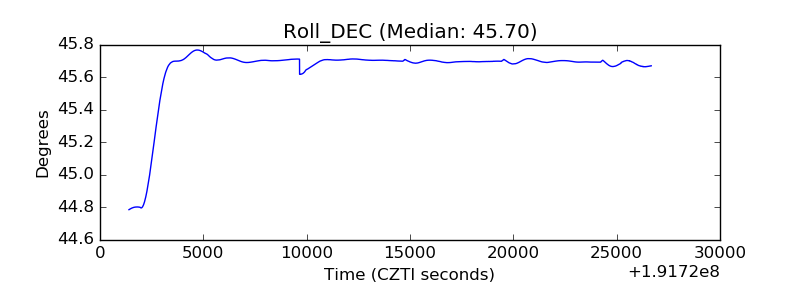 |
| _Roll_RA | 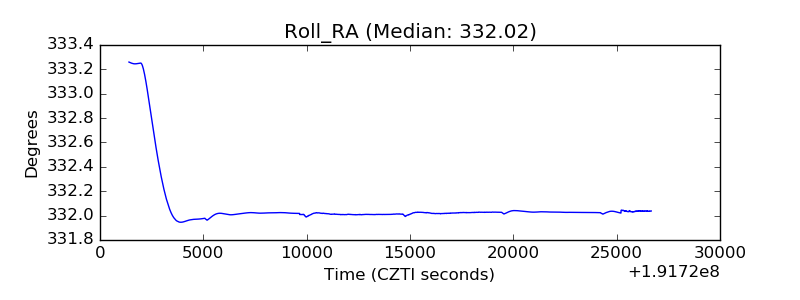 |
| Veto Counter | 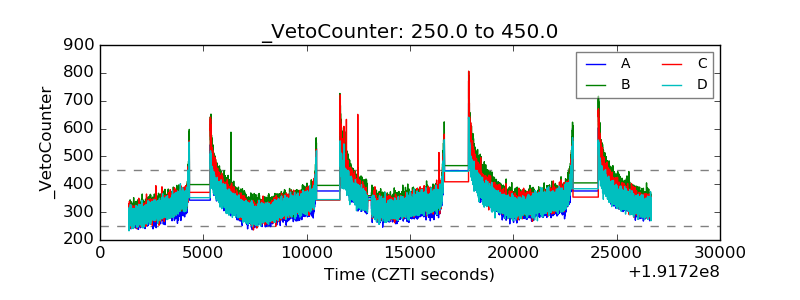 |