| Param | Original file | Final file |
|---|---|---|
| Filename | modeM0/AS1G02_021T08_9000000302cztM0_level2.fits | modeM0/AS1G02_021T08_9000000302cztM0_level2_quad_clean.evt |
| Size (bytes) | 441,144,000 | 456,779,520 |
| Size | 420.7 MB | 435.6 MB |
| Events in quadrant A | 2,545,816 | 2,651,249 |
| Events in quadrant B | 2,500,076 | 2,642,986 |
| Events in quadrant C | 2,518,812 | 2,560,099 |
| Events in quadrant D | 2,178,816 | 2,363,395 |
| Mode M9 | |||
|---|---|---|---|
| Quadrant | BADHDUFLAG | Total packets | Discarded packets |
| A | 1 | 139742729005096 | 139741055942702 |
| B | 1 | 139742729005096 | 139741055942702 |
| C | 1 | 139742729005096 | 139741055942702 |
| D | 1 | 139742729005096 | 139741055942702 |
| Mode M0 | |||
|---|---|---|---|
| Quadrant | BADHDUFLAG | Total packets | Discarded packets |
| A | 0 | 225905 | 0 |
| B | 0 | 259983 | 0 |
| C | 0 | 219534 | 0 |
| D | 0 | 214540 | 0 |
| Mode SS | |||
|---|---|---|---|
| Quadrant | BADHDUFLAG | Total packets | Discarded packets |
| A | 0 | 1058 | 0 |
| B | 0 | 1058 | 0 |
| C | 0 | 1057 | 0 |
| D | 0 | 1058 | 0 |
| Quadrant | Total seconds | Saturated seconds | Saturation percentage |
|---|---|---|---|
| A | 52694 | 344 | 0.652826% |
| B | 52690 | 1219 | 2.313532% |
| C | 52692 | 302 | 0.573142% |
| D | 52692 | 668 | 1.267745% |
Noise dominated data is calculated using 1-second bins in cleaned event files. If a bin has >2000 counts, and if more than 50% of those come from <1% of pixels, then it is considered to be noise-dominated and hence unusable.
| Quadrant | # 1 sec bins | Bins with >0 counts | Bins with >2000 counts | High rate bins dominated by noise | Noise dominated (total time) | Noise dominated (detector-on time) | Marked lightcurve |
|---|---|---|---|---|---|---|---|
| A | 59451 | 52694 | 0 | 0 | 0.00% | 0.00% | 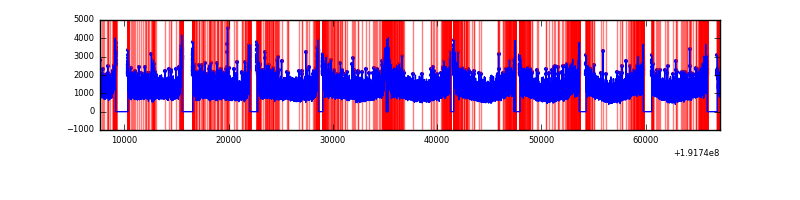 |
| B | 59451 | 52693 | 0 | 0 | 0.00% | 0.00% | 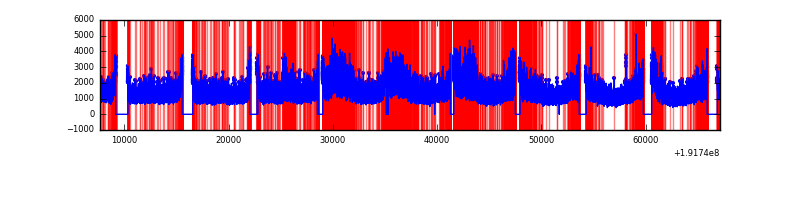 |
| C | 59451 | 52694 | 0 | 0 | 0.00% | 0.00% | 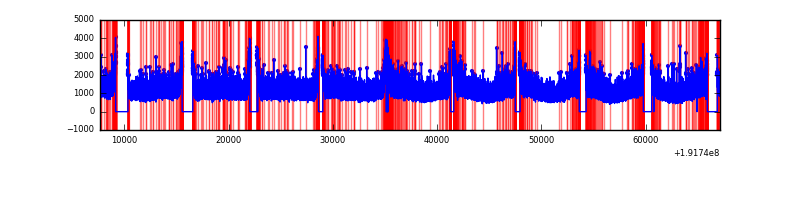 |
| D | 59451 | 52691 | 0 | 0 | 0.00% | 0.00% | 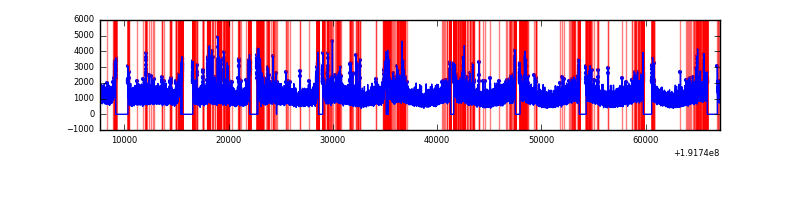 |
Top three noisy pixels from each quadrant. If the there are fewer than three noisy pixels in the level2.evt file, extra rows are filled as -1
| Pixel properties | Quadrant properties | ||||||
|---|---|---|---|---|---|---|---|
| Quadrant | DetID | PixID | Counts | Sigma | Mean | Median | Sigma |
| A | 0 | 29 | 2340 | 11.0 | 661 | 615 | 156.8 |
| A | 7 | 110 | 2301 | 10.75 | 661 | 615 | 156.8 |
| A | 0 | 30 | 1829 | 7.74 | 661 | 615 | 156.8 |
| B | 2 | 9 | 1931 | 10.66 | 660 | 626 | 122.4 |
| B | 10 | 225 | 1626 | 8.17 | 660 | 626 | 122.4 |
| B | 14 | 254 | 1602 | 7.97 | 660 | 626 | 122.4 |
| C | 12 | 241 | 1772 | 7.13 | 664 | 612 | 162.8 |
| C | 9 | 242 | 1673 | 6.52 | 664 | 612 | 162.8 |
| C | 3 | 235 | 1598 | 6.06 | 664 | 612 | 162.8 |
| D | 1 | 19 | 1603 | 7.06 | 621 | 568 | 146.6 |
| D | 11 | 82 | 1539 | 6.62 | 621 | 568 | 146.6 |
| D | 6 | 231 | 1537 | 6.61 | 621 | 568 | 146.6 |
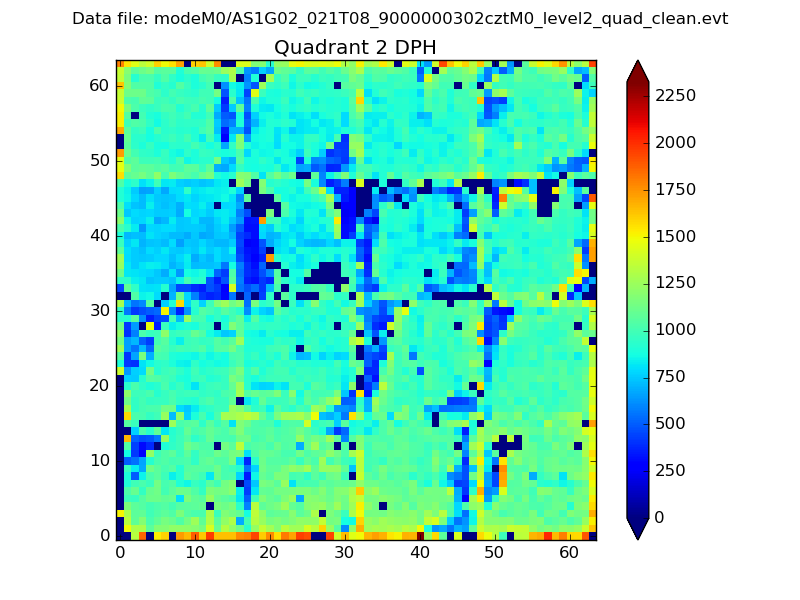
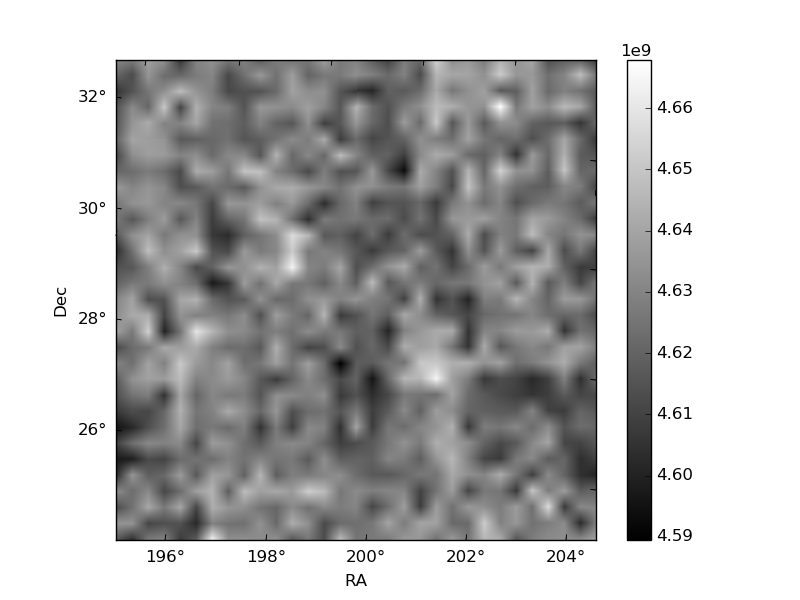
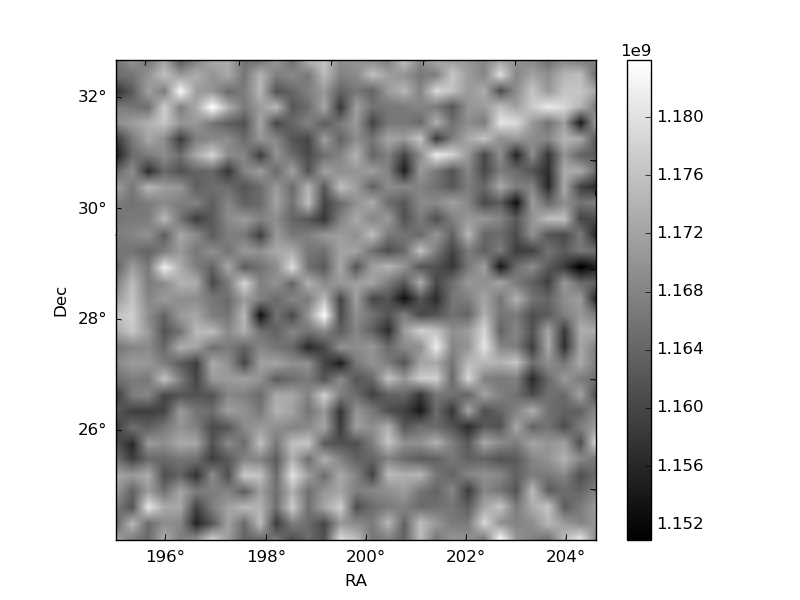
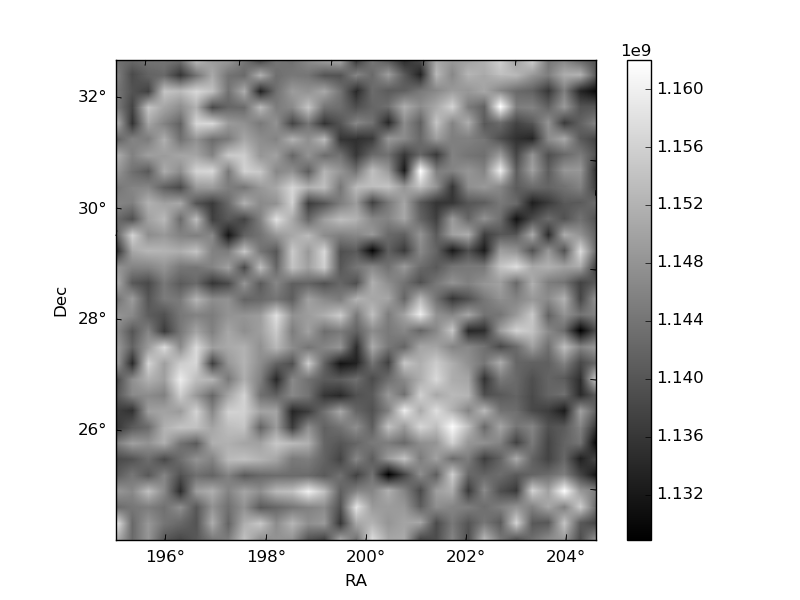
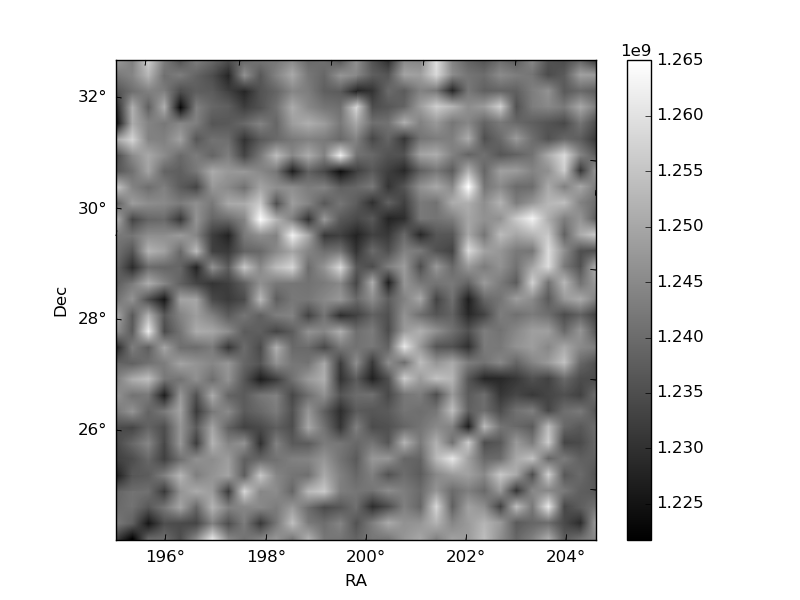
Histogram calculated using DETX and DETY for each event in the final _common_clean file
| Quadrant A | 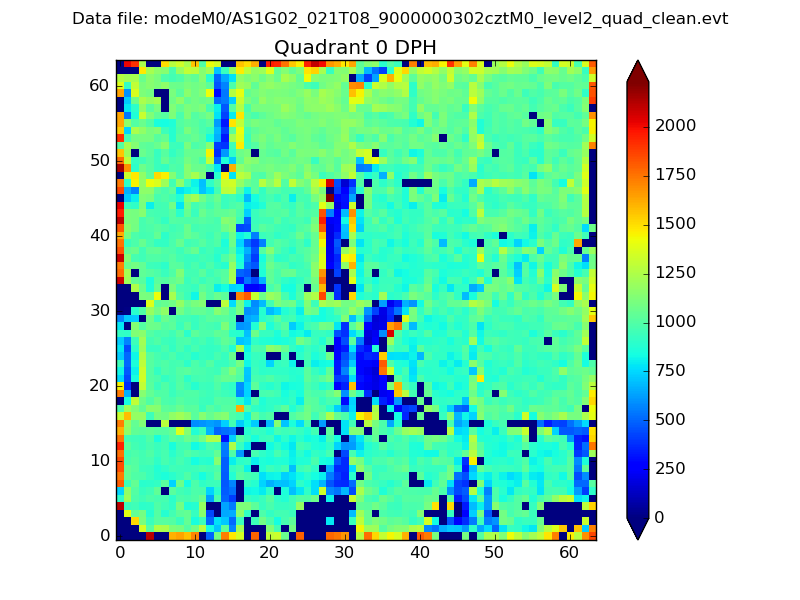 |
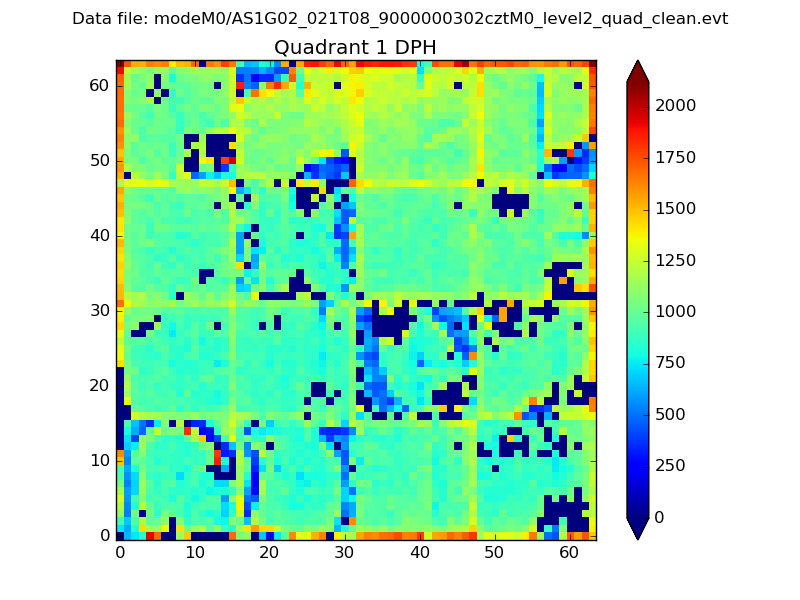 |
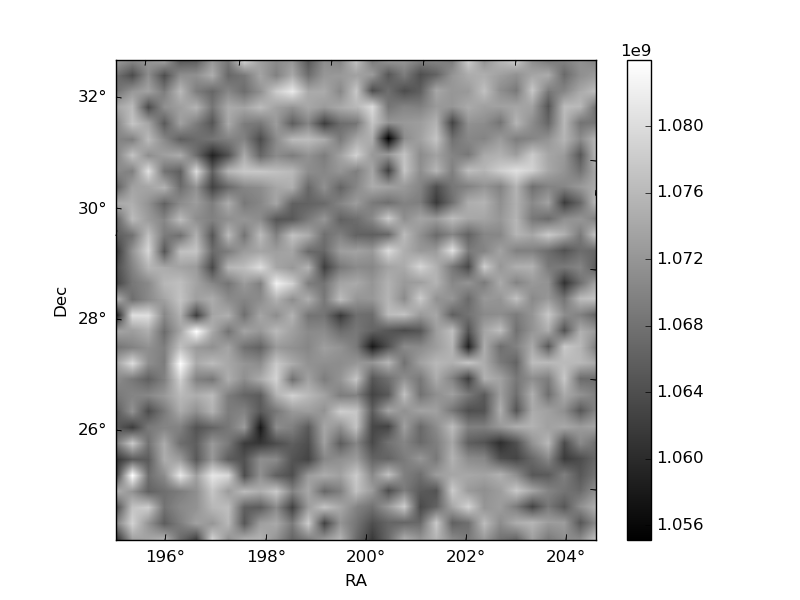
Quadrant B |
|---|---|---|---|
| Quadrant D | 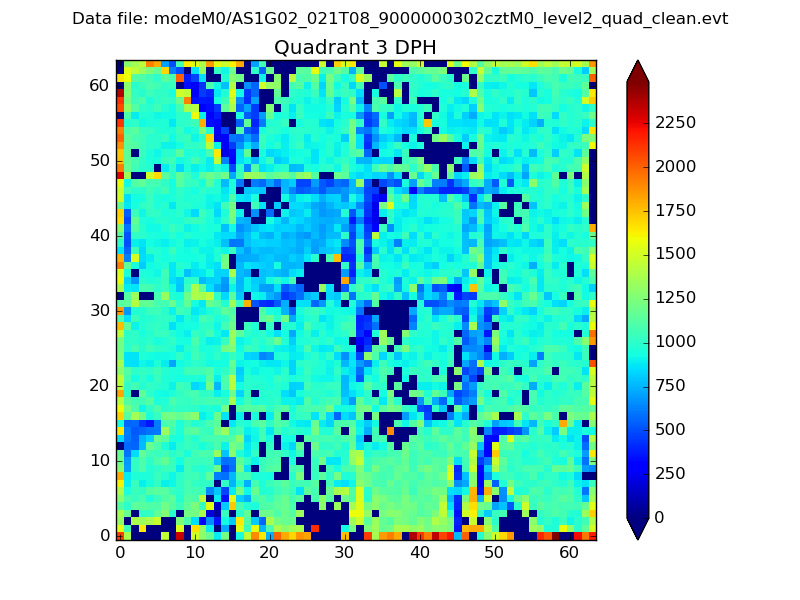 |
 |
Quadrant C |
| Plot type | Count rate plots | Images |
|---|---|---|
| Comparison with Poisson distribution Blue bars denote a histogram of data divided into 1 sec bins. Red curve is a Poisson curve with rate = median count rate of data. |
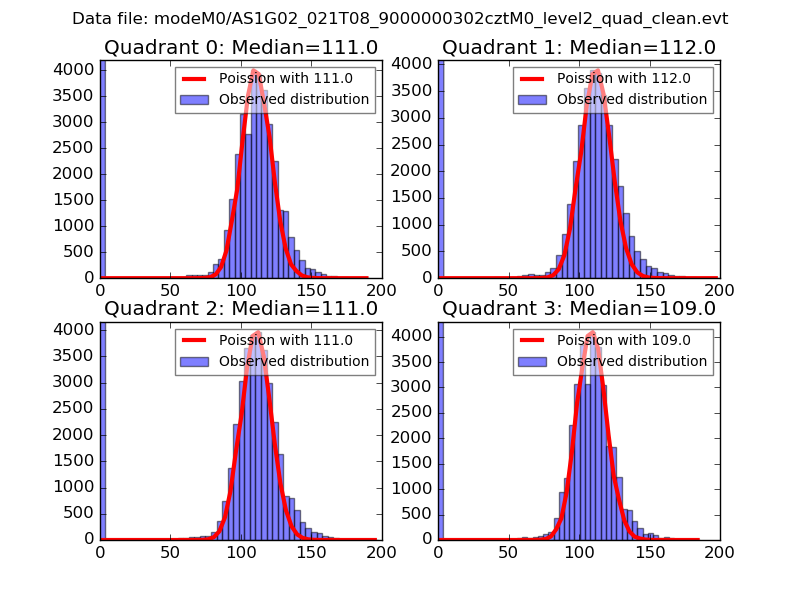 |
 |
| Quadrant-wise count rates Data is divided into 100 sec bins |
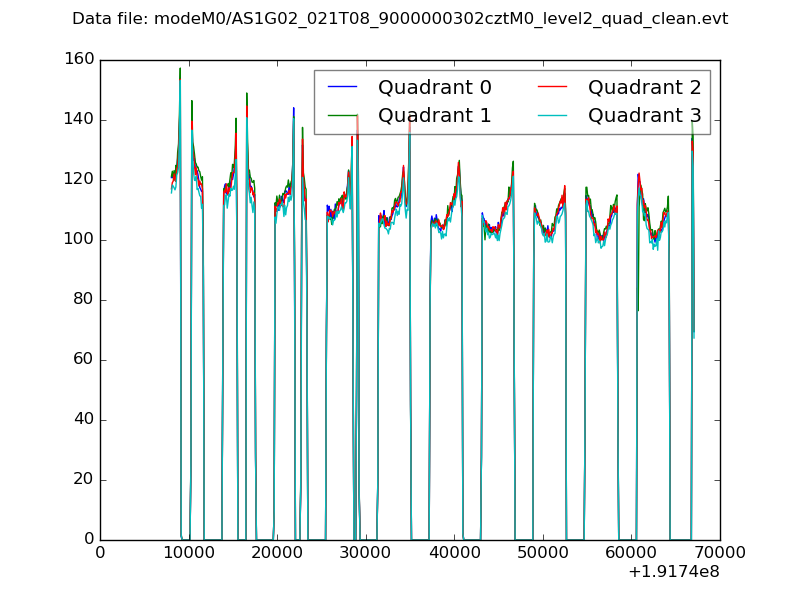 |
|
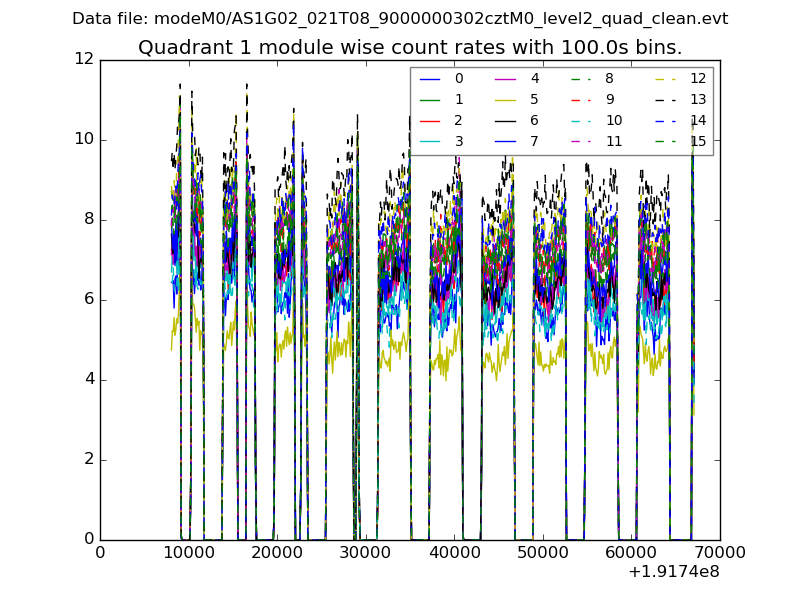
| Module-wise count rates for Quadrant A Data is divided into 100 sec bins |
 |
 |
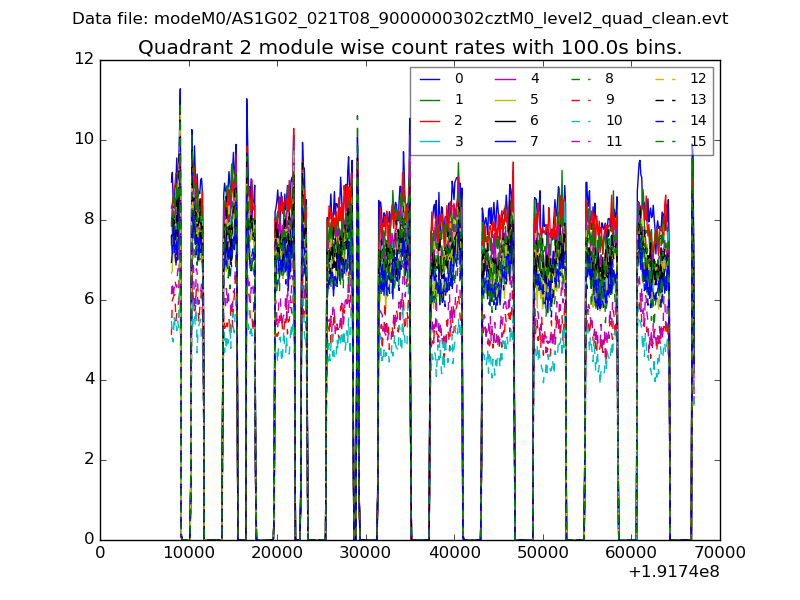
| Module-wise count rates for Quadrant B Data is divided into 100 sec bins |
 |
 |
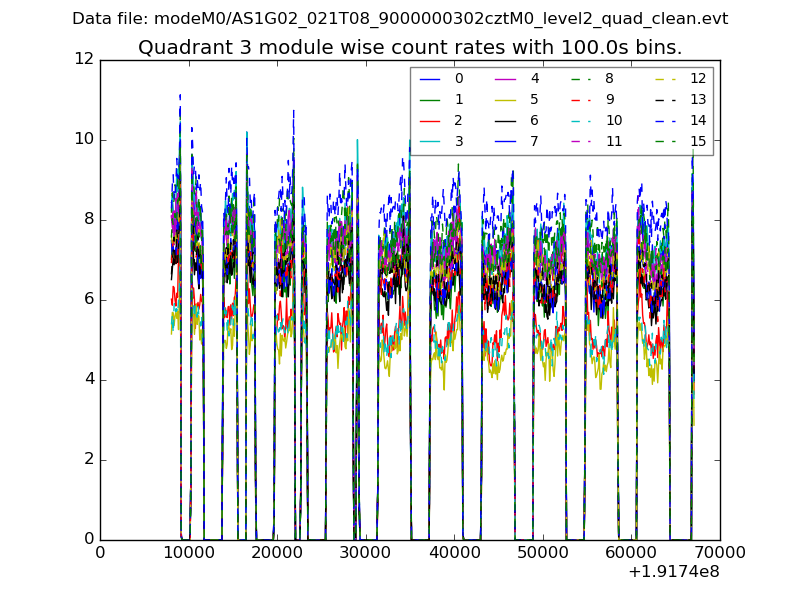
| Module-wise count rates for Quadrant C Data is divided into 100 sec bins |
 |
 |
| Module-wise count rates for Quadrant D Data is divided into 100 sec bins |
 |
 |
| Parameter | Plot |
|---|---|
| CZT HV Monitor | 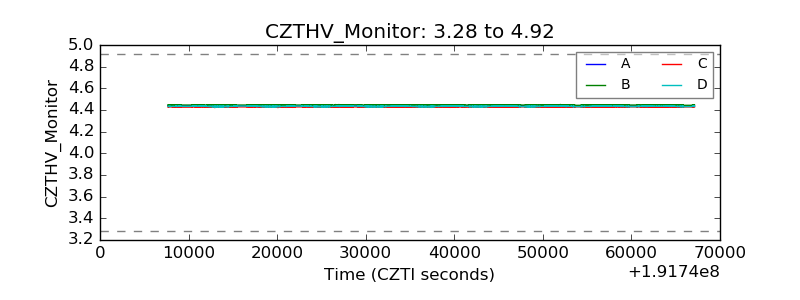 |
| D_VDD | 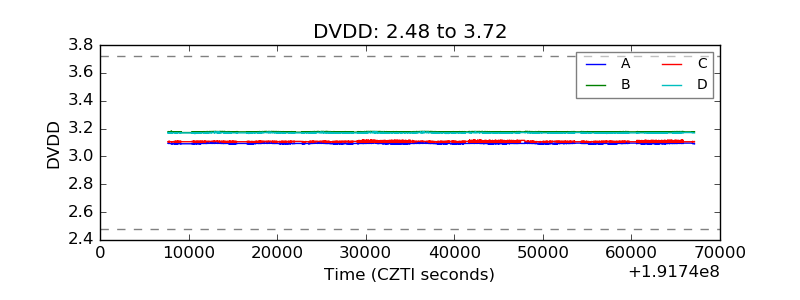 |
| Temperature 1 | 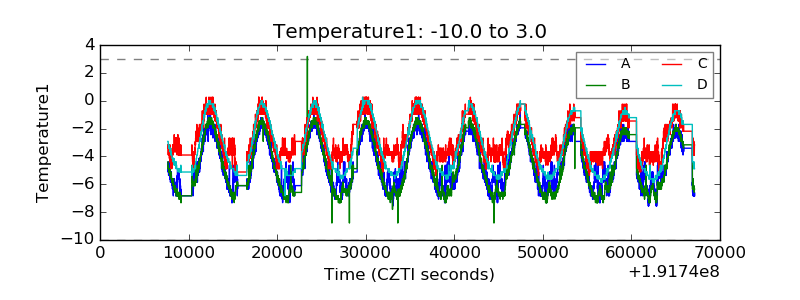 |
| Veto HV Monitor | 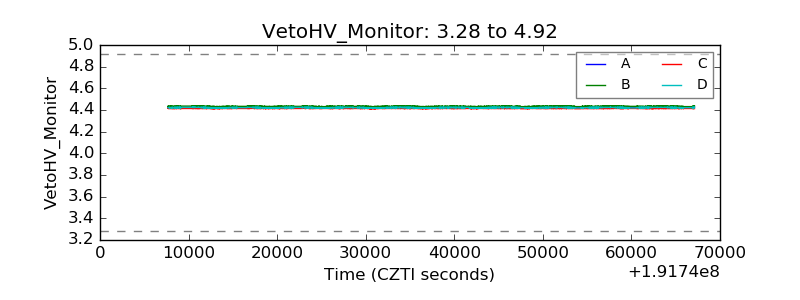 |
| Veto LLD | 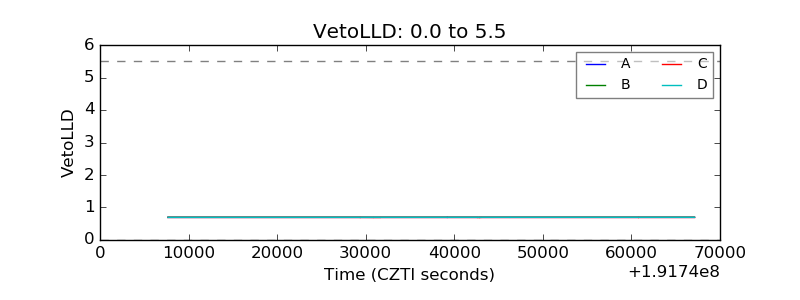 |
| Alpha Counter | 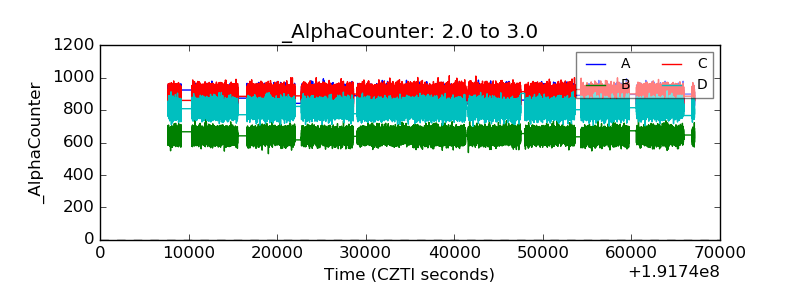 |
| _CPM_Rate | 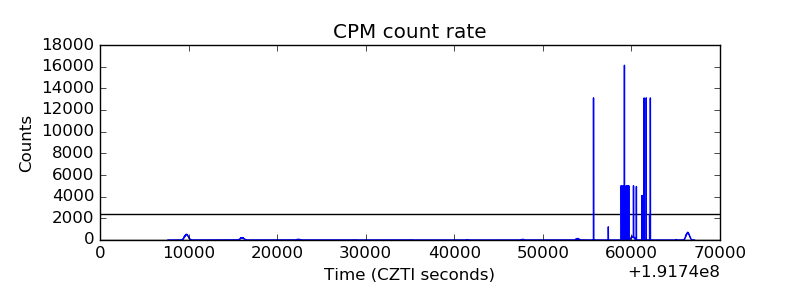 |
| CZT Counter | 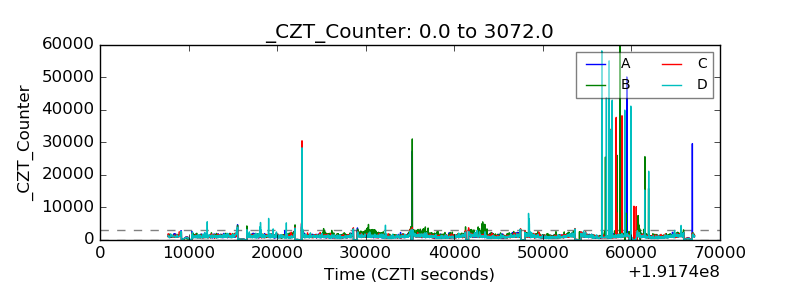 |
| +2.5 Volts monitor | 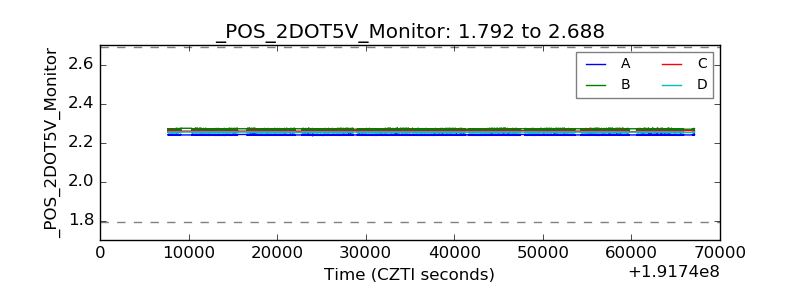 |
| +5 Volts monitor | 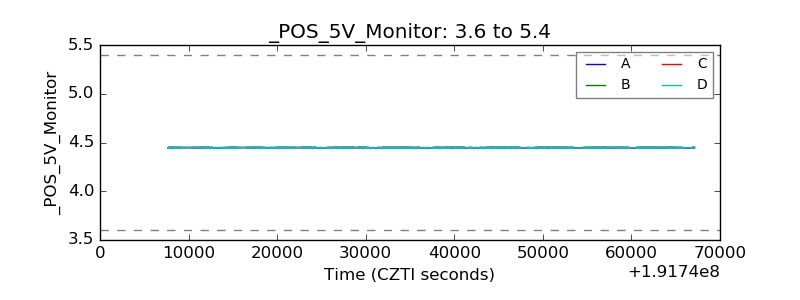 |
| _ROLL_ROT | 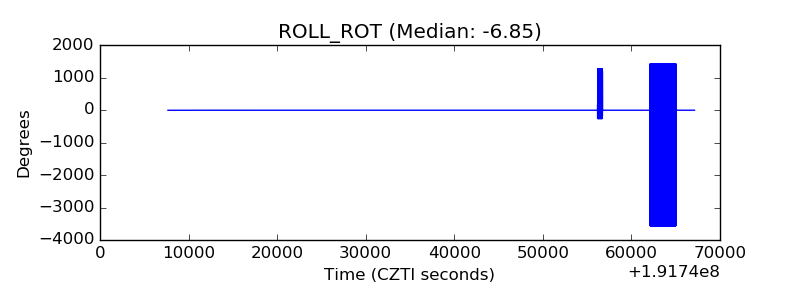 |
| _Roll_DEC | 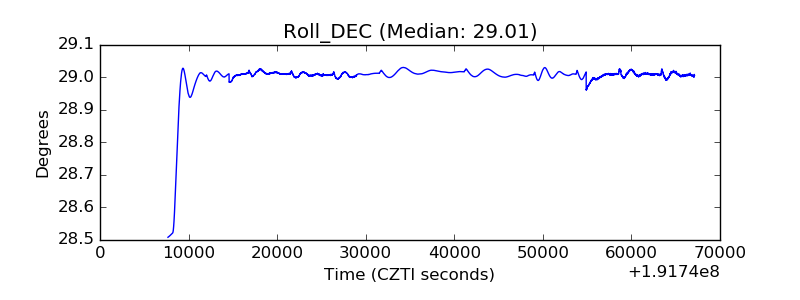 |
| _Roll_RA | 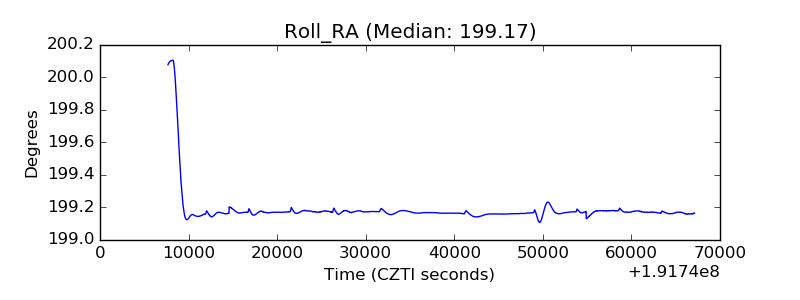 |
| Veto Counter | 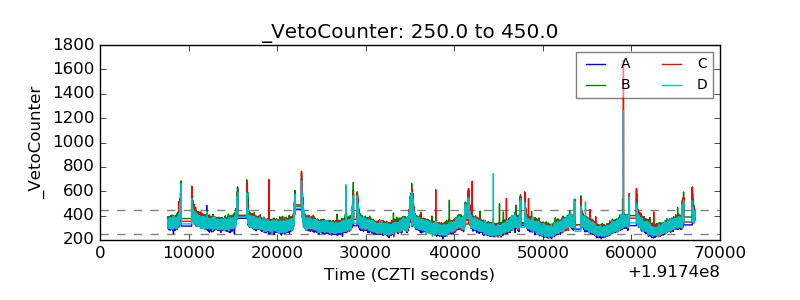 |