| Param | Original file | Final file |
|---|---|---|
| Filename | modeM0/AS1G02_021T08_9000000302_01824cztM0_level2.evt | modeM0/AS1G02_021T08_9000000302_01824cztM0_level2_quad_clean.evt |
| Size (bytes) | 468,616,320 | 46,696,320 |
| Size | 446.9 MB | 44.5 MB |
| Events in quadrant A | 3,600,839 | 303,436 |
| Events in quadrant B | 3,710,044 | 310,263 |
| Events in quadrant C | 3,456,962 | 302,702 |
| Events in quadrant D | 3,234,882 | 295,419 |
| Mode M9 | |||
|---|---|---|---|
| Quadrant | BADHDUFLAG | Total packets | Discarded packets |
| A | 0 | 1 | 0 |
| B | 1 | 1 | 0 |
| C | 1 | -1 | -1 |
| D | 1 | -1 | -1 |
| Mode M0 | |||
|---|---|---|---|
| Quadrant | BADHDUFLAG | Total packets | Discarded packets |
| A | 0 | 12708 | 1 |
| B | 0 | 12997 | 1 |
| C | 0 | 12263 | 1 |
| D | 0 | 11618 | 1 |
| Mode SS | |||
|---|---|---|---|
| Quadrant | BADHDUFLAG | Total packets | Discarded packets |
| A | 0 | 58 | 0 |
| B | 0 | 58 | 0 |
| C | 0 | 58 | 0 |
| D | 0 | 58 | 0 |
| Quadrant | Total seconds | Saturated seconds | Saturation percentage |
|---|---|---|---|
| A | 2821 | 40 | 1.417937% |
| B | 2821 | 29 | 1.028004% |
| C | 2821 | 17 | 0.602623% |
| D | 2821 | 21 | 0.744417% |
Noise dominated data is calculated using 1-second bins in cleaned event files. If a bin has >2000 counts, and if more than 50% of those come from <1% of pixels, then it is considered to be noise-dominated and hence unusable.
| Quadrant | # 1 sec bins | Bins with >0 counts | Bins with >2000 counts | High rate bins dominated by noise | Noise dominated (total time) | Noise dominated (detector-on time) | Marked lightcurve |
|---|---|---|---|---|---|---|---|
| A | 4001 | 2822 | 182 | 182 | 4.55% | 6.45% | 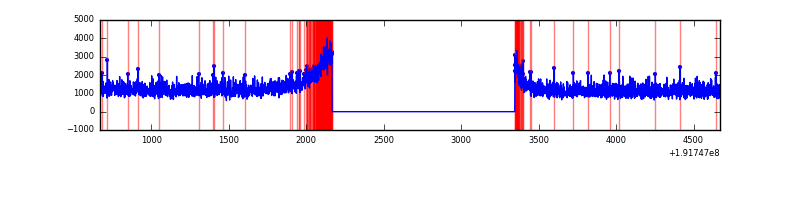 |
| B | 4001 | 2822 | 172 | 172 | 4.30% | 6.09% | 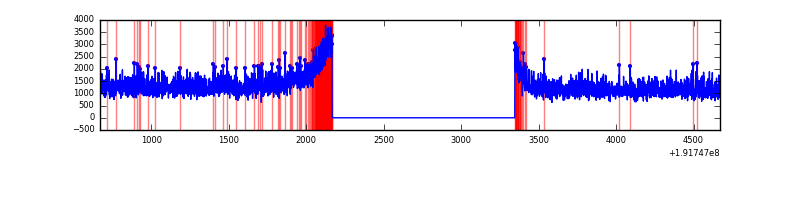 |
| C | 4001 | 2822 | 138 | 138 | 3.45% | 4.89% | 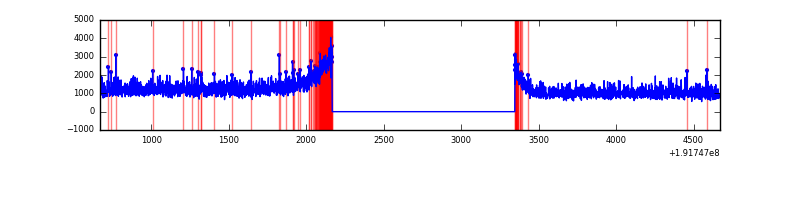 |
| D | 4001 | 2822 | 107 | 107 | 2.67% | 3.79% | 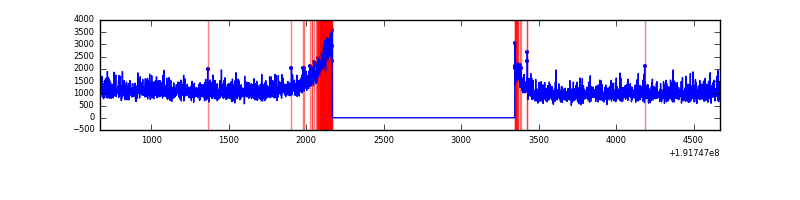 |
Top three noisy pixels from each quadrant. If the there are fewer than three noisy pixels in the level2.evt file, extra rows are filled as -1
| Pixel properties | Quadrant properties | ||||||
|---|---|---|---|---|---|---|---|
| Quadrant | DetID | PixID | Counts | Sigma | Mean | Median | Sigma |
| B | 0 | 220 | 4763 | 16.31 | 977 | 981 | 231.8 |
| B | 15 | 85 | 3739 | 11.9 | 977 | 981 | 231.8 |
| B | 11 | 111 | 2228 | 5.38 | 977 | 981 | 231.8 |
| C | 7 | 159 | 4542 | 14.64 | 884 | 917 | 247.5 |
| C | 10 | 34 | 3224 | 9.32 | 884 | 917 | 247.5 |
| C | -1 | -1 | -1 | -1.0 | 884 | 917 | 247.5 |
| D | 5 | 233 | 23874 | 85.57 | 859 | 889 | 268.6 |
| D | 10 | 172 | 6169 | 19.66 | 859 | 889 | 268.6 |
| D | 2 | 54 | 3323 | 9.06 | 859 | 889 | 268.6 |
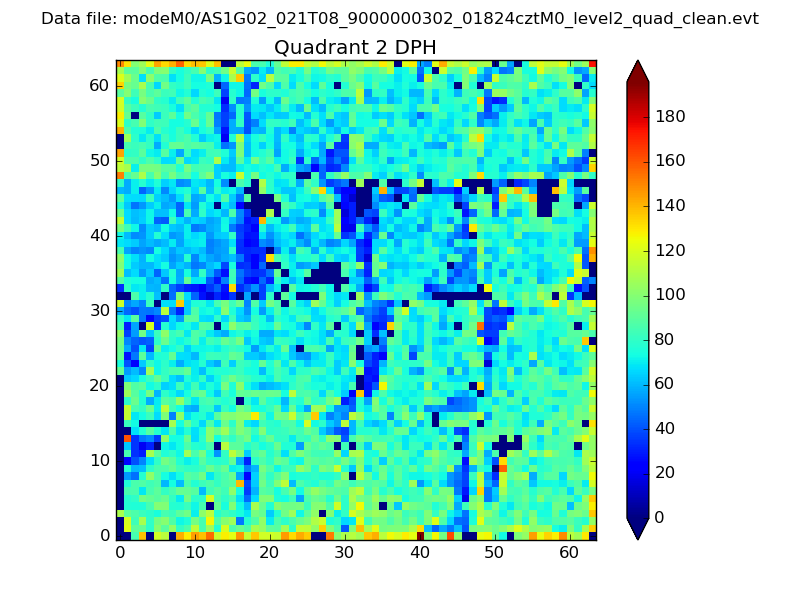
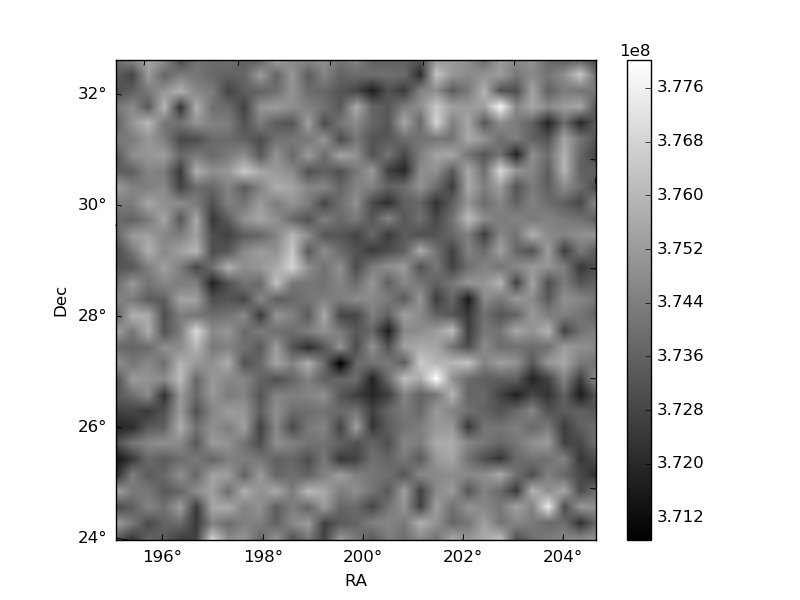
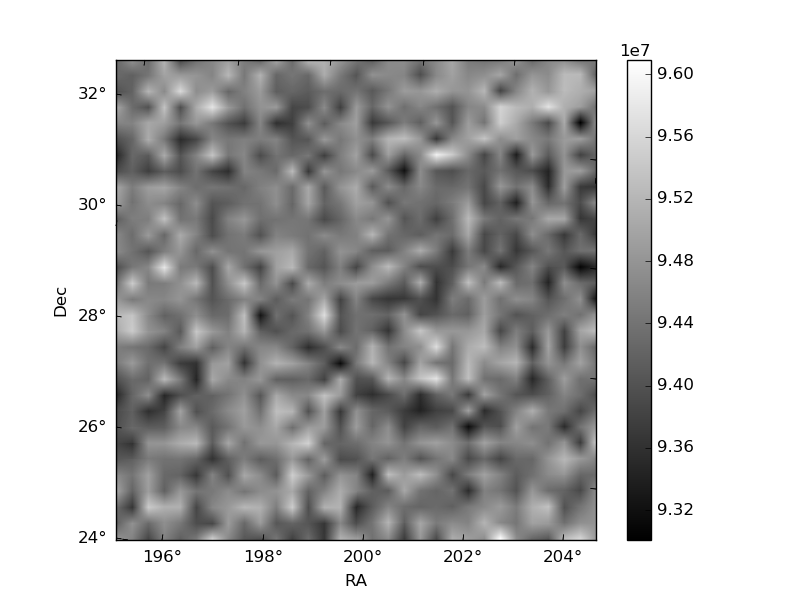
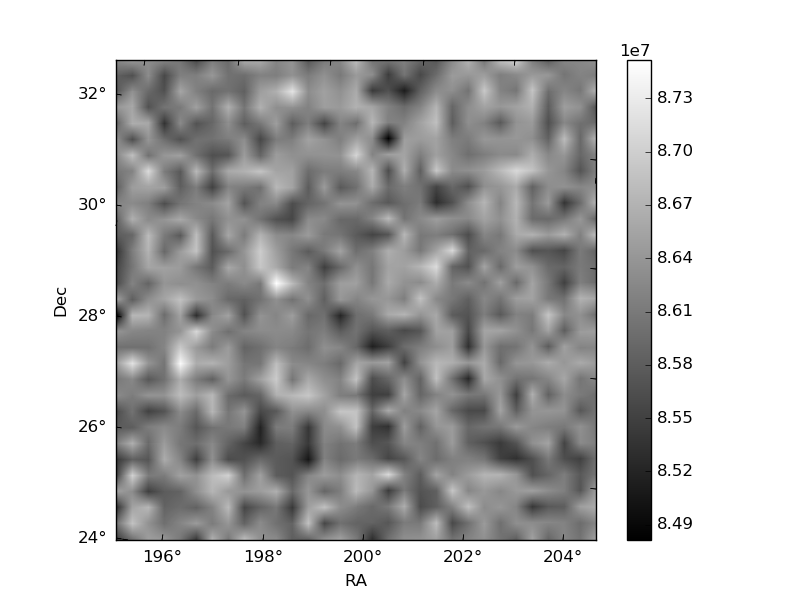
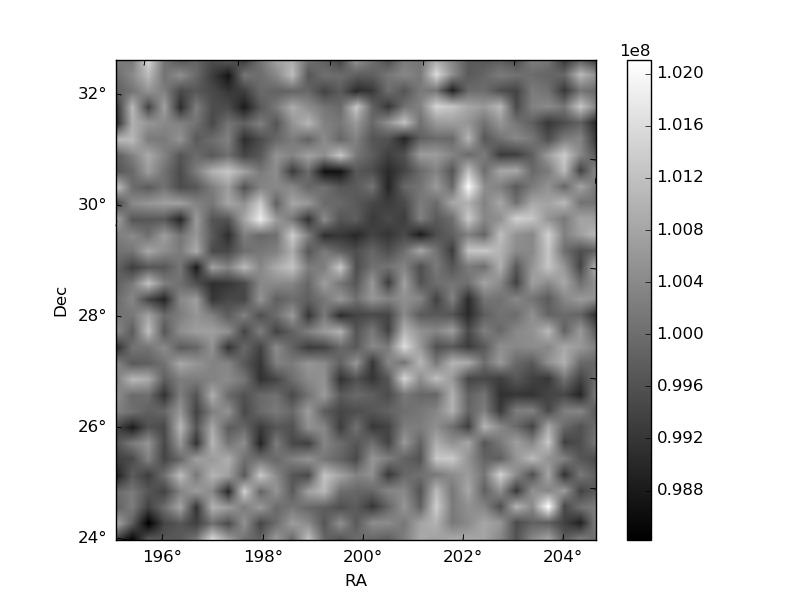
Histogram calculated using DETX and DETY for each event in the final _common_clean file
| Quadrant A | 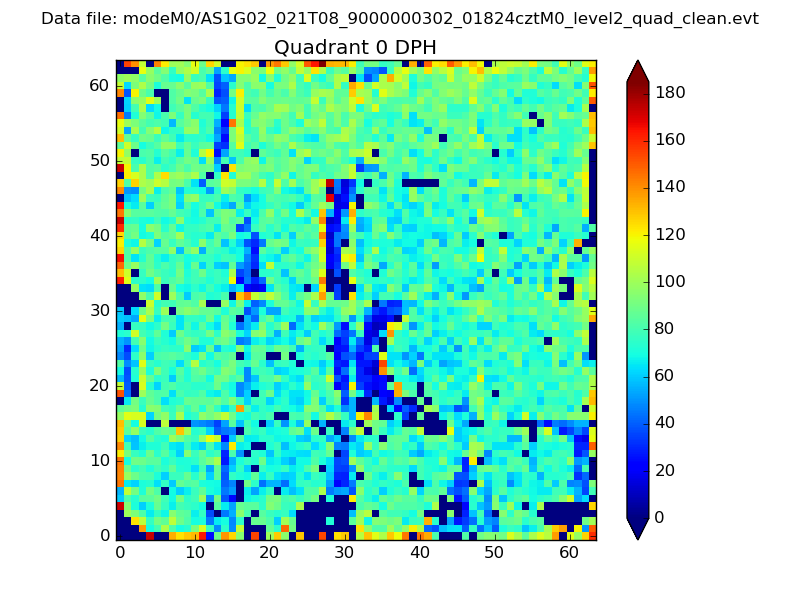 |
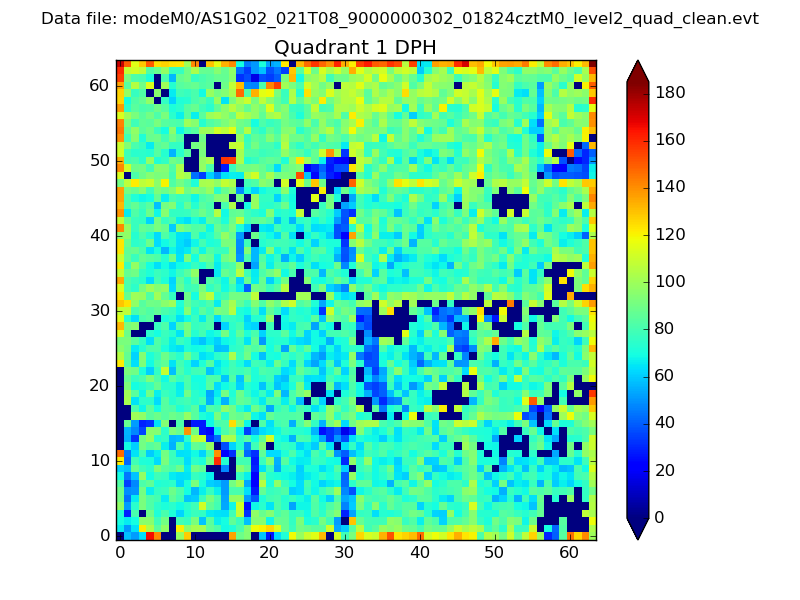 |
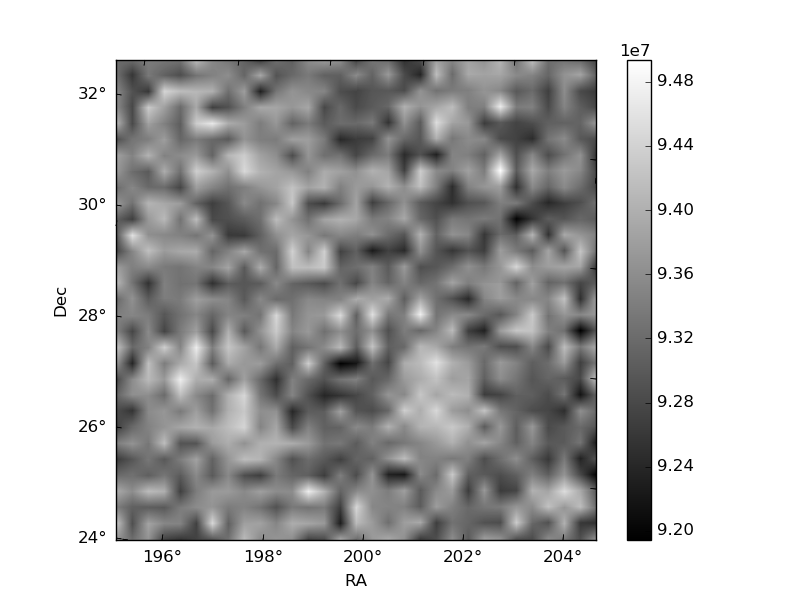
Quadrant B |
|---|---|---|---|
| Quadrant D | 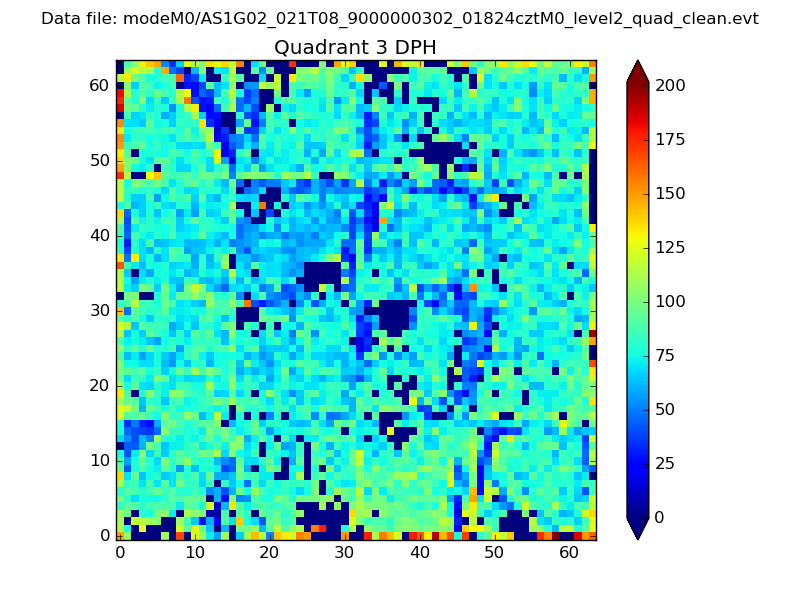 |
 |
Quadrant C |
| Plot type | Count rate plots | Images |
|---|---|---|
| Comparison with Poisson distribution Blue bars denote a histogram of data divided into 1 sec bins. Red curve is a Poisson curve with rate = median count rate of data. |
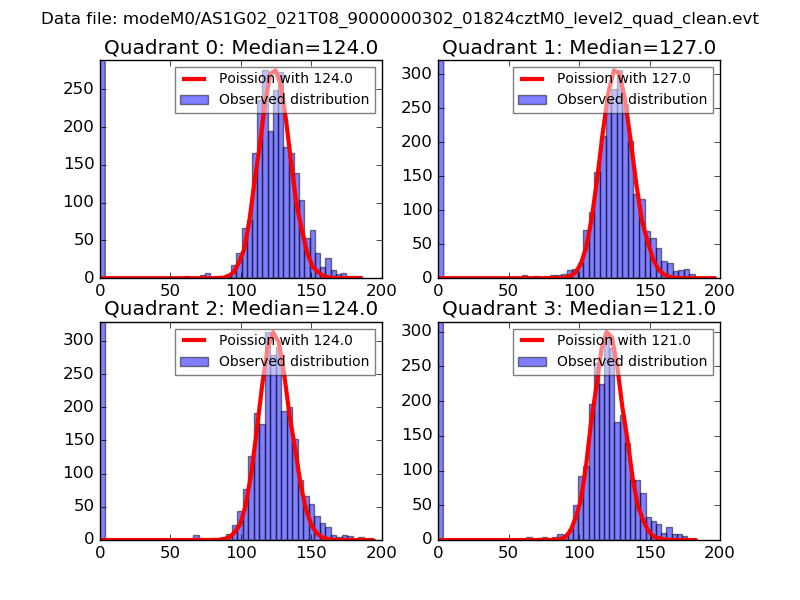 |
 |
| Quadrant-wise count rates Data is divided into 100 sec bins |
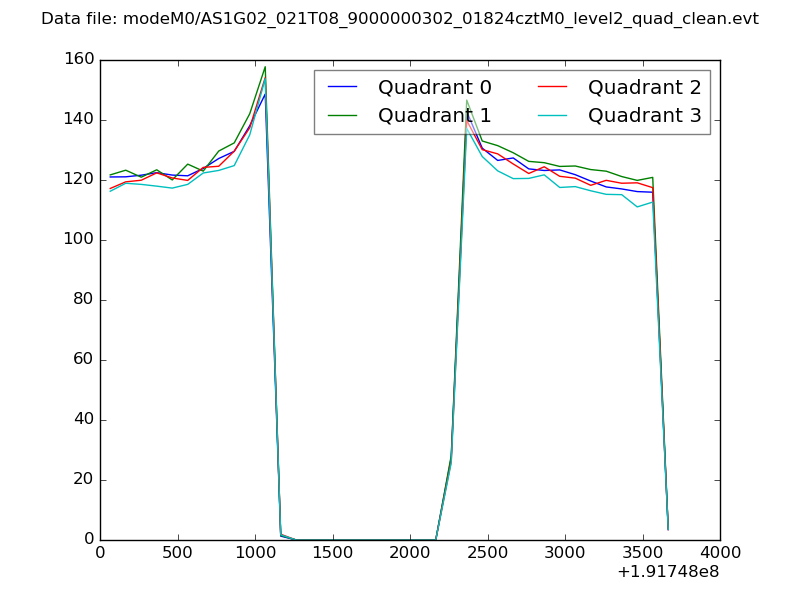 |
|
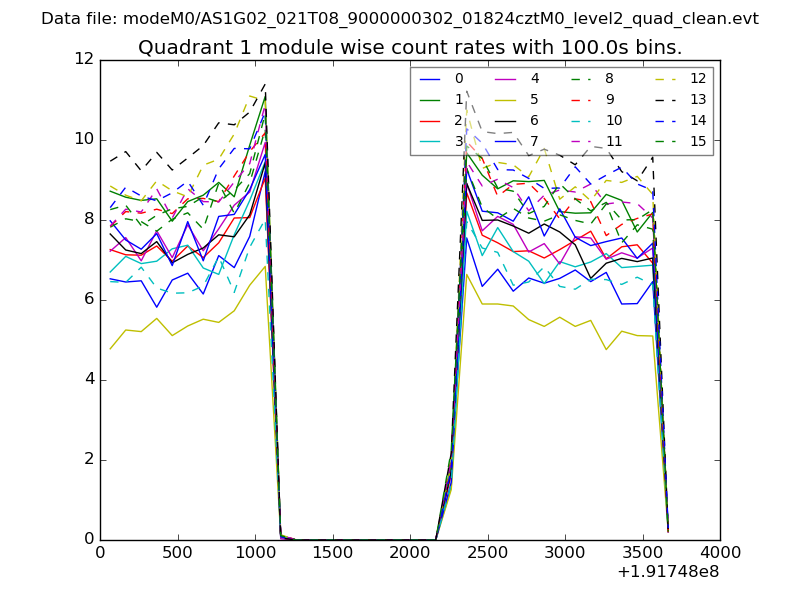
| Module-wise count rates for Quadrant A Data is divided into 100 sec bins |
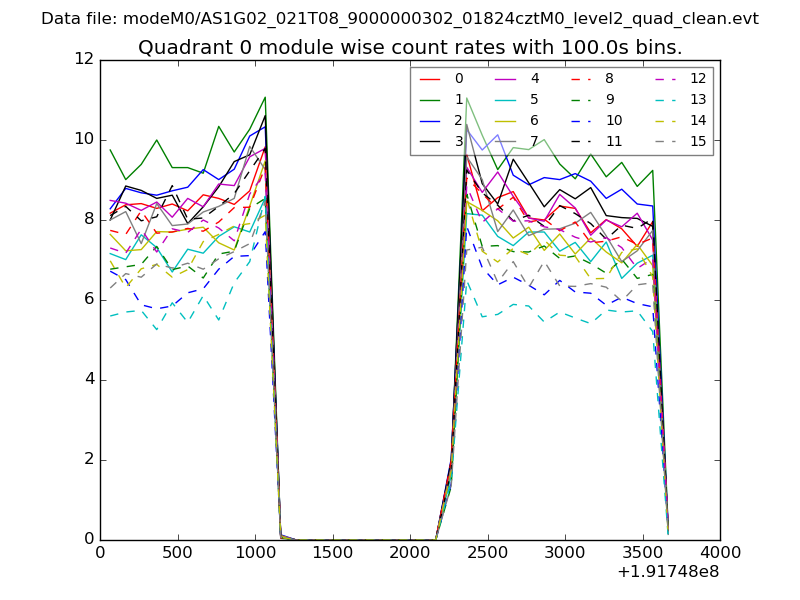 |
 |
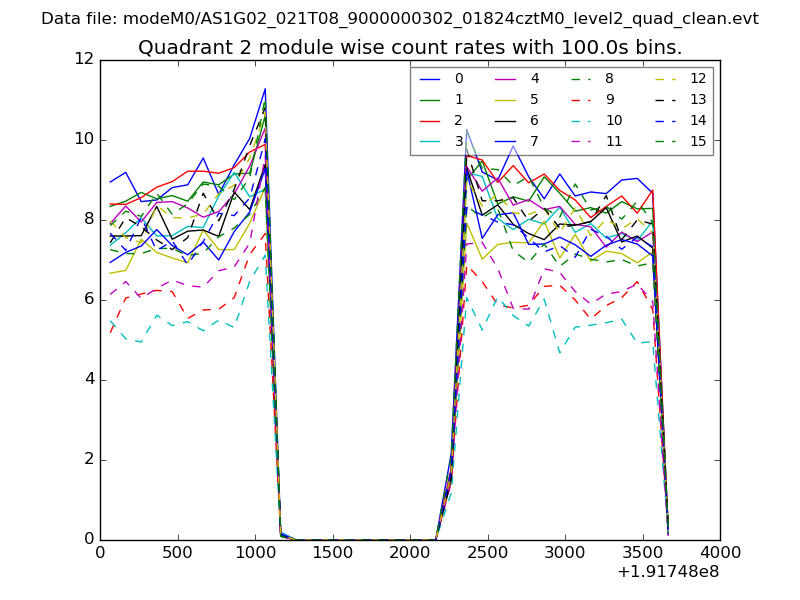
| Module-wise count rates for Quadrant B Data is divided into 100 sec bins |
 |
 |
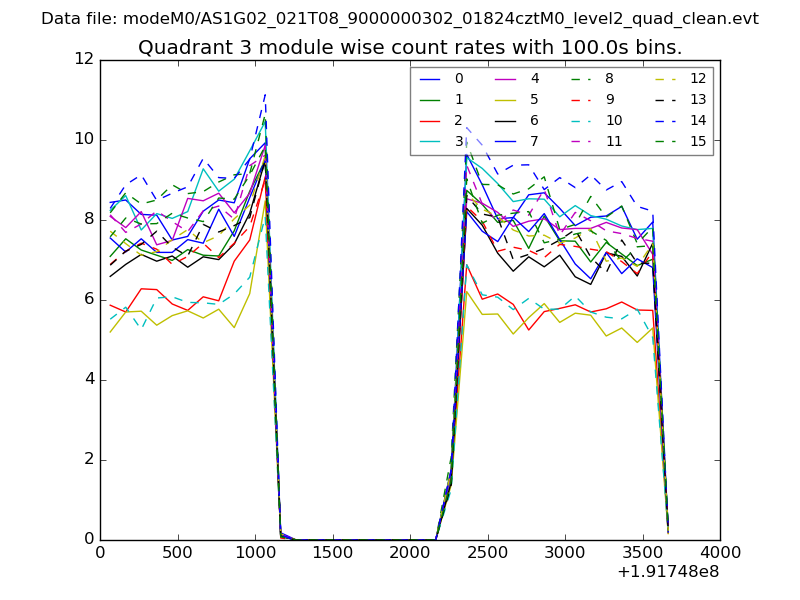
| Module-wise count rates for Quadrant C Data is divided into 100 sec bins |
 |
 |
| Module-wise count rates for Quadrant D Data is divided into 100 sec bins |
 |
 |
| Parameter | Plot |
|---|---|
| CZT HV Monitor | 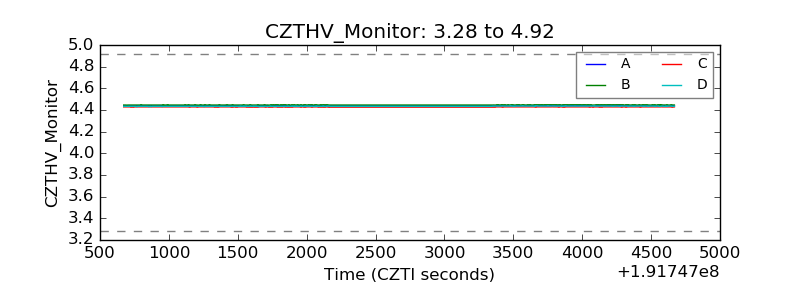 |
| D_VDD | 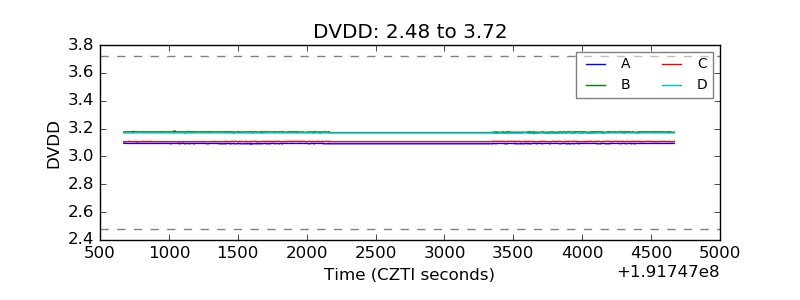 |
| Temperature 1 | 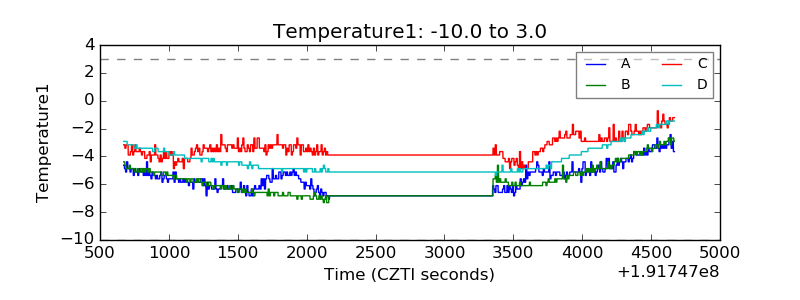 |
| Veto HV Monitor | 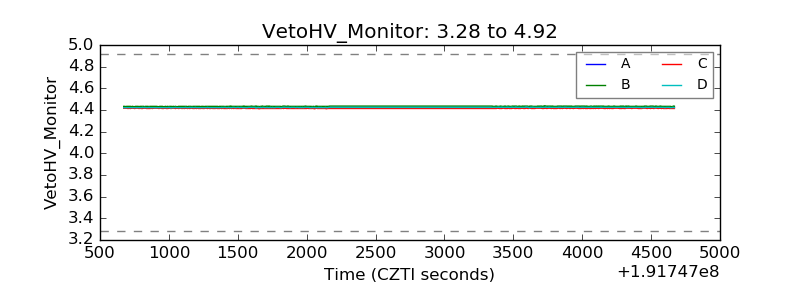 |
| Veto LLD | 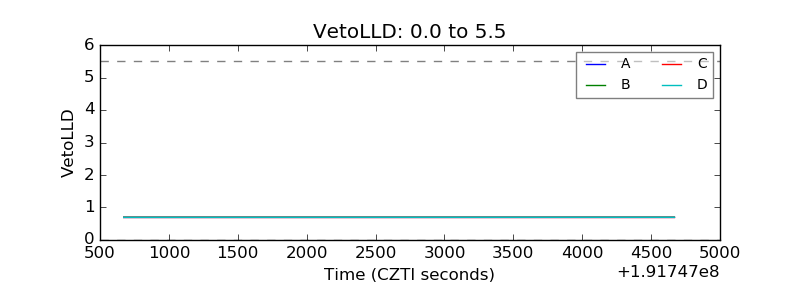 |
| Alpha Counter | 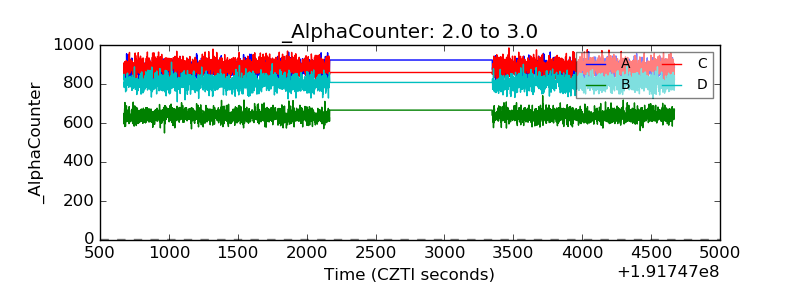 |
| _CPM_Rate | 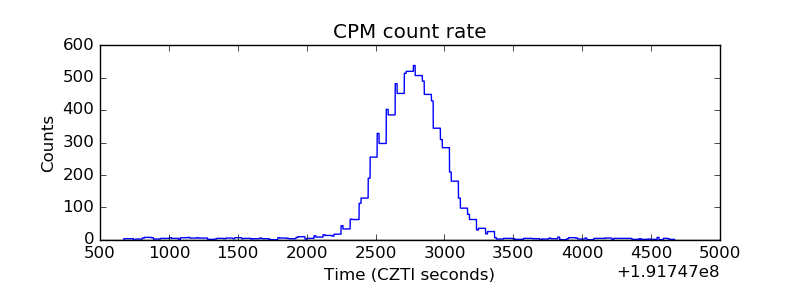 |
| CZT Counter | 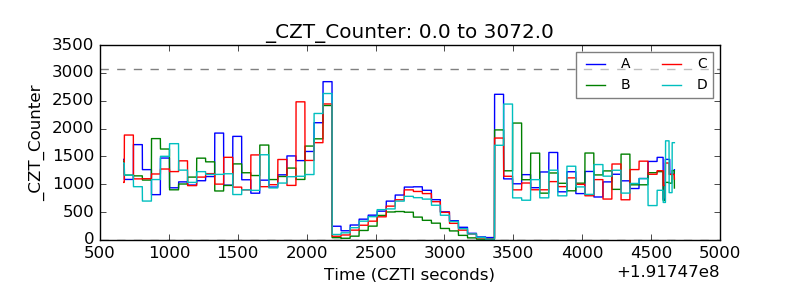 |
| +2.5 Volts monitor | 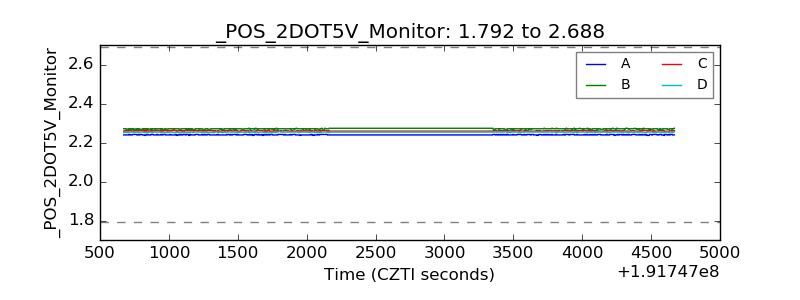 |
| +5 Volts monitor | 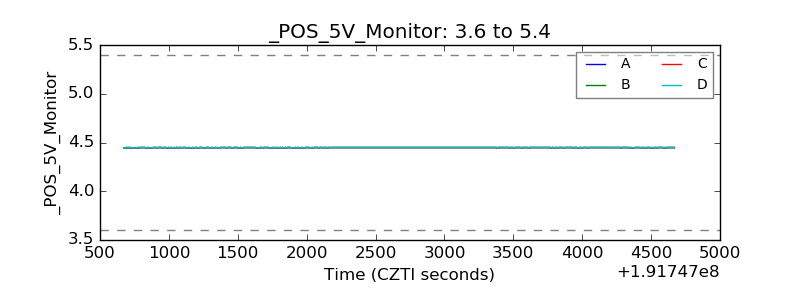 |
| _ROLL_ROT | 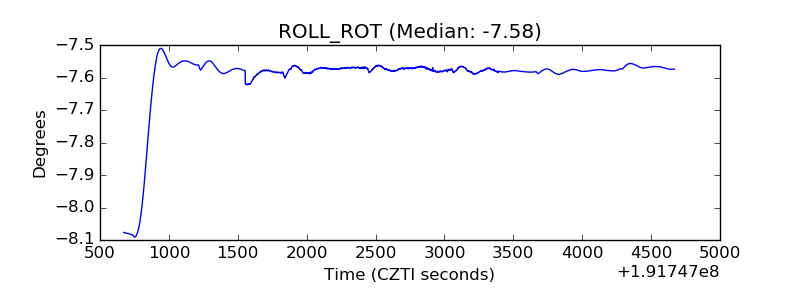 |
| _Roll_DEC | 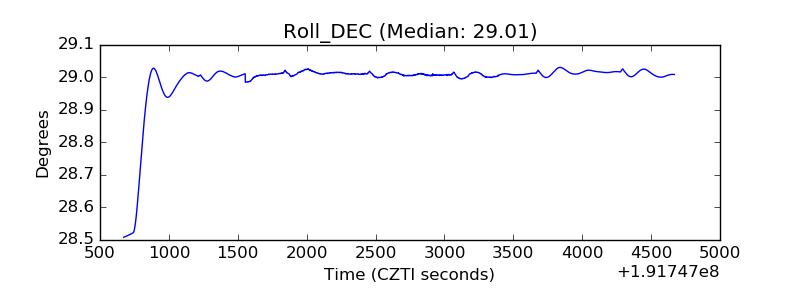 |
| _Roll_RA | 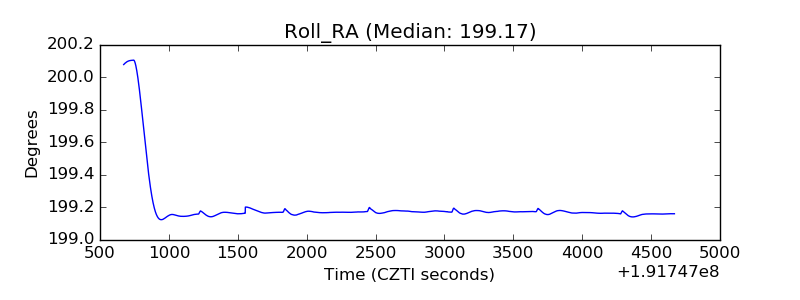 |
| Veto Counter | 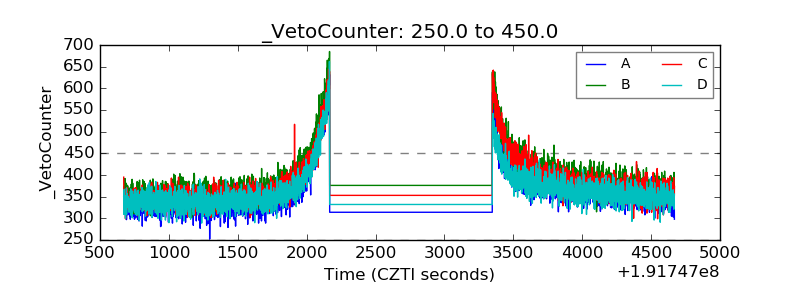 |