| Param | Original file | Final file |
|---|---|---|
| Filename | modeM0/AS1G02_021T08_9000000302_01825cztM0_level2.evt | modeM0/AS1G02_021T08_9000000302_01825cztM0_level2_quad_clean.evt |
| Size (bytes) | 994,564,800 | 74,658,240 |
| Size | 948.5 MB | 71.2 MB |
| Events in quadrant A | 7,568,597 | 457,608 |
| Events in quadrant B | 7,757,648 | 468,034 |
| Events in quadrant C | 7,188,015 | 458,563 |
| Events in quadrant D | 7,193,220 | 441,946 |
| Mode M9 | |||
|---|---|---|---|
| Quadrant | BADHDUFLAG | Total packets | Discarded packets |
| A | 0 | 1 | 0 |
| B | 1 | 1 | 0 |
| C | 1 | -1 | -1 |
| D | 1 | -1 | -1 |
| Mode M0 | |||
|---|---|---|---|
| Quadrant | BADHDUFLAG | Total packets | Discarded packets |
| A | 0 | 26883 | 9 |
| B | 0 | 27502 | 1 |
| C | 0 | 25755 | 1 |
| D | 0 | 25837 | 14 |
| Mode SS | |||
|---|---|---|---|
| Quadrant | BADHDUFLAG | Total packets | Discarded packets |
| A | 0 | 124 | 0 |
| B | 0 | 124 | 0 |
| C | 0 | 124 | 0 |
| D | 0 | 124 | 0 |
| Quadrant | Total seconds | Saturated seconds | Saturation percentage |
|---|---|---|---|
| A | 6227 | 71 | 1.140196% |
| B | 6229 | 53 | 0.850859% |
| C | 6229 | 34 | 0.545834% |
| D | 6227 | 62 | 0.995664% |
Noise dominated data is calculated using 1-second bins in cleaned event files. If a bin has >2000 counts, and if more than 50% of those come from <1% of pixels, then it is considered to be noise-dominated and hence unusable.
| Quadrant | # 1 sec bins | Bins with >0 counts | Bins with >2000 counts | High rate bins dominated by noise | Noise dominated (total time) | Noise dominated (detector-on time) | Marked lightcurve |
|---|---|---|---|---|---|---|---|
| A | 7259 | 6229 | 247 | 247 | 3.40% | 3.97% | 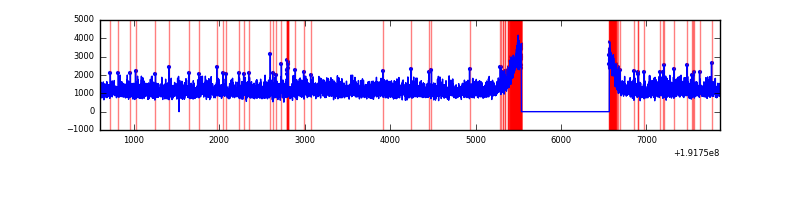 |
| B | 7259 | 6230 | 262 | 262 | 3.61% | 4.21% | 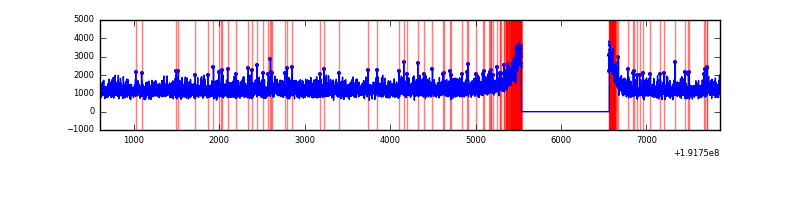 |
| C | 7259 | 6230 | 191 | 191 | 2.63% | 3.07% | 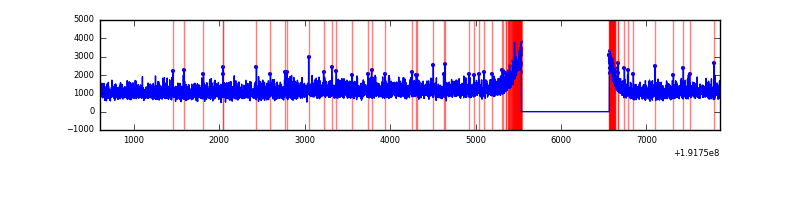 |
| D | 7259 | 6228 | 237 | 237 | 3.26% | 3.81% | 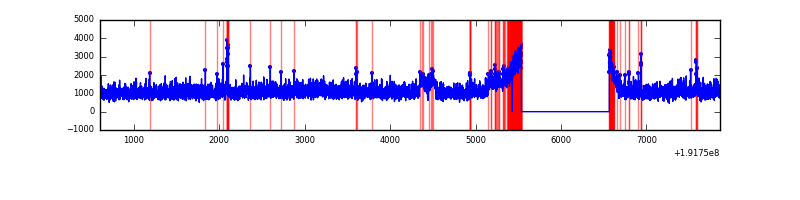 |
Top three noisy pixels from each quadrant. If the there are fewer than three noisy pixels in the level2.evt file, extra rows are filled as -1
| Pixel properties | Quadrant properties | ||||||
|---|---|---|---|---|---|---|---|
| Quadrant | DetID | PixID | Counts | Sigma | Mean | Median | Sigma |
| A | 6 | 10 | 15024 | 27.18 | 1974 | 1986 | 479.7 |
| A | 10 | 2 | 6592 | 9.6 | 1974 | 1986 | 479.7 |
| A | -1 | -1 | -1 | -1.0 | 1974 | 1986 | 479.7 |
| B | 0 | 220 | 22791 | 43.41 | 2025 | 2036 | 478.1 |
| B | 0 | 198 | 20886 | 39.43 | 2025 | 2036 | 478.1 |
| B | 15 | 85 | 17759 | 32.89 | 2025 | 2036 | 478.1 |
| C | 7 | 159 | 4595 | 5.21 | 1841 | 1904 | 516.9 |
| C | -1 | -1 | -1 | -1.0 | 1841 | 1904 | 516.9 |
| C | -1 | -1 | -1 | -1.0 | 1841 | 1904 | 516.9 |
| D | 13 | 105 | 252924 | 450.99 | 1811 | 1876 | 556.7 |
| D | 5 | 233 | 38432 | 65.67 | 1811 | 1876 | 556.7 |
| D | 13 | 88 | 34893 | 59.31 | 1811 | 1876 | 556.7 |
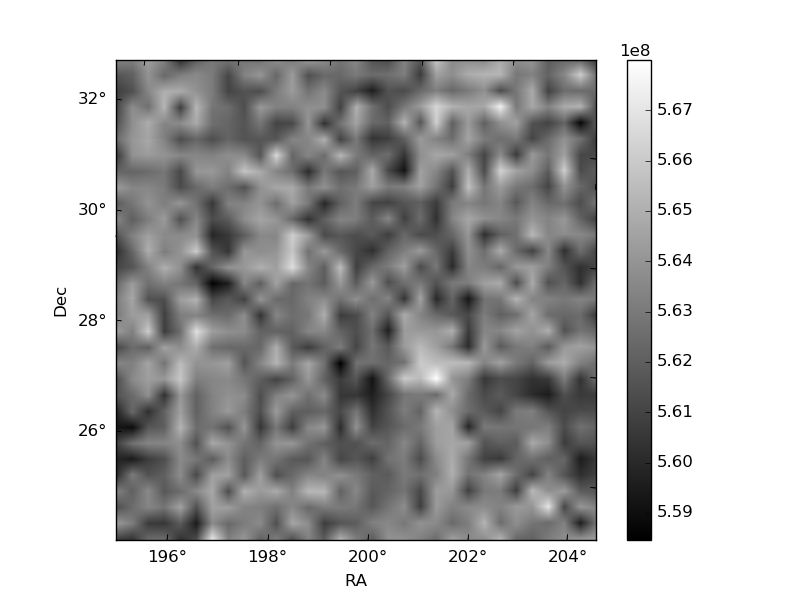
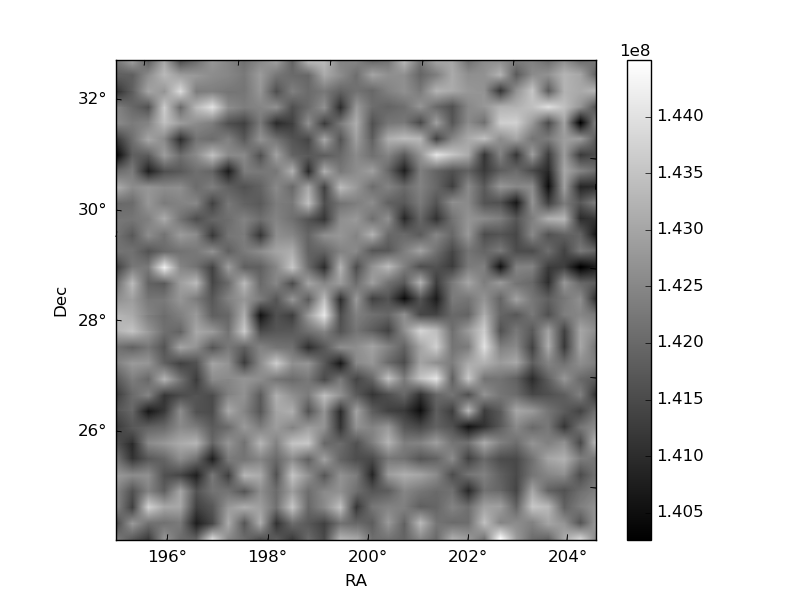
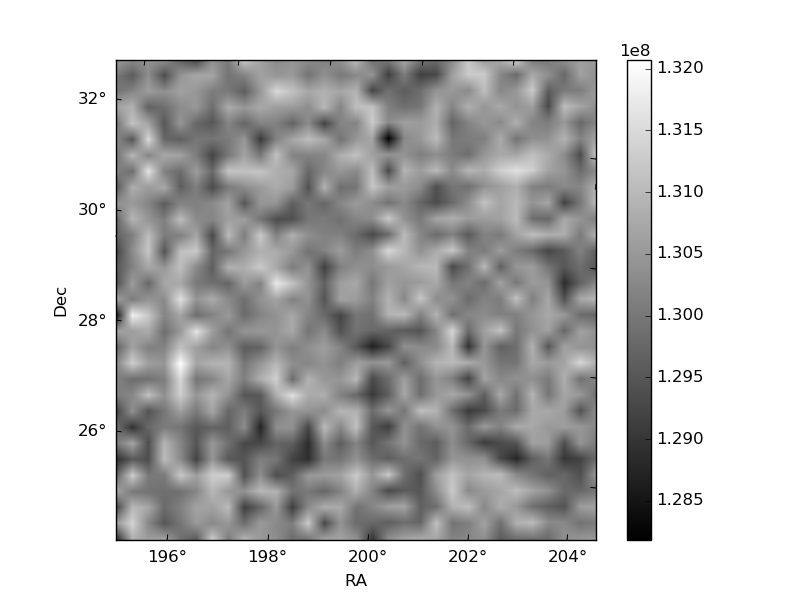
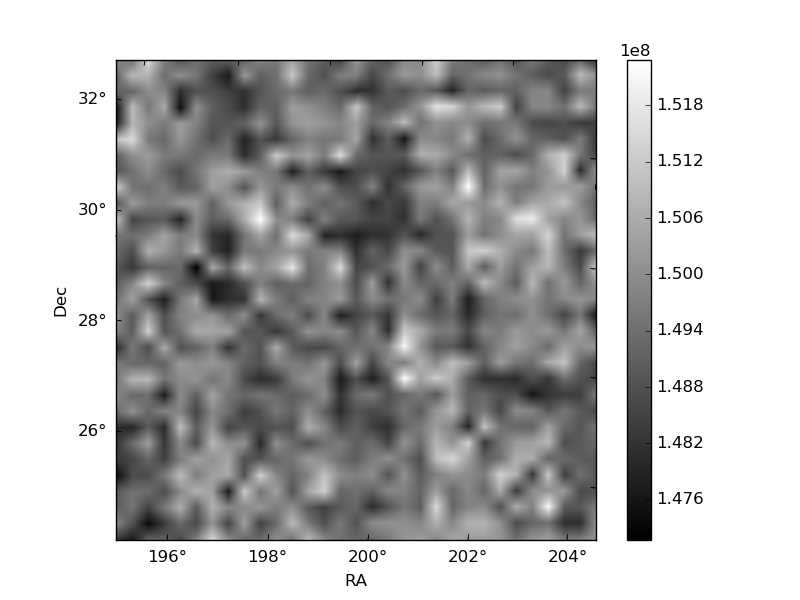
Histogram calculated using DETX and DETY for each event in the final _common_clean file
| Quadrant A | 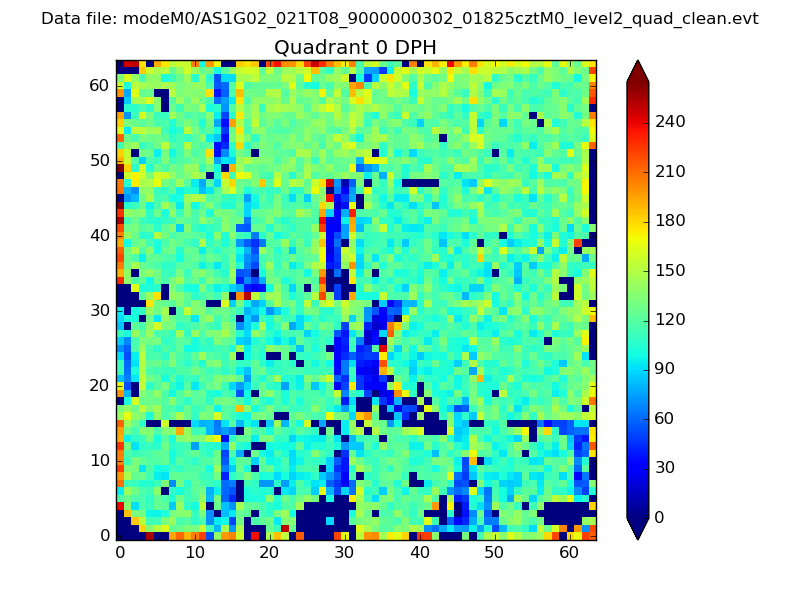 |
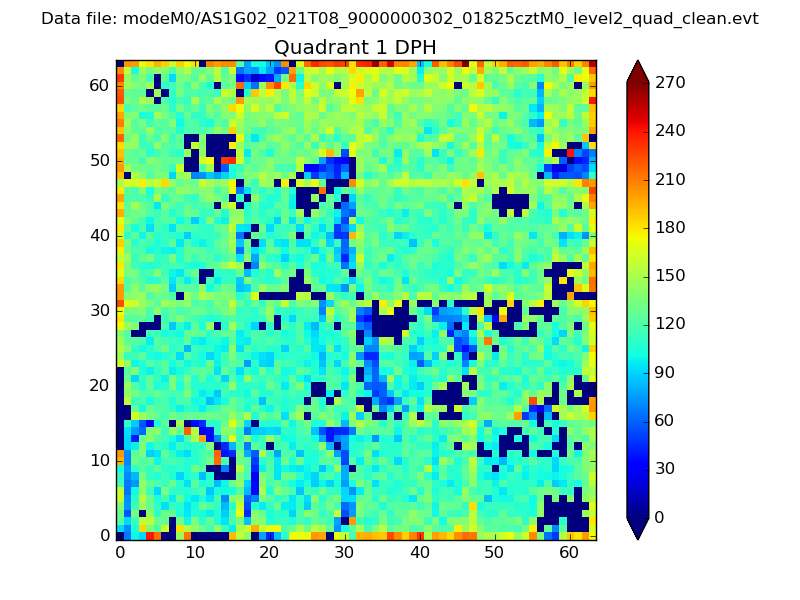 |
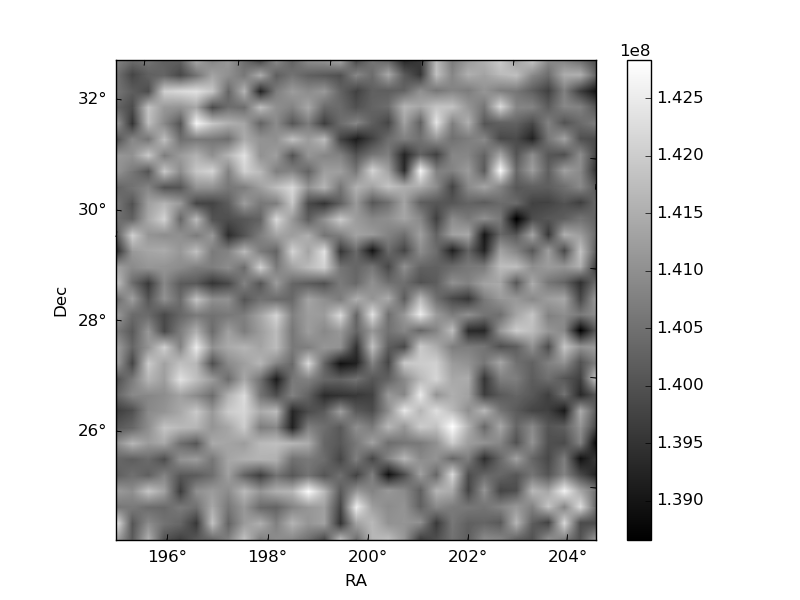
Quadrant B |
|---|---|---|---|
| Quadrant D | 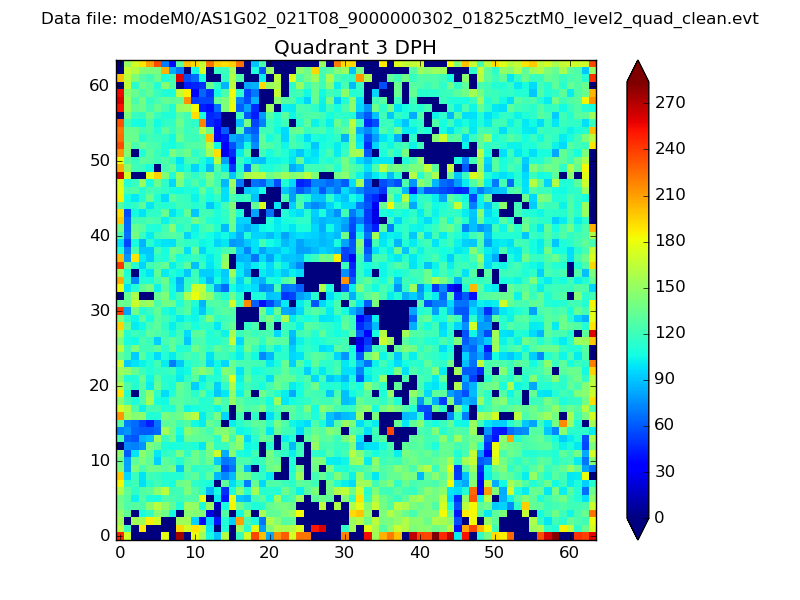 |
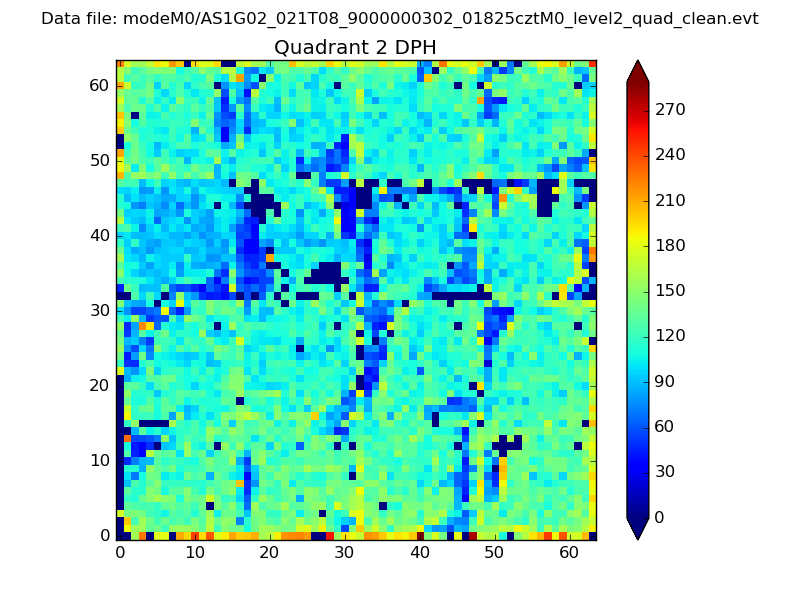 |
Quadrant C |
| Plot type | Count rate plots | Images |
|---|---|---|
| Comparison with Poisson distribution Blue bars denote a histogram of data divided into 1 sec bins. Red curve is a Poisson curve with rate = median count rate of data. |
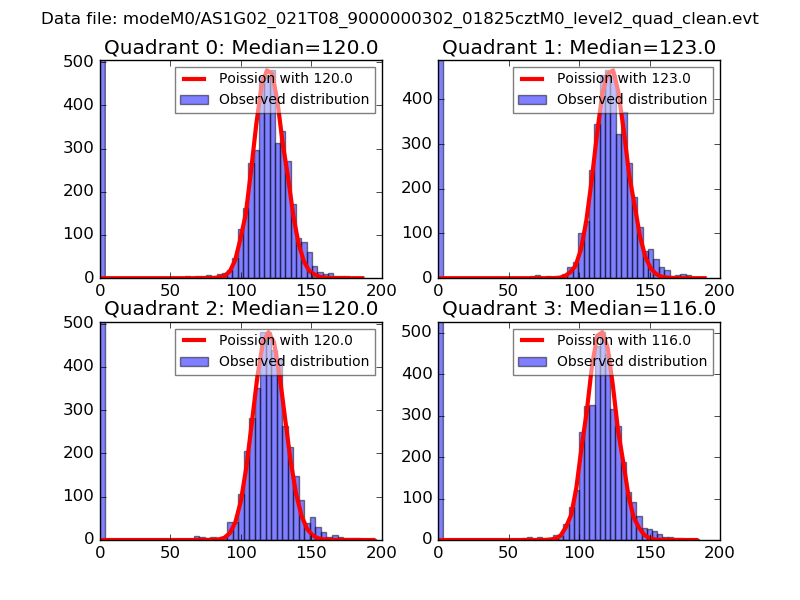 |
 |
| Quadrant-wise count rates Data is divided into 100 sec bins |
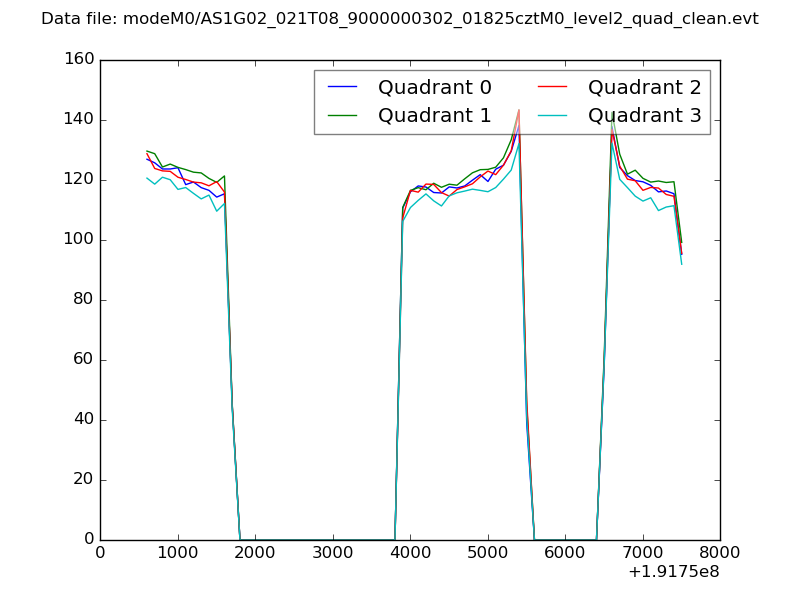 |
|
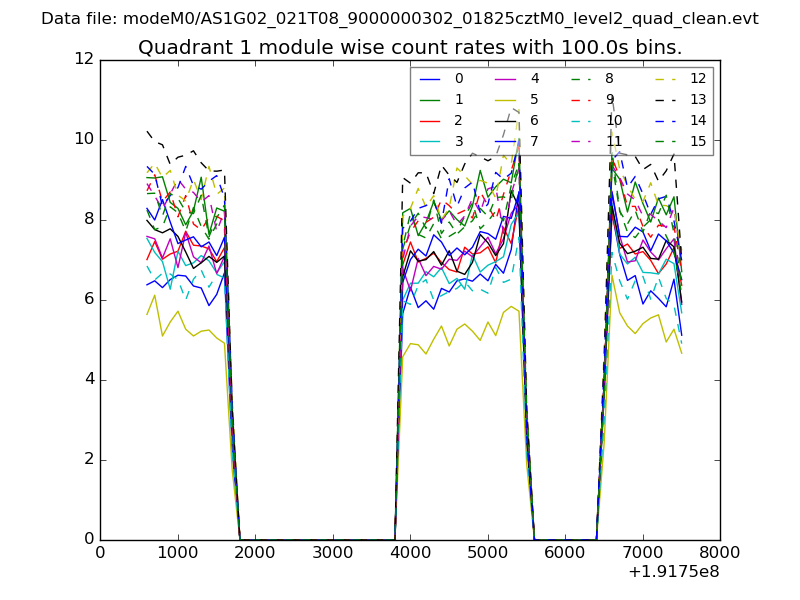
| Module-wise count rates for Quadrant A Data is divided into 100 sec bins |
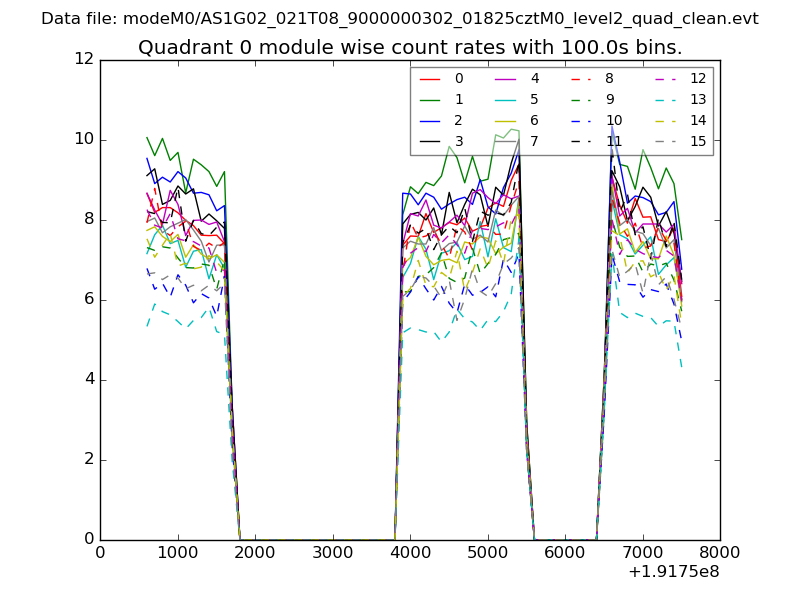 |
 |
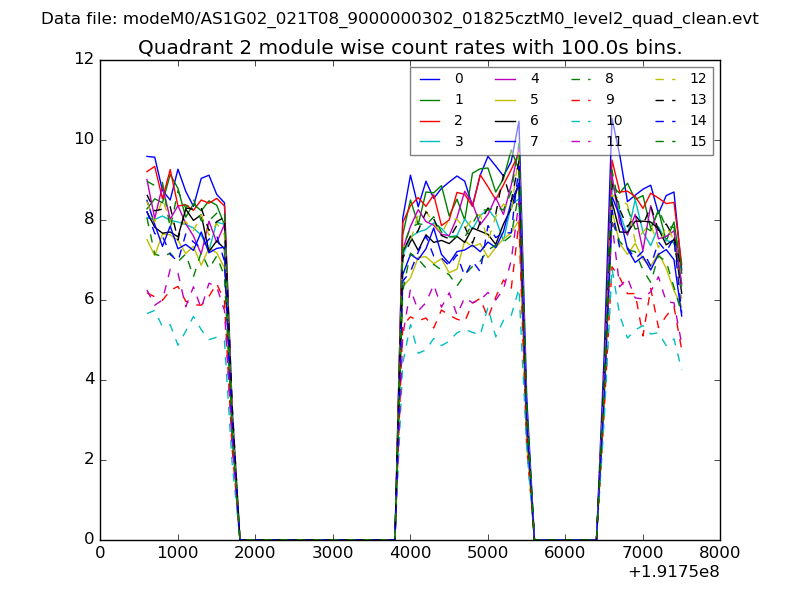
| Module-wise count rates for Quadrant B Data is divided into 100 sec bins |
 |
 |
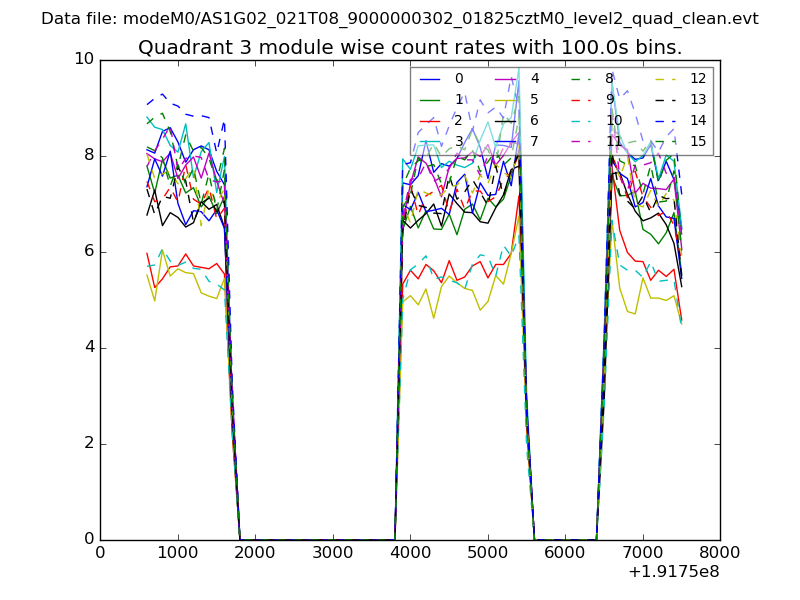
| Module-wise count rates for Quadrant C Data is divided into 100 sec bins |
 |
 |
| Module-wise count rates for Quadrant D Data is divided into 100 sec bins |
 |
 |
| Parameter | Plot |
|---|---|
| CZT HV Monitor | 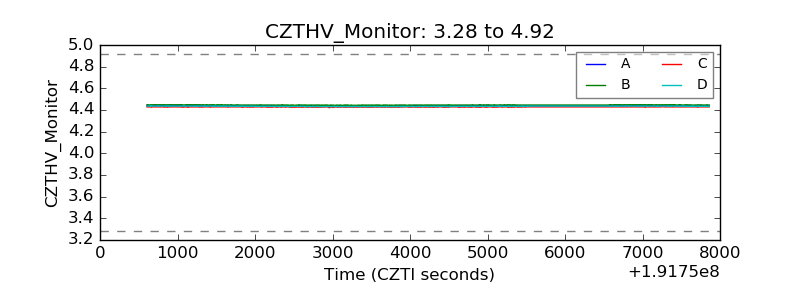 |
| D_VDD | 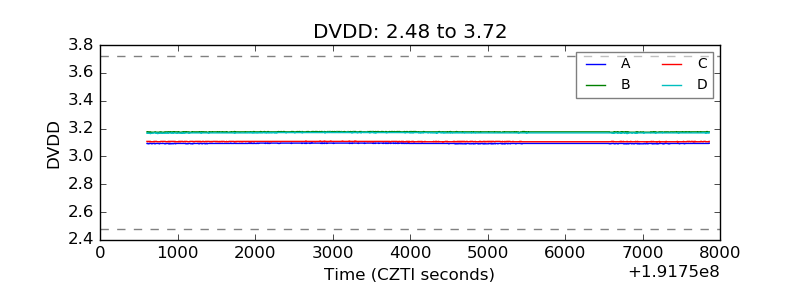 |
| Temperature 1 | 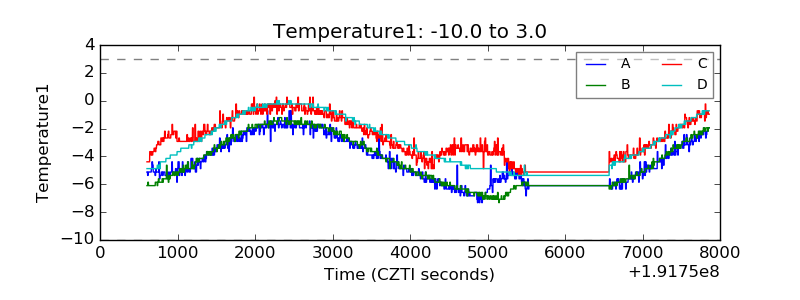 |
| Veto HV Monitor | 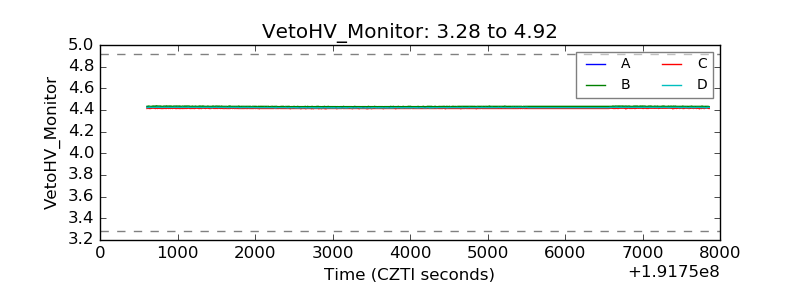 |
| Veto LLD | 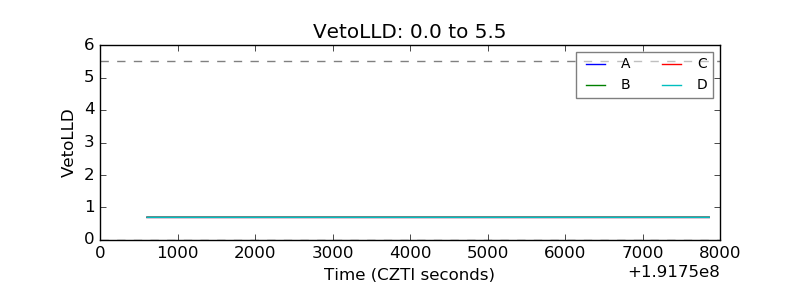 |
| Alpha Counter | 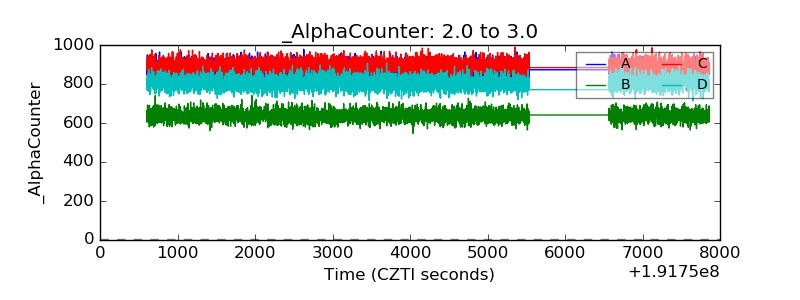 |
| _CPM_Rate | 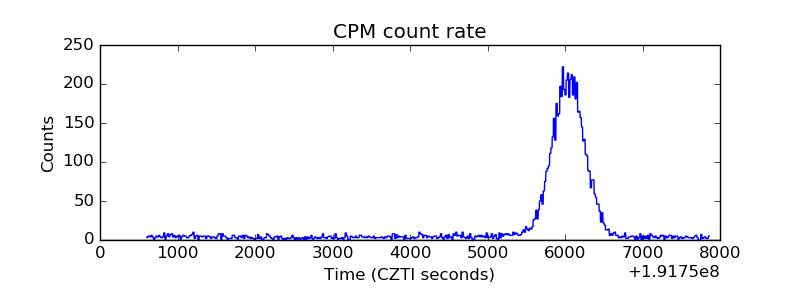 |
| CZT Counter | 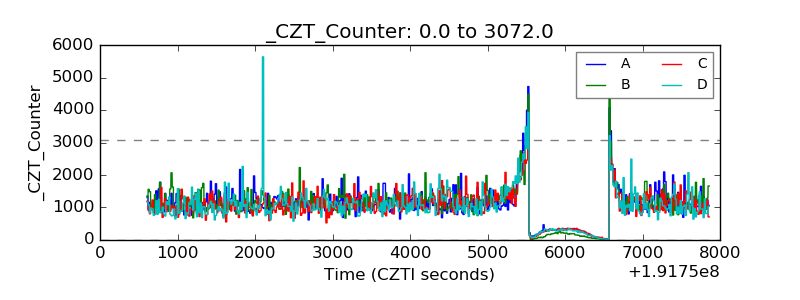 |
| +2.5 Volts monitor | 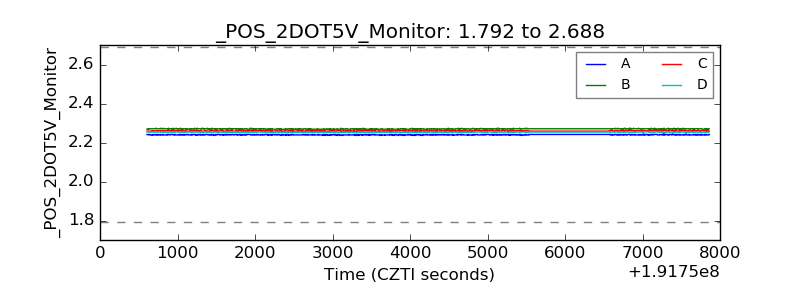 |
| +5 Volts monitor | 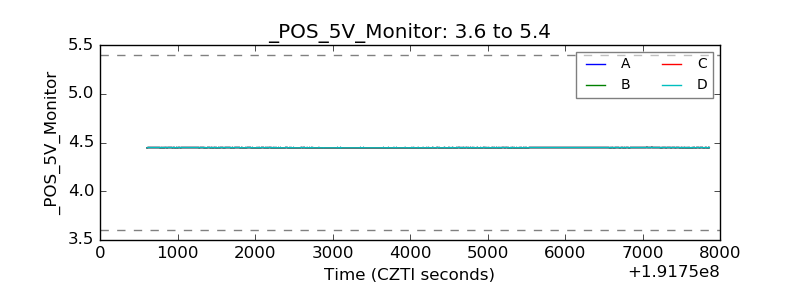 |
| _ROLL_ROT | 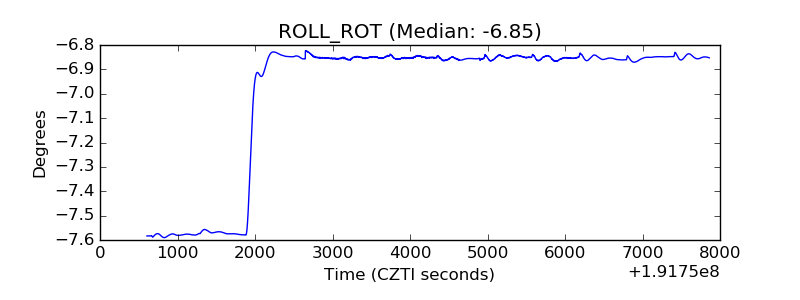 |
| _Roll_DEC | 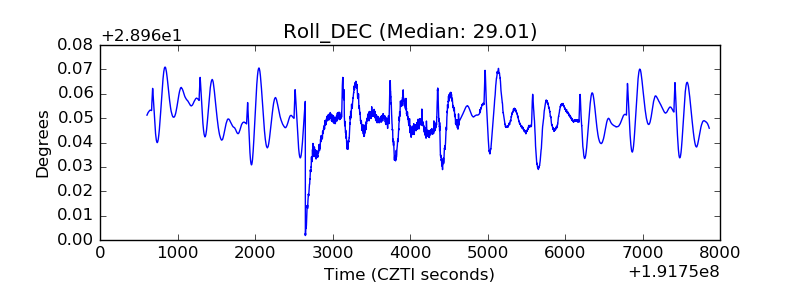 |
| _Roll_RA | 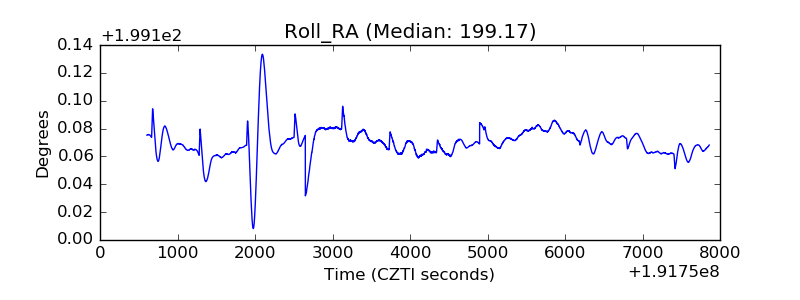 |
| Veto Counter | 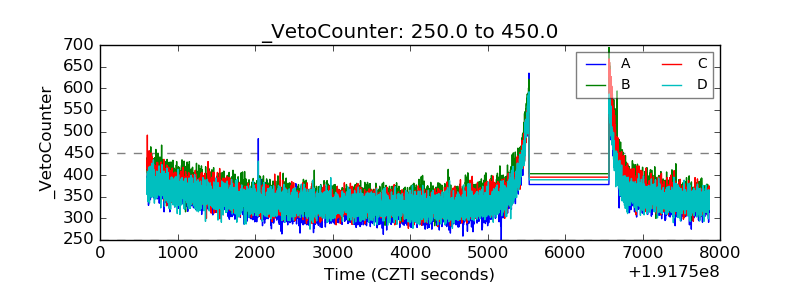 |