| Param | Original file | Final file |
|---|---|---|
| Filename | modeM0/AS1G02_021T08_9000000302_01826cztM0_level2.evt | modeM0/AS1G02_021T08_9000000302_01826cztM0_level2_quad_clean.evt |
| Size (bytes) | 1,098,771,840 | 74,675,520 |
| Size | 1.0 GB | 71.2 MB |
| Events in quadrant A | 8,212,236 | 450,209 |
| Events in quadrant B | 8,404,865 | 458,801 |
| Events in quadrant C | 7,976,626 | 448,129 |
| Events in quadrant D | 8,234,599 | 432,680 |
| Mode M9 | |||
|---|---|---|---|
| Quadrant | BADHDUFLAG | Total packets | Discarded packets |
| A | 0 | 1 | 0 |
| B | 1 | 1 | 0 |
| C | 1 | -1 | -1 |
| D | 1 | -1 | -1 |
| Mode M0 | |||
|---|---|---|---|
| Quadrant | BADHDUFLAG | Total packets | Discarded packets |
| A | 0 | 29192 | 2 |
| B | 0 | 29807 | 2 |
| C | 0 | 28470 | 2 |
| D | 0 | 29314 | 2 |
| Mode SS | |||
|---|---|---|---|
| Quadrant | BADHDUFLAG | Total packets | Discarded packets |
| A | 0 | 136 | 0 |
| B | 0 | 136 | 0 |
| C | 0 | 136 | 1 |
| D | 0 | 136 | 0 |
| Quadrant | Total seconds | Saturated seconds | Saturation percentage |
|---|---|---|---|
| A | 6763 | 78 | 1.153334% |
| B | 6763 | 63 | 0.931539% |
| C | 6763 | 57 | 0.842821% |
| D | 6763 | 232 | 3.430430% |
Noise dominated data is calculated using 1-second bins in cleaned event files. If a bin has >2000 counts, and if more than 50% of those come from <1% of pixels, then it is considered to be noise-dominated and hence unusable.
| Quadrant | # 1 sec bins | Bins with >0 counts | Bins with >2000 counts | High rate bins dominated by noise | Noise dominated (total time) | Noise dominated (detector-on time) | Marked lightcurve |
|---|---|---|---|---|---|---|---|
| A | 7518 | 6765 | 300 | 300 | 3.99% | 4.43% | 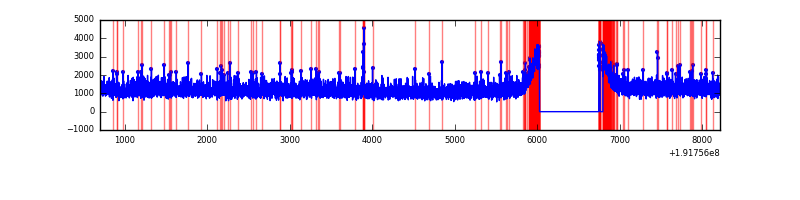 |
| B | 7518 | 6765 | 278 | 278 | 3.70% | 4.11% | 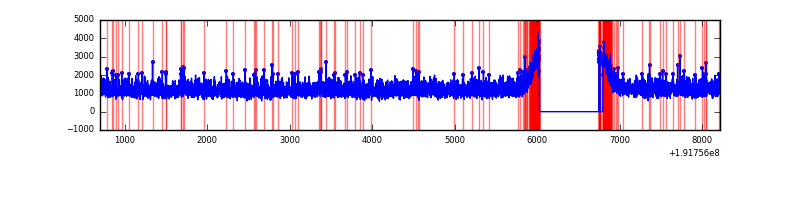 |
| C | 7518 | 6764 | 239 | 239 | 3.18% | 3.53% | 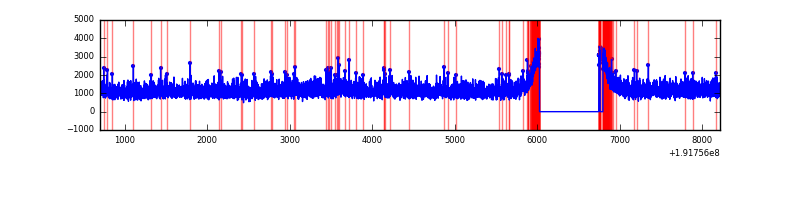 |
| D | 7518 | 6764 | 515 | 515 | 6.85% | 7.61% | 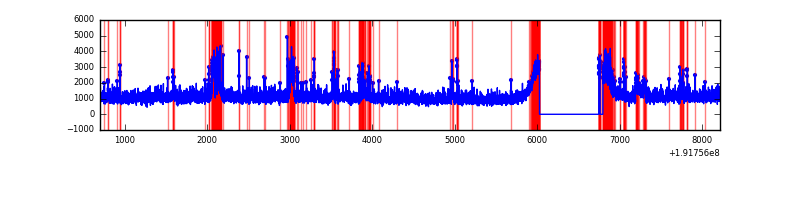 |
Top three noisy pixels from each quadrant. If the there are fewer than three noisy pixels in the level2.evt file, extra rows are filled as -1
| Pixel properties | Quadrant properties | ||||||
|---|---|---|---|---|---|---|---|
| Quadrant | DetID | PixID | Counts | Sigma | Mean | Median | Sigma |
| A | 15 | 236 | 27819 | 49.57 | 2139 | 2157 | 517.7 |
| A | 10 | 2 | 6835 | 9.04 | 2139 | 2157 | 517.7 |
| A | 0 | 5 | 4879 | 5.26 | 2139 | 2157 | 517.7 |
| B | 0 | 234 | 24433 | 42.49 | 2207 | 2223 | 522.7 |
| B | 0 | 229 | 10102 | 15.07 | 2207 | 2223 | 522.7 |
| B | 0 | 220 | 9616 | 14.14 | 2207 | 2223 | 522.7 |
| C | 15 | 246 | 120637 | 210.23 | 2009 | 2078 | 563.9 |
| C | 12 | 4 | 12455 | 18.4 | 2009 | 2078 | 563.9 |
| C | 7 | 159 | 6920 | 8.59 | 2009 | 2078 | 563.9 |
| D | 7 | 85 | 342607 | 562.74 | 1954 | 2025 | 605.2 |
| D | 7 | 34 | 136109 | 221.55 | 1954 | 2025 | 605.2 |
| D | 13 | 105 | 125766 | 204.46 | 1954 | 2025 | 605.2 |
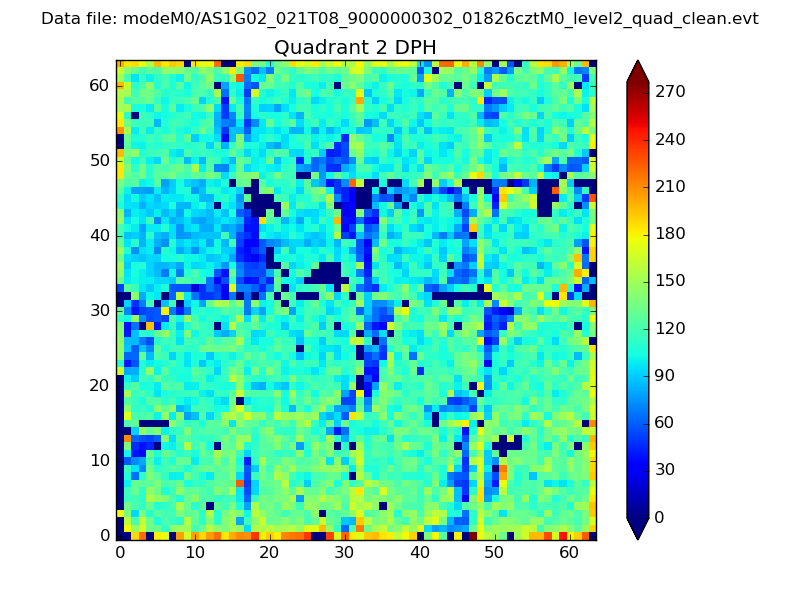
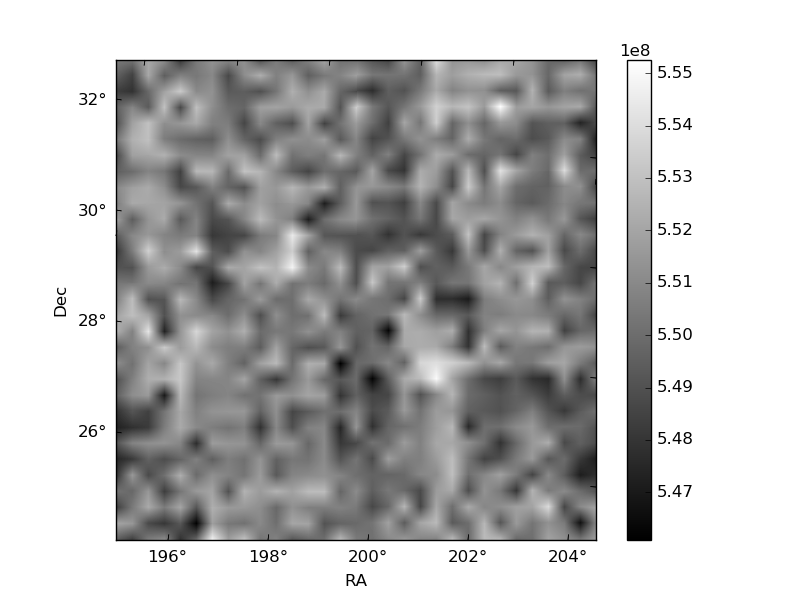
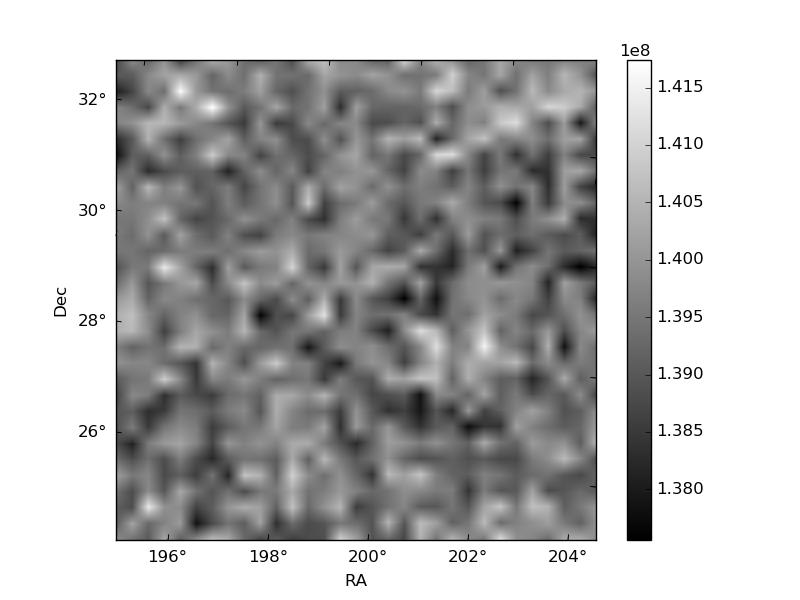
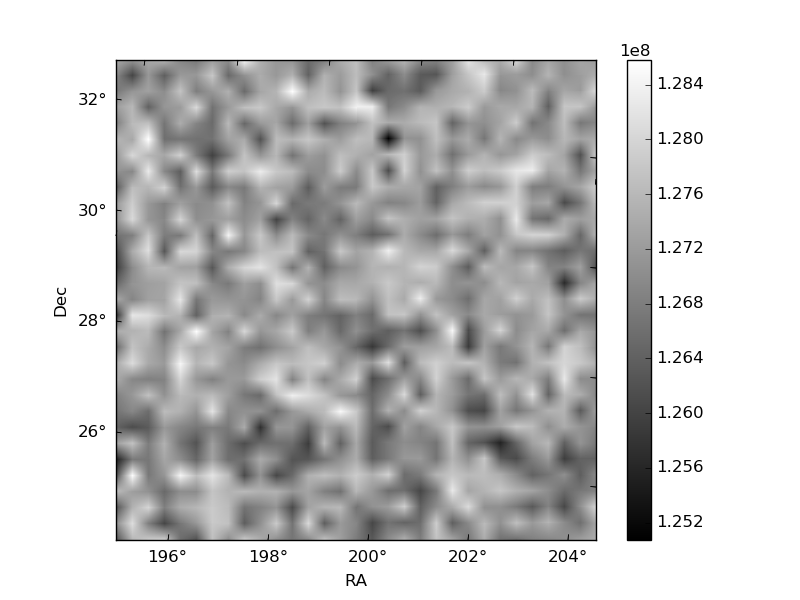
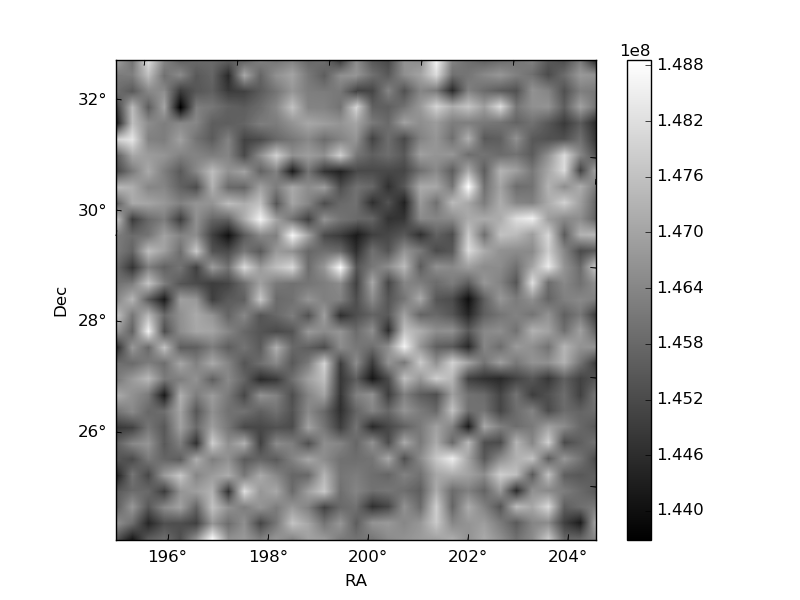
Histogram calculated using DETX and DETY for each event in the final _common_clean file
| Quadrant A | 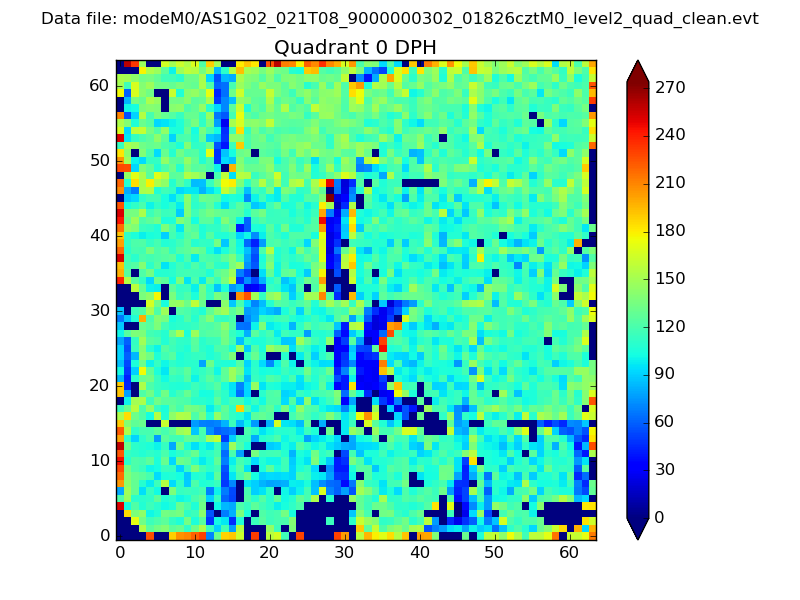 |
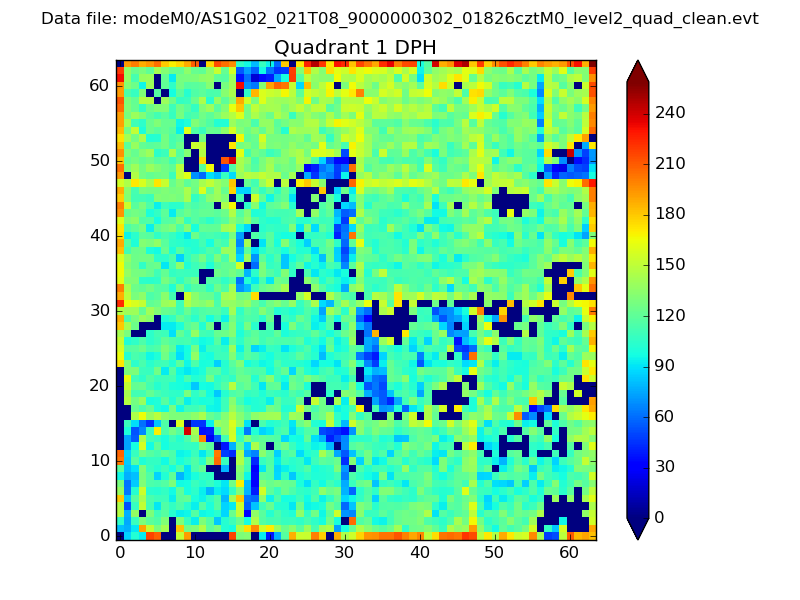 |
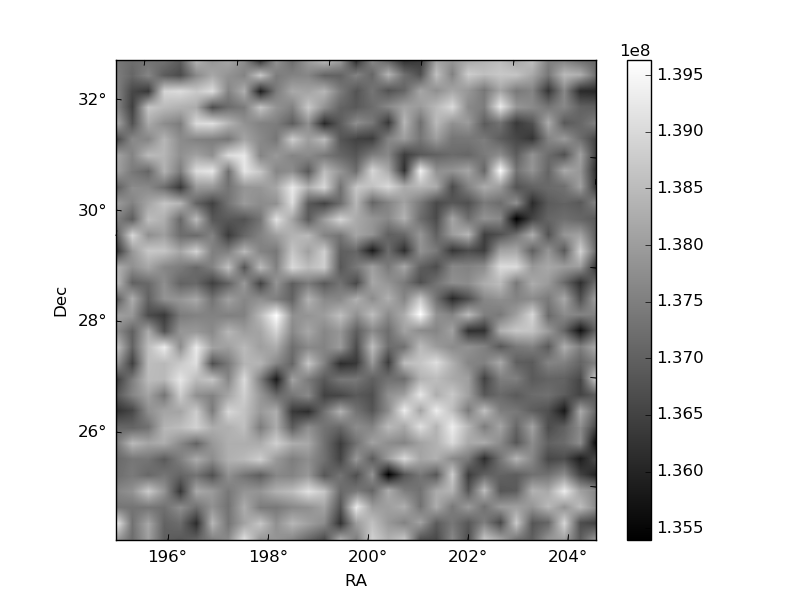
Quadrant B |
|---|---|---|---|
| Quadrant D | 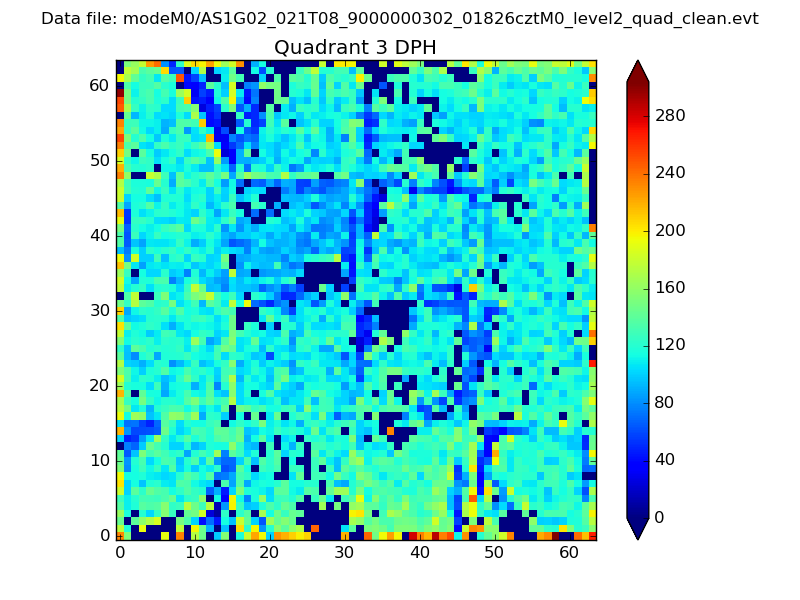 |
 |
Quadrant C |
| Plot type | Count rate plots | Images |
|---|---|---|
| Comparison with Poisson distribution Blue bars denote a histogram of data divided into 1 sec bins. Red curve is a Poisson curve with rate = median count rate of data. |
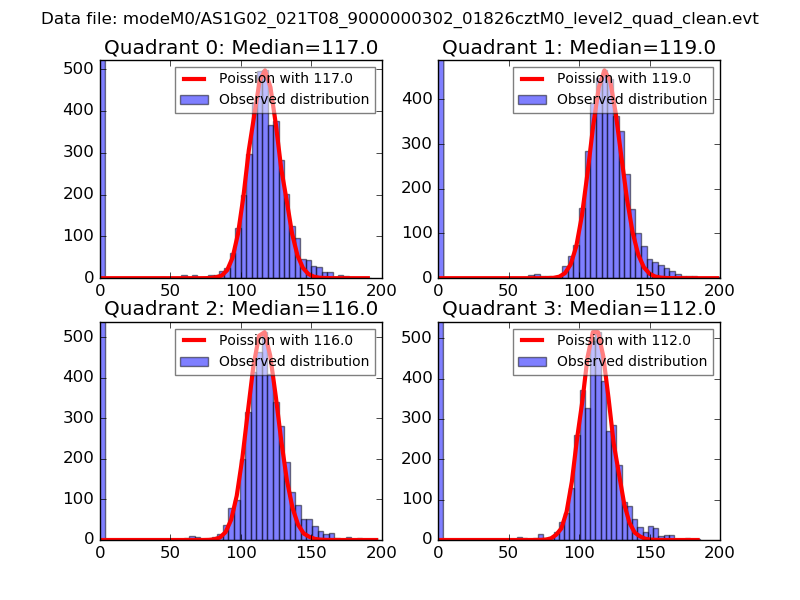 |
 |
| Quadrant-wise count rates Data is divided into 100 sec bins |
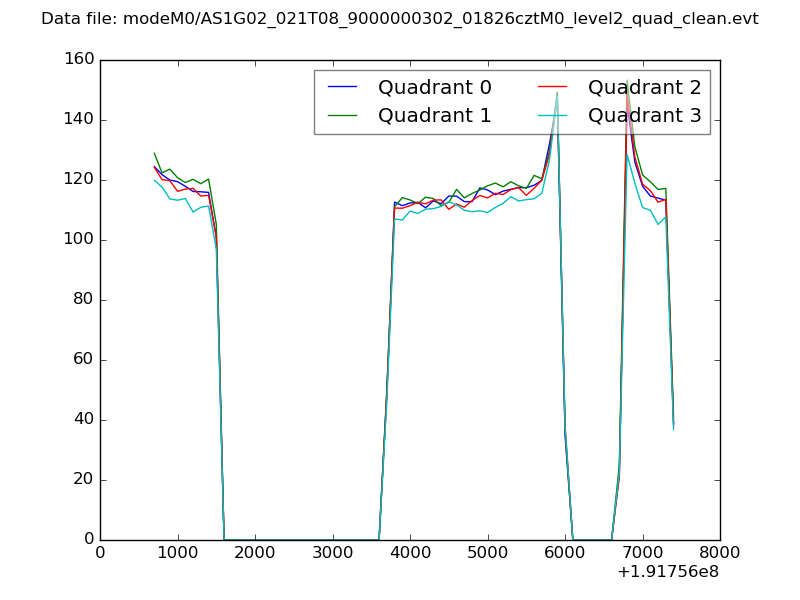 |
|
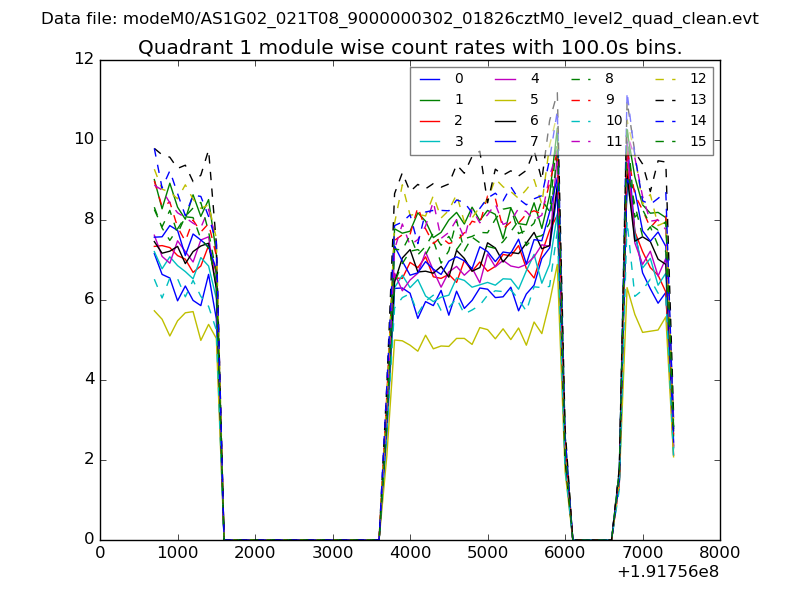
| Module-wise count rates for Quadrant A Data is divided into 100 sec bins |
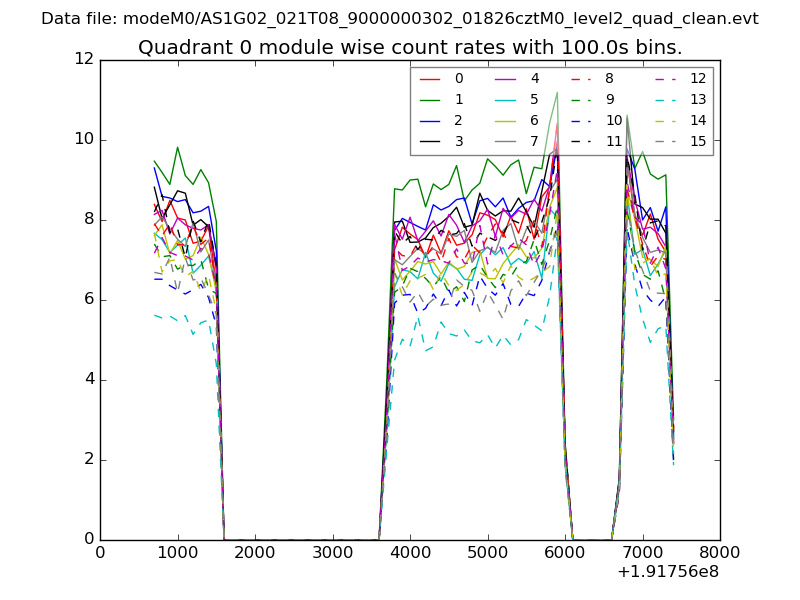 |
 |
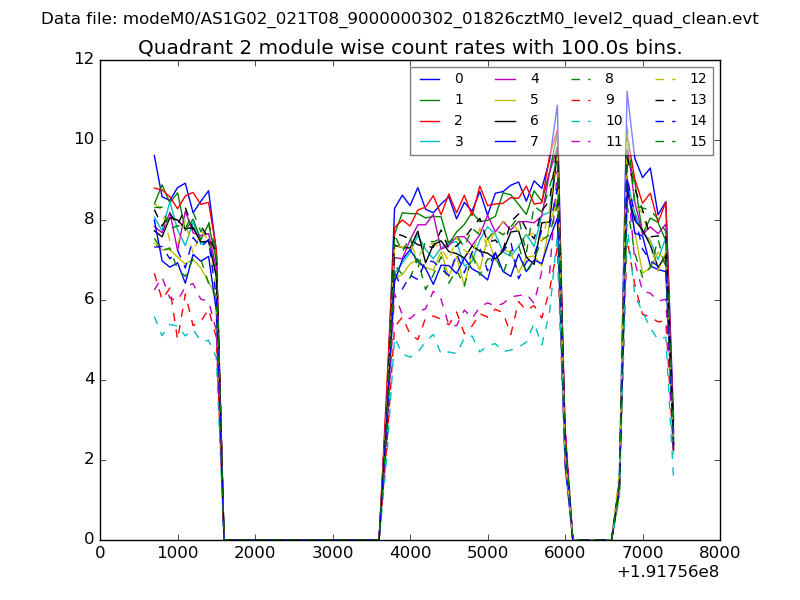
| Module-wise count rates for Quadrant B Data is divided into 100 sec bins |
 |
 |
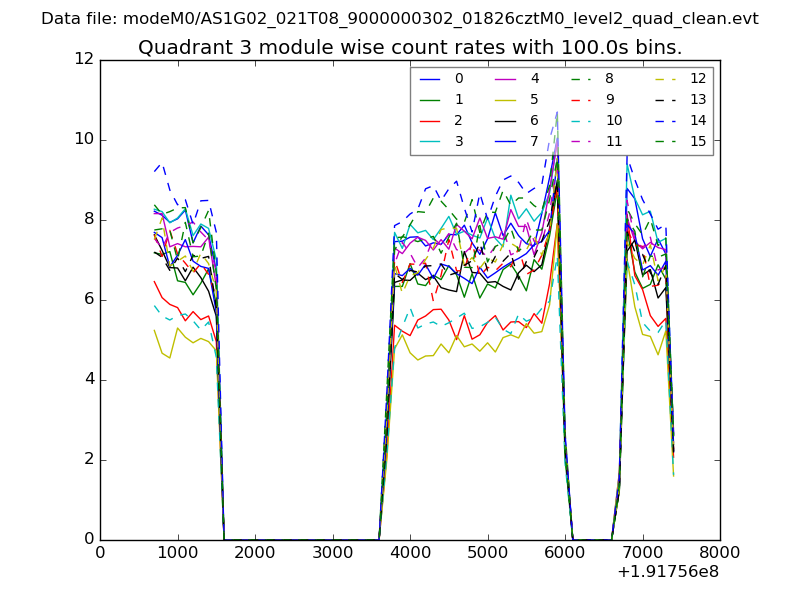
| Module-wise count rates for Quadrant C Data is divided into 100 sec bins |
 |
 |
| Module-wise count rates for Quadrant D Data is divided into 100 sec bins |
 |
 |
| Parameter | Plot |
|---|---|
| CZT HV Monitor | 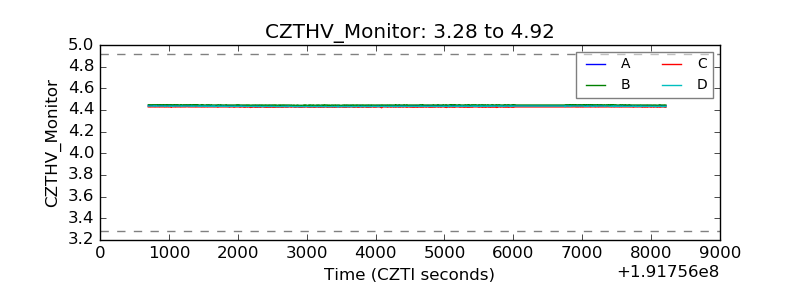 |
| D_VDD | 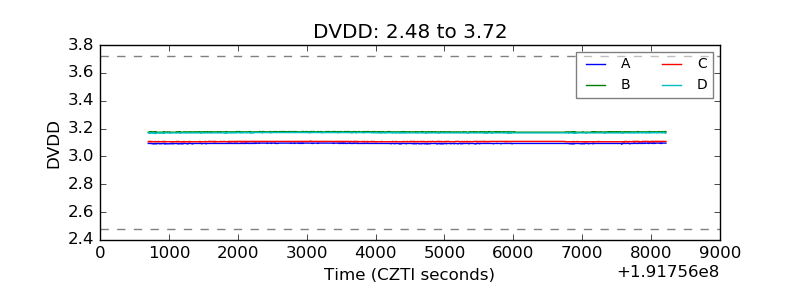 |
| Temperature 1 | 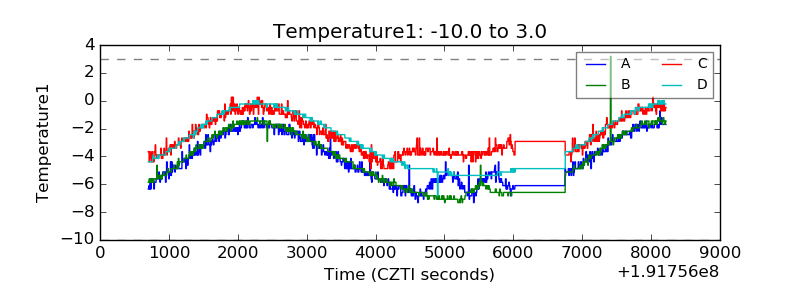 |
| Veto HV Monitor | 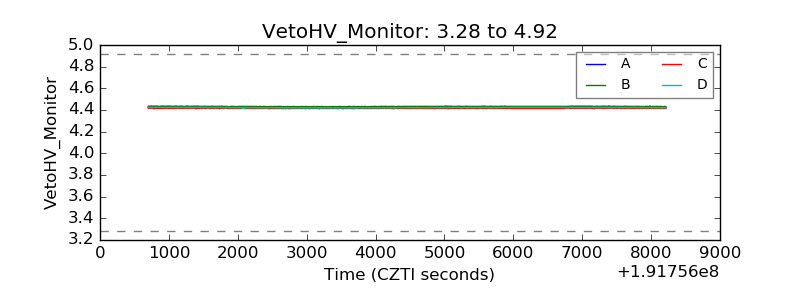 |
| Veto LLD | 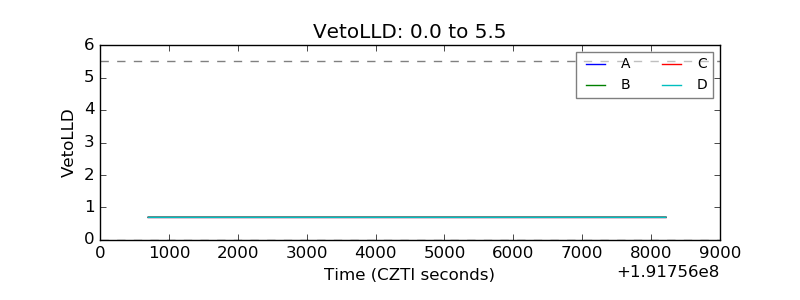 |
| Alpha Counter | 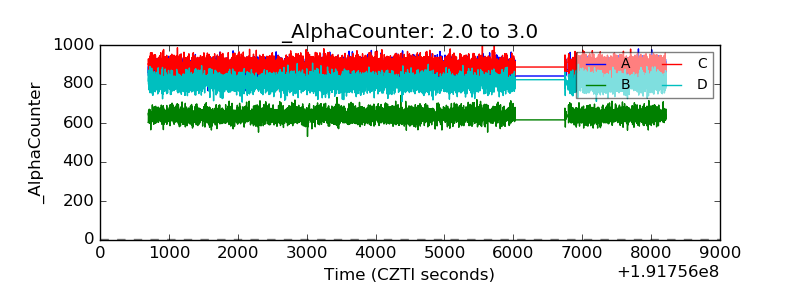 |
| _CPM_Rate | 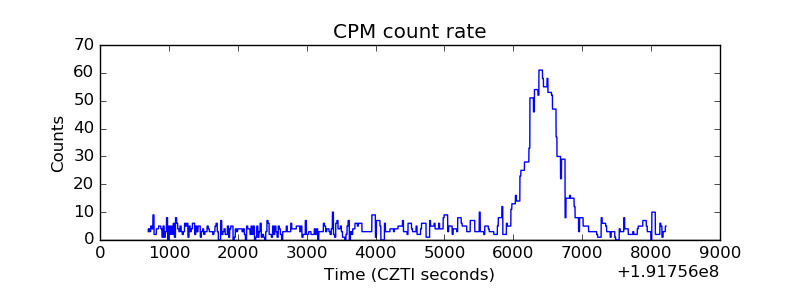 |
| CZT Counter | 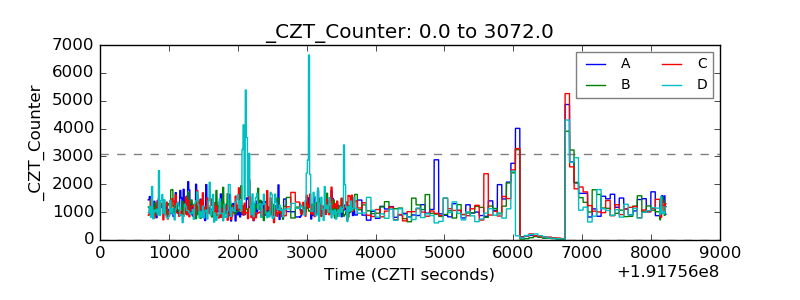 |
| +2.5 Volts monitor | 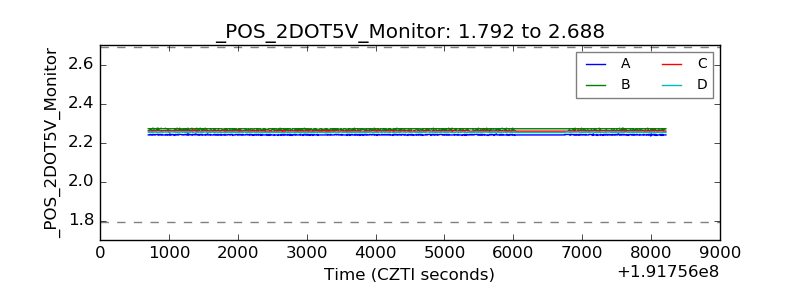 |
| +5 Volts monitor | 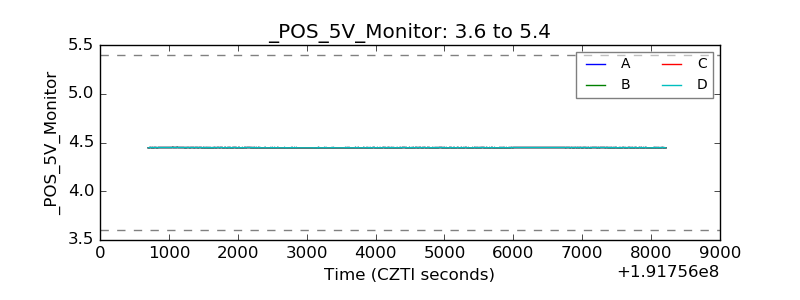 |
| _ROLL_ROT | 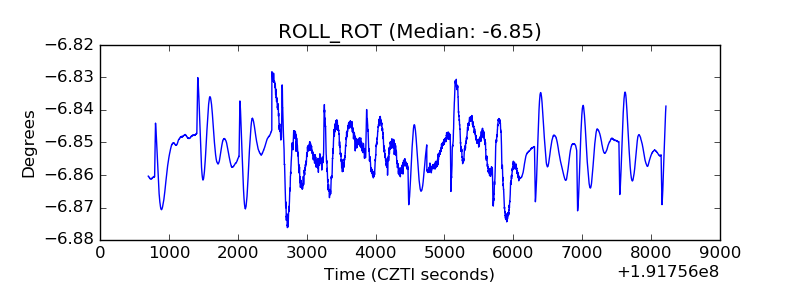 |
| _Roll_DEC | 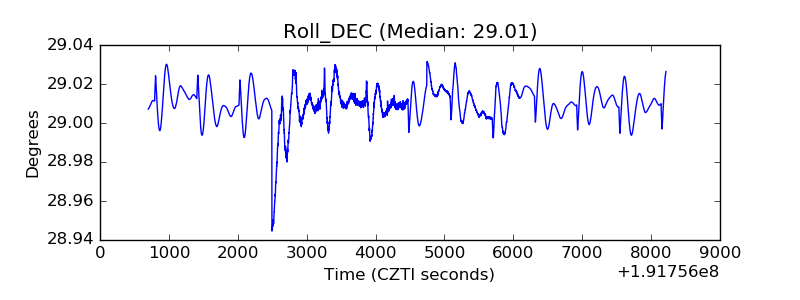 |
| _Roll_RA | 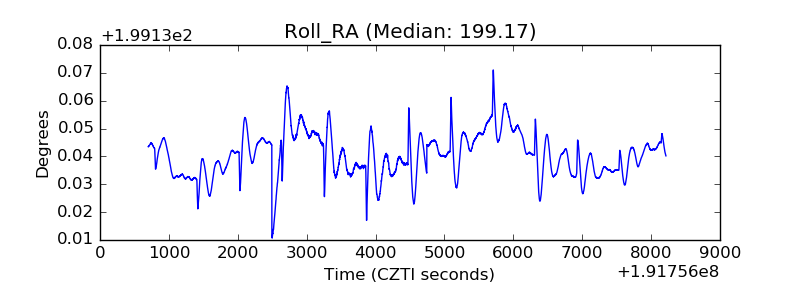 |
| Veto Counter | 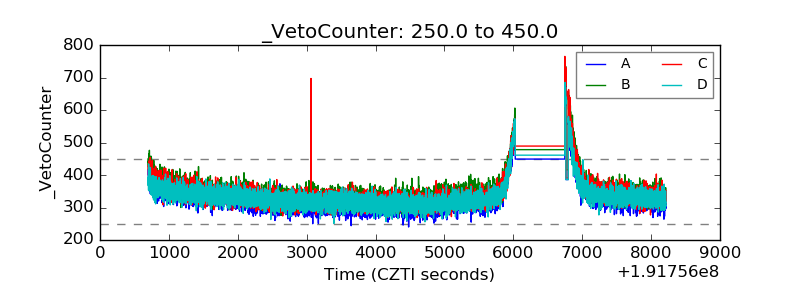 |